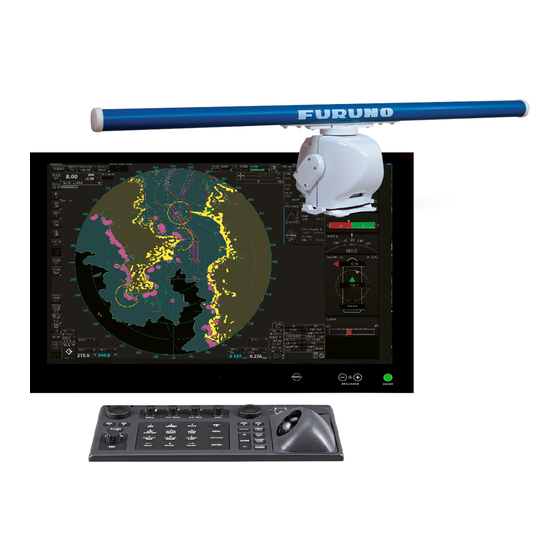
Furuno FAR-3210 Operator's Manual
Chart radar
Hide thumbs
Also See for FAR-3210:
- Operator's manual (556 pages) ,
- Installation manual (245 pages) ,
- Instruction manual (99 pages)
Table of Contents
Advertisement
Quick Links
Advertisement
Table of Contents
Troubleshooting

Related Manuals for Furuno FAR-3210


Summary of Contents for Furuno FAR-3210
- Page 1 OPERATOR'S MANUAL CHART RADAR FAR-3210 FAR-3220 FAR-3230S FAR-3230S-SSD FAR-3310 FAR-3320 FAR-3330S FAR-3330S-SSD FAR-3320W FAR-3330SW FAR-3210-BB FAR-3220-BB FAR-3230S-BB FAR-3230S-SSD-BB FAR-3220W-BB FAR-3230SW-BB Model (Product Name: MARINE RADAR) www.furuno.com...
- Page 2 The paper used in this manual is elemental chlorine free. ・FURUNO Authorized Distributor/Dealer 9-52 Ashihara-cho, Nishinomiya, 662-8580, JAPAN A : APR 2014 Printed in Japan All rights reserved. B2 : DEC . 15, 2014 Pub. No. OME-36160-B2 ( YOTA ) FAR-3000SERIES...
- Page 3 How to discard a used battery Some FURUNO products have a battery(ies). To see if your product has a battery, see the chapter on Maintenance. Follow the instructions below if a battery is used. Tape the + and - terminals of battery before disposal to prevent fire, heat generation caused by short circuit.
- Page 4 Distances at which RF radiation level of 100, 50 and 10 W/m are given in the table below. Magnetron radar Radar model Transceiver Magnetron Antenna 100W/m 50W/m 10W/m FAR-3210/ FNE1201 XN12CF RTR-105 0.6 m 1.4 m 4.4 m FAR-3310/ 0.4 m 0.9 m 3.0 m...
- Page 5 TT, to ensure contact a FURUNO service techni- required targets will not be lost or cian. unnecessary targets, like sea returns...
- Page 6 Do not remove the label(s). If a label is missing or damaged, contact a The plotting accuracy and response of this FURUNO agent or dealer about replacement. TT meets IMO standards. Tracking accuracy is affected by the following: Name:...
-
Page 7: Table Of Contents
Processor Unit EC-3000.................1-5 1.2 How to Turn the System On/Off .................1-5 1.3 How to Select a Color Palette..................1-6 1.4 How to Adjust the Display Brilliance (FURUNO monitor) ...........1-7 1.5 Operating Modes ......................1-8 1.5.1 How to select an operating mode ..............1-8 1.5.2... - Page 8 TABLE OF CONTENTS RADAR, CHART RADAR OPERATION..............2-1 2.1 How to Transmit ......................2-1 2.2 How to Tune the Radar Receiver................2-1 2.2.1 Tuning for magnetron radar ................2-1 2.3 Pulse Length ......................2-2 2.3.1 How to select a pulse length ................2-2 2.3.2 How to change the pulse length..............
- Page 9 TABLE OF CONTENTS 2.23.2 How to adjust PI line orientation, PI line interval ..........2-31 2.23.3 How to select the number of PI lines to display..........2-31 2.23.4 How to select the bearing reference for the PI line ........2-31 2.23.5 How to select the PI lines orientation ............2-32 2.23.6 How to reset PI lines ..................2-32 2.23.7 How to adjust PI line length ................2-32 2.24 Zoom ........................2-33...
- Page 10 TABLE OF CONTENTS 2.41.8 Notes details ....................2-64 2.42 Radar Observation ....................2-65 2.42.1 General ......................2-65 2.42.2 False echoes....................2-66 2.42.3 RACON ......................2-68 2.42.4 Radar Target Enhancer (RTE) ..............2-68 2.42.5 Solid state radar ................... 2-69 TARGET TRACKING (TT) ..................3-1 3.1 About TT ........................3-1 3.2 How to Show, Hide the TT Display ................
- Page 11 TABLE OF CONTENTS 4.3 AIS Symbols .......................4-3 4.4 How to Filter Sleeping AIS Targets ................4-5 4.5 How to Activate Targets .....................4-5 4.5.1 How to activate specific target................4-5 4.5.2 How to automatically activate targets .............4-6 4.6 How to Sleep Targets ....................4-6 4.6.1 How to sleep an activated AIS target .............4-6 4.6.2...
- Page 12 TABLE OF CONTENTS 5.13.2 How to erase track ..................5-14 5.14 Route Display......................5-14 5.15 User Chart Display ....................5-15 CHART OVERVIEW....................6-1 6.1 Chart Screen Overview ....................6-1 6.1.1 Electronic chart area ..................6-2 6.1.2 Status bar....................... 6-3 6.1.3 InstantAccess bar................... 6-5 6.1.4 Sensor information box ..................
- Page 13 TABLE OF CONTENTS 7.4.1 How to register the eToken ................7-6 7.4.2 How to install the C-MAP database..............7-6 7.4.3 How to install C-MAP licenses ...............7-8 7.4.4 How to generate and order an update file ............7-9 7.4.5 How to apply the update file ................7-9 7.5 How to Delete a C-MAP Database ................7-9 7.6 How to Install C-MAP DL (Dynamic Licensing) Charts..........7-10 7.6.1...
- Page 14 TABLE OF CONTENTS 9.1.3 Permanent warnings for S57 charts............... 9-3 9.2 Chart Viewing Dates and Seasonal Features of the S57 Chart ......... 9-4 9.2.1 Introduction ....................9-4 9.2.2 How to approve and highlight S57 chart updates .......... 9-4 9.2.3 How to set Display date and Approved until dates......... 9-5 9.2.4 About chart viewing date dependency of S57 standard.........
- Page 15 TABLE OF CONTENTS 12.7 Route Optimization ....................12-14 12.7.1 Available route optimization strategies ............12-14 12.7.2 How to optimize a route................12-15 12.7.3 How to plan a speed profile ................12-16 12.8 How to Import Routes.....................12-17 12.8.1 How to import FMD-3xx0, FCR-2xx9, FAR-3xx0 route data ......12-17 12.8.2 How to import FEA-2x07 route data ............12-17 12.8.3 How to import csv, ASCII format route data ..........12-18 12.9 How to Export Route Data..................12-18...
- Page 16 TABLE OF CONTENTS 15.5 Predictor........................15-5 15.6 Anchor Watch......................15-6 15.7 UKC (Under Keel Clearance)................... 15-7 15.7.1 UKC overview ....................15-7 15.7.2 How to set UKC.................... 15-7 15.7.3 UKC window....................15-8 15.8 Mini Conning Display ....................15-9 15.9 Divider ........................15-10 15.9.1 How to use the divider................
- Page 17 TABLE OF CONTENTS 19. RECORDING FUNCTIONS .................19-1 19.1 How to Record User, Position Events ..............19-1 19.1.1 User events ....................19-1 19.1.2 Position events .....................19-2 19.2 Details Log........................19-5 19.3 Voyage Log ......................19-6 19.3.1 How to set conditions of logging..............19-8 19.4 Chart Usage Log ......................19-8 19.5 Danger Targets Log....................19-10 19.5.1 How to set the conditions for logging danger targets .........19-11 20.
- Page 18 TABLE OF CONTENTS APPENDIX 1 MENU TREE ..................AP-1 APPENDIX 2 ABBREVIATIONS, SYMBOLS ............AP-9 APPENDIX 3 DATA COLOR AND MEANING............AP-22 SPECIFICATIONS .....................SP-1 INDEX.......................... IN-1...
-
Page 19: Foreword
FOREWORD Congratulations on your choice of the FURUNO FAR-3xx0 Series Marine Radar. We are confident you will see why the FURUNO name has become synonymous with quality and reliability. Since 1948, FURUNO Electric Company has enjoyed an enviable reputation for innovative and dependable marine electronics equipment. - Page 20 FOREWORD • New HMI (Human Machine Interface) gives improved operability. • Accepts SXGA, UXGA video inputs. • SOLAS category 1 compatible display (23.1”), SOLAS category 2 compatible display (19.0”). • Radar, chart and chart radar modes. (The chart radar mode does not meet the criteria for nav- igation aid for Japanese flag vessels as defined by Japanese law.) •...
- Page 21 • “C-MAP” means “C-MAP by Jeppesen”. • The display colors mentioned in this manual are those with the color palette setting “Day-Gray”. Program Number Please access the following URL if you need software information: http://www.furuno.com/en/business_product/merchant/product/chartradar/software.html System Program no. Version no.
- Page 22 GPL or LGPL as published by the Free Software Foundation. Please access to the following URL if you need source codes: https://www.furuno.co.jp/cgi/cnt_oss_e01.cgi This product uses the software module that was developed by the Independent JPEG Group.
-
Page 23: System Configurations
EPFS meeting the requirements of the IMO resolution MSC.112(73). SDME meeting the requirements of IMO resolution MSC.96(72). The radar may be interconnected via HUB-3000 to other FURUNO processing units having approved LAN ports. Basic configuration is shown with solid line. - Page 24 SYSTEM CONFIGURATIONS FAR-3320W/FAR-3220W-BB ANTENNA UNIT TRANSCEIVER (w/Performance Monitor UNIT Sub display PM-32A) Waveguide RTR-108 XN20CF-RSB-130 XN24CF-RSB-130 Antenna Cable 100-115/220-230 VAC 1ø, 50-60 Hz (for de-icer) PSU-014 100-230 VAC POWER 1ø, 50-60 Hz SUPPLY UNIT 440 VAC Transformer Serial 1ø, 50-60 Hz RU-1803 Sensor Adapter or Switching HUB...
- Page 25 SYSTEM CONFIGURATIONS FAR-3230S/FAR-3330S/FAR-3230S-BB ANTENNA UNIT (w/Performance Monitor PM-52A) SN36CF-RSB-129 TRANSCEIVER UNIT RTR-107 Sub display Antenna Cable 100-115/220-230 VAC 1ø, 50-60 Hz (for de-icer) PSU-014 or PSU-015 100-230 VAC POWER SUPPLY 1ø, 50-60 Hz UNIT 440 VAC Transformer Serial 1ø, 50-60 Hz RU-1803 Sensor Adapter or Switching HUB...
- Page 26 SYSTEM CONFIGURATIONS FAR-3330SW/FAR-3230SW-BB ANTENNA UNIT (w/Performance Monitor PM-52A) SN36CF-RSB-131 TRANSCEIVER Sub display UNIT Coaxial cable RTR-109 Antenna Cable 100-115/220-230 VAC 1ø, 50-60 Hz (for de-icer) PSU-014 or PSU-015 100-230 VAC POWER SUPPLY 1ø, 50-60 Hz UNIT 440 VAC Transformer Serial 1ø, 50-60 Hz RU-1803 Sensor Adapter...
- Page 27 SYSTEM CONFIGURATIONS FAR-3230S-SSD/FAR-3330S-SSD/FAR-3230S-SSD-BB ANTENNA UNIT (w/Performance Monitor PM-52B) SN36CF-RSB-133 TRANSCEIVER UNIT RTR-111 Sub display Antenna Cable 100-115/220-230 VAC 1ø, 50-60 Hz (for de-icer) PSU-016 or PSU-018 100-230 VAC POWER SUPPLY 1ø, 50-60 Hz UNIT 440 VAC Transformer Serial 1ø, 50-60 Hz RU-1803 Sensor Adapter or Switching HUB...
- Page 28 SYSTEM CONFIGURATIONS Category of units Antenna units: Exposed to the weather Other units: Protected from the weather Notes 1. The gyrocompass must be type approved for compliance with IMO resolution A.424(XI) (and/ or resolution A.821(19) for installation on HSC). The gyrocompass must also have an update rate that is adequate for the ship’s rate of turn.
-
Page 29: Operational Overview
[Customize] menu. Control Description Turns the system on or off. (With a FURUNO monitor unit, the monitor is also turned on or off with this switch.) Status LED The color and state of the LED change according to system or alert status. -
Page 30: Index
Selects the buttons on the InstantAccess bar. knob Goes back one step in current operating sequence on the InstantAccess bar. BRILL Rotate: Adjusts the brilliance of the display (FURUNO-supplied monitor only). Push: Selects a color palette. A/C RAIN Rotate: Suppresses rain clutter. - Page 31 1. OPERATIONAL OVERVIEW Control Description PANEL • Adjusts the backlighting of the keys. • Enters the numeric 0. • Selects like-numbered menu item. MARK • Goes forward one page in the menu. • Moves cursor rightward in text box. • Inputs selected mark on the radar screen, at the position selected. ENTER Confirms selection on menu.
-
Page 32: Trackball Control Unit Rcu-026
Control Description Power switch Turns the system on or off. (With a FURUNO monitor unit, the monitor is also turned on or off with this switch.) Status LED The color and state of the LED change according to system or alert status. -
Page 33: Processor Unit Ec-3000
1. OPERATIONAL OVERVIEW 1.1.3 Processor Unit EC-3000 The Processor Unit is the heart of the chart system, and is mainly responsible for the chart management, route planning and route navigation. The Processor Unit has two power switches. The Mains switch controls the power from the switchboard, and the Power switch controls the power to the chart radar sys- tem. -
Page 34: How To Select A Color Palette
1. OPERATIONAL OVERVIEW Note 2: If the ambient temperature is less than 0°C (32°F) when the power is applied, nothing appears on the display and the Status LED on the Control Unit flashes. This is because the heater is warming the unit. The display appears in approx. two minutes. How to power off the system Press the power switch on the Processor Unit or a Control Unit. -
Page 35: How To Adjust The Display Brilliance (Furuno Monitor)
The brilliance setting is defined according to the color palette setting (see section 1.3). However, manual adjustment of the brilliance is also possible. Note 1: The brilliance of the FURUNO monitor can only be adjusted from the Control Unit. Use a serial cable for brilliance adjustment to make the connection between the Processor Unit and the Control Unit. -
Page 36: Operating Modes
1. OPERATIONAL OVERVIEW How to adjust the brilliance manually using the trackball module 1. Click the [BRILL] button on the InstantAccess bar to show the brilliance adjust- ment window. 2. For coarse adjustment, put the cursor on a location within the slider bar area then push the left button. -
Page 37: Display Screens
1.6.1 Radar display The illustration below shows the markers, data, etc. as they appear on the FURUNO 19-inch monitor unit. The layout for the 23-inch monitor unit is partially different - the button appears on the bottom of the InstantAccess bar. - Page 38 1. OPERATIONAL OVERVIEW Name Description Sensor information, Shows your ship's heading, heading source, ship's speed, water datum box tracking speed, speed source, course over ground, speed over ground, course and speed source, ship's position, position source, chart datum. Note: Position source shall meet the requirements of IMO MSC.112(73).
-
Page 39: Chart Radar Display
1. OPERATIONAL OVERVIEW How to minimize, maximize the boxes at the bottom of the screen The boxes at the bottom of the screen that contain an arrow can be minimized. Click the arrow to minimize the box. To restore maximum size, click the minimized box. Click arrow to minimize. -
Page 40: Chart Display
1. OPERATIONAL OVERVIEW 1.6.3 Chart display The chart display shows only the electronic chart. Click the [Operating Mode] button to select [CHART for RADAR] to activate this display. See chapter 6 for a description of the chart display. Select [CHART for RADAR]. CHART for RADAR 0.5NM 4min... -
Page 41: Status Bar
1. OPERATIONAL OVERVIEW Status Bar The Status bar is displayed at the top of screen in all modes. This bar provides, in the radar and chart radar modes, buttons for selection of the mode, antenna and chart da- tabase, and adjustment of the radar picture. For a description of the Status bar used in the chart mode, see paragraph 6.1.2. -
Page 42: How To Operate The Buttons, Slider Bars On The Status Bar
1. OPERATIONAL OVERVIEW 1.7.2 How to operate the buttons, slider bars on the Status bar The Status bar has three types of controls: toggle button, drop-down list button and slider bar. You operate the buttons and bars with the trackball module. Control type Example of control Toggle button... -
Page 43: Instantaccess Bar
For a description of the InstantAccess bar used in the chart mode, see paragraph 6.1.3. *1: For solid state radar, [TX CH] icon is displayed instead of [TUNE]. *2: This button is not displayed on the FURUNO 19-inch monitor unit. CU/TM CU/TM... - Page 44 AIS message Displays screen for “received AIS messages”. Palette Selects a color palette. BRILL Adjusts the brilliance of a FURUNO monitor. Enters a MOB mark at the current position. Capture Takes a screenshot. UNDO Restores previous condition in radar map and text input.
-
Page 45: How To Operate The Buttons, Slider Bars On The Instantaccess Bar
1. OPERATIONAL OVERVIEW 1.8.1 How to operate the buttons, slider bars on the InstantAccess The InstantAccess bar has three types of controls: toggle button, drop-down list button and slider bar. (The MOB and Capture buttons are special buttons.) You operate the buttons and bars with the trackball module or the InstantAccess knob. -
Page 46: Sensor Information, Datum Box
1. OPERATIONAL OVERVIEW Sensor Information, Datum Box Sensor information, datum box displays the sensor data and the name of the datum in use. The sensor indications and names are colored according to sensor state. See the ta- ble below. • HDG: Heading and its source. •... -
Page 47: Menu Overview
1. OPERATIONAL OVERVIEW 1.10 Menu Overview The menu consists of eight main menus and several sub menus. You can operate the menu with the Radar Control Unit or trackball module. The system closes open menus whenever there is no menu operation for 30 seconds. 1.10.1 Basic menu operation 1. -
Page 48: Menu History Feature
1. OPERATIONAL OVERVIEW Keys, buttons to use in menus Control Unit MENU key: Open main menu, or close menu. CANCEL key: Go back one layer in menu, or close menu when main menu is dis- played. ←key: Return to main menu, in no. 2 layer or higher. Trackball module Right button: Go back one layer, or close menu when main menu is displayed. -
Page 49: How To Enter Numeric Data
1. OPERATIONAL OVERVIEW 1.10.3 How to enter numeric data Select the numeric data, then do one of the following: Control Unit: Use the ten keys to enter data. Trackball module: Spin the scrollwheel to set data then push the left button. 1.10.4 How to enter alphanumeric character data Some operations display a software keyboard to enter alphanumeric character data. -
Page 50: Context-Sensitive Menus In The Radar Mode
1. OPERATIONAL OVERVIEW 1.11 Context-Sensitive Menus in the Radar Mode Context-sensitive menus are available with many of the boxes and buttons surround- ing the display area and objects within the display area. Right-click the boxes and but- tons marked with numerals in the illustration below to show the related context- sensitive menus. - Page 51 1. OPERATIONAL OVERVIEW Box name Menu Box name Menu Vector Time Vector Time (30 s - Vector Reference True-G(S), REL, OS 60 min), OS Vector Vector Menu, Target Menu, Target Vector Vector Menu Menu CPA Range CPA Range CPA time CPA Time (0.5 - 20 NM) (1 - 60 min)
-
Page 52: Context-Sensitive Menus In The Display Area In The Radar And Chart Radar Modes
1. OPERATIONAL OVERVIEW 1.11.2 Context-sensitive menus in the display area in the radar and chart radar modes Right-click anywhere in the display area in the radar and chart radar modes to show the context-sensitive menu. [Target Data/ACQ/ACT]: For cursor-selected TT or AIS target, display target data, acquire target for TT, or activate sleeping AIS target. -
Page 53: Cursor Position
1. OPERATIONAL OVERVIEW 1.12 Cursor Position Cursor data appears in the cursor position box at the top-right position on the display. The appearance of the box is slightly different between the 23-inch and 19-inch dis- plays, although the content is the same. For the cursor position box that appears in the chart mode, see section 6.6. -
Page 54: How To Enter Ship Speed
The TT and azimuth stabilized presentation modes require own ship speed input and compass signal. The speed can be entered automatically from a speed log (STW, SOG) or GPS (SOG), or manually on the menu. Note that the FURUNO GPS Naviga- tor GP-150 provides COG and SOG. - Page 55 1. OPERATIONAL OVERVIEW ry, then that sensor previously selected to primary state is then automatically selected to secondary state. 3) Select [Bottom] or [Water] at [Stabilization Mode] to set the stabilization meth- od. Select [Bottom] for GPS or [Water] for a speed log. 4) Check [GPS] or [LOG] at [Sensor Type] to select the source of speed data.
-
Page 56: How To Enter Heading
1. OPERATIONAL OVERVIEW 1.15 How to Enter Heading Select manual or automatic heading input as follows: 1. Right-click anywhere in the Sensor information, datum box to show the context- sensitive menu. 2. Click [Select Sensor] then click [Setting]. 3. Use the arrow buttons to select the [HDG] page. Arrow buttons Check for automatic heading input GY001... -
Page 57: How To Mark Mob Position
1. OPERATIONAL OVERVIEW 1.16 How to Mark MOB Position Use the MOB (man overboard) feature to mark the position of man overboard on the display screen. Click the [MOB] button (in any mode) on the InstantAccess bar. [MOB] button The MOB mark instantly appears at the geographical position of your ship when the button is clicked. -
Page 58: How To Select Time Format, Set Local Time
1. OPERATIONAL OVERVIEW 1.18 How to Select Time Format, Set Local Time The GPS navigator feeds time and date data to the chart radar and they appear on the Status bar. Neither the time nor the date can be adjusted, however you can select be- tween UTC time (default) and local time. -
Page 59: The Settings Menu
1. OPERATIONAL OVERVIEW 1.20 The Settings Menu The [Settings] button gives you access to the user profiles and the [Settings] menu. The [Settings] menu has facilities for screenshot management, file management, di- agnostic tests and customizing. See chapter 22. [Settings] button 1.21 User Profiles for Radar, Chart Radar... -
Page 60: How To Restore A Profile To The Default Settings
1. OPERATIONAL OVERVIEW 1.21.4 How to restore a profile to the default settings 1. Click [ ] on the Status bar then click [Manage Profile]. 2. Select a profile number from the “Profile” drop-down list. 3. Click [Restore Default Settings]. The confirmation message "Attention: This profile will be restored to the default. -
Page 61: How To View Chart Software Version No., Chart System Information, And Operator's Manual
1. OPERATIONAL OVERVIEW Items Settings AIS CPA AUTO ACT ALL Operating mode RADAR MAP (Radar map) No change Route No change Alert AZ1/AZ2: OFF, Lost TGT: OFF Antenna connection status No change RANGE RING PI LINE PI1 to PI6: OFF Number of PI line, mode, bearing range truncate: No change SPD (Own Ship Sensor... -
Page 62: Tips (Operational Guidance)
1. OPERATIONAL OVERVIEW The information shown in the following illustration may be different from those on your system. XXXXXXXXXXXXXXXXXXXXXXXXXXXX [Version] tab Startup Time : 06 Jan 2014 09:23:20 Equipment ID : Function : ecdis,radar [System 1] tab [System 2] tab 1.23 Tips (operational guidance) This chart radar provides operational tips for the display area, InstantAccess bar and... -
Page 63: Radar, Chart Radar Operation
RADAR, CHART RADAR OPERATION How to Transmit After the power is turned on and the magnetron has [STBY TX] button warmed*, "ST-BY" appears at the screen center, meaning the radar is ready to transmit radar pulses. You can transmit by pushing the STBY/TX key on the Control Unit, or clicking the [STBY TX] button on the Status bar. -
Page 64: Pulse Length
2. RADAR, CHART RADAR OPERATION Manual tuning To tune the radar, start by setting the brilliance to a comfortable level, adjusting the gain until the background speckle just disappears, and selecting the 48 NM range. Then, do the following: 1. Select a weak contact somewhere near the edge of the screen and concentrate on that, while adjusting the gain control in small steps - allowing at least two sec- onds between each step - until the chosen contact is as big, bright and consistent as possible. -
Page 65: How To Change The Pulse Length
2. RADAR, CHART RADAR OPERATION 2.3.2 How to change the pulse length 1. Click the [Pulse] button at the top of the InstantAccess bar. 2. Click a pulse length. How to Adjust the Sensitivity The GAIN control (or [Gain] button) adjusts the sensitivity of the receiver. The proper setting is such that the background noise is just visible on the screen. -
Page 66: How To Reduce Sea Clutter Automatically
2. RADAR, CHART RADAR OPERATION 2.5.1 How to reduce sea clutter automatically Auto A/C SEA allows for fine-tuning of the A/C SEA circuit, within ±20 dB. Lower the auto A/C SEA level because the average value of the original input echo is low in ar- eas where there are no see surface reflections. -
Page 67: How To Suppress Rain Clutter
2. RADAR, CHART RADAR OPERATION How to Suppress Rain Clutter The vertical beam width of the antenna is designed to see surface targets even when the ship is rolling. However, by this design the unit will also detect rain clutter (rain, snow, or hail) in the same manner as normal targets. -
Page 68: How To Reduce Rain Clutter Manually
2. RADAR, CHART RADAR OPERATION 2.6.2 How to reduce rain clutter manually Control Unit: Push the A/C RAIN control to display [MAN] on the RAIN mode indica- tion on the Status bar. While watching the radar picture, adjust the A/C RAIN control to reduce the clutter. -
Page 69: Interference Rejector
2. RADAR, CHART RADAR OPERATION Interference Rejector Mutual radar interference may occur in the vicinity of an- other shipborne radar operating in the same frequency band. It is seen on the screen as a number of bright spikes either in irregular patterns or in the form of usual- ly curved spoke-like dotted lines extending from the cen- ter to the edge of the picture. -
Page 70: Echo Averaging
2. RADAR, CHART RADAR OPERATION Echo Averaging The echo averaging feature, which requires heading, position and speed data, effec- tively reduces sea clutter. Echoes received from stable targets such as ships appear on the screen at almost the same position every rotation of the antenna. On the other hand, unstable echoes such as sea clutter appear at random positions. -
Page 71: Automatic Clutter Elimination (Ace) Function
2. RADAR, CHART RADAR OPERATION 2.10 Automatic Clutter Elimination (ACE) Function This radar has the Automatic Clutter Elimination (ACE) function. This function detects sea and rain clutter from received echoes’ range and bearing trend and automatically reduces sea and rain clutter according to the Automatic Clutter Elimination (ACE) threshold setting. -
Page 72: Automatic Clutter Elimination (Ace) Menu
2. RADAR, CHART RADAR OPERATION 2.10.3 Automatic Clutter Elimination (ACE) menu Open the menu then select the [ECHO] and [ACE] menus to show the [ACE] menu. • [ADJUST]: No use. MENU • [SIGNAL ENHANCEMENT]: Set the level for the high sensitivity ECHO mode (see paragraph 2.10.4). -
Page 73: Noise Rejector
2. RADAR, CHART RADAR OPERATION 2.11 Noise Rejector White noise may show itself on the screen as random "speckles" spread over the en- tire radar image. This equipment reduces the white noise then improves the on-screen S/N ratio by processing the weighted moving average filter for the received echoes in the range direction. -
Page 74: Wiper
2. RADAR, CHART RADAR OPERATION 2.12 Wiper The wiper feature automatically reduces the brilliance of unwanted weak echoes, such as noise, sea clutter and rain clutter, to clear the picture. There are two wiper settings, 1 and 2. The difference between 1 and 2 is that the brilliance is lowered more slowly in 2. - Page 75 2. RADAR, CHART RADAR OPERATION use the user-programmable presets ([CUSTOM1] or [CUSTOM2]) when frequent ad- justment of the radar image is necessary. ECHO ECHO NOISE AUTO AUTO VIDEO REJECT STRETCH AVERAGE REJECT RAIN CONTRAST OCEAN OFF* OFF* CANAL OFF* OFF* BERTHING OFF* OFF*...
-
Page 76: How To Select A Customized Echo
2. RADAR, CHART RADAR OPERATION 2.13.1 How to select a customized echo Click the [Customize Echo] button on the Status bar to select a customize echo option from the drop-down list. [Customize Echo] button Click to show drop-down list. 2.13.2 How to edit a customized echo You can edit a customized echo as below. -
Page 77: How To Restore A User Customized Echo To The Saved Settings
2. RADAR, CHART RADAR OPERATION 5. Spin the scrollwheel to select 1, 2, 3 or 4 (Dynamic Range) or A, B, C (Curve) as appropriate then push the left button. Refer to the description and illustration be- low. CONTRAST CONTRAST 1-4: Control dynamic range. -
Page 78: How To Suppress Second-Trace Echoes
2. RADAR, CHART RADAR OPERATION 2.14 How to Suppress Second-trace Echoes In certain situations, echoes from very far distance targets may appear as false ech- oes (second-trace echoes) on the screen. This occurs when the return echo is re- ceived one transmission cycle later, or after a next radar pulse has been transmitted. Pulse interval Actual ranges... -
Page 79: How To Select A Presentation Mode
2. RADAR, CHART RADAR OPERATION Mode availability Availability Presentation mode Radar Chart radar Course-up RM Head-up RM STAB Head-up RM North-up RM North-up TM Stern-up RM* *: Not available with IMO or A type. 2.15.1 How to select a presentation mode How to select a presentation mode from the Control Unit Push the MODE key consecutively to select radar presentation mode desired. -
Page 80: Description Of Presentation Modes
2. RADAR, CHART RADAR OPERATION 2.15.2 Description of presentation modes Head-up mode The head-up mode is a display in which the line Heading North marker connecting own ship and the top of the display in- line dicates own ship's heading. The target pips are painted at their measured dis- tances and in their directions relative to own ship's heading. - Page 81 2. RADAR, CHART RADAR OPERATION Sensor Not Available" or "Gyro COM1 Error" (a number between 250-259 according to gyro no.) appears in the [Alert] box. Stern-up mode The stern-up mode is a display in which the line Heading connecting own ship and the top of the display in- line dicates own ship's stern.
-
Page 82: How To Select The Range Scale
2. RADAR, CHART RADAR OPERATION 2.16 How to Select the Range Scale The selected range scale and range ring interval are shown at the top-left position on the screen. When a target of interest comes closer, reduce the range scale so that it appears in 50-90% of the display radius. -
Page 83: How To Measure The Range By Using A Vrm
2. RADAR, CHART RADAR OPERATION 2.17.1 How to measure the range by using a VRM There are two VRMs, No. 1 and No. 2, which appear as dashed rings so that you can distinguish them from the fixed range rings. The two VRMs can be distinguished from each other by the different lengths of their dashes;... -
Page 84: How To Set Vrm Attributes
2. RADAR, CHART RADAR OPERATION 2.17.2 How to set VRM attributes You can customize the VRMs to suit your needs. 1. Open the menu then select [3 NAV TOOL] and [2 EBL•VRM] (B type) or [2 EBL•VRM•CURSOR] (IMO and A types) to display the [EBL•VRM] menu ([EBL•VRM•CURSOR] menu for the IMO and A types). -
Page 85: How To Measure The Bearing To A Target
2. RADAR, CHART RADAR OPERATION 2.18 How to Measure the Bearing to a Target Use the Electronic Bearing Lines (EBLs) to take bearings of targets. There are two EBLs, No. 1 and No. 2. Each EBL is a straight dashed line extending from the own ship position up to the circumference of the radar picture. -
Page 86: How To Select Bearing Reference
2. RADAR, CHART RADAR OPERATION 2.18.2 How to select bearing reference An EBL box has an "R" (relative) if the EBL bearing is relative to own ship's heading; "T" (true) if it is referenced to the north. True or relative indication is available regard- less of presentation mode. -
Page 87: Point Of Reference For Origin Point Of Offset Ebl
2. RADAR, CHART RADAR OPERATION How to assess risk of collision from the context-sensitive menu 1. Right-click the display area to show the context-sensitive menu. 2. Select [EBL Offset] and then [EBL 1] or [EBL 2]. 3. Put the cursor on a target that appears as a threat (A in the figure below). 4. -
Page 88: How To Measure The Range And Bearing Between Two Targets
2. RADAR, CHART RADAR OPERATION 2.20 How to Measure the Range and Bearing Between Two Targets How to measure the range and bearing between two targets from the Control Unit 1. Press the EBL 1 key to activate EBL1. 2. Operate the trackball to place the origin of the EBL 1 on a target of interest. 3. -
Page 89: How To Off-Center The Display
2. RADAR, CHART RADAR OPERATION 2.21 How to Off-center the Display Own ship position, or sweep origin, can be displaced to expand the view field without switching to a larger range scale. The sweep origin can be off-centered to the cursor position, but not more than 75% of the range in use;... -
Page 90: Target Trails
2. RADAR, CHART RADAR OPERATION 2.22 Target Trails The trails of the radar echoes of targets may be displayed in the form of synthetic af- terglow. Target trails are selected either relative or true and may be sea or ground sta- bilized. -
Page 91: Trail Time
2. RADAR, CHART RADAR OPERATION 2.22.3 Trail time Trail time, the trail plotting interval, can be selected with the scrollwheel, left button or right button. The trail timer counts up the trail time and is erased once the terminal count is reached. -
Page 92: Target Trail Attributes On The Trail Menu
2. RADAR, CHART RADAR OPERATION 2.22.7 Target trail attributes on the TRAIL menu [TRAIL GRAD]: The afterglow of the target trails can be shown in a single tone or gradual shading. Monotone Gradual shading (SINGLE) (MULTI) [TRAIL COLOR]: The trail color can be selected from the colors shown in the left figure. -
Page 93: How To Display, Erase A Pi Line
2. RADAR, CHART RADAR OPERATION 2.23.1 How to display, erase a PI line How to display, erase a PI line from the Control Unit Displaying a PI line: Press the INDEX LINE key until desired PI line no. appears. Erasing a PI line: Press the INDEX LINE key until desired PI line no. appears. Press and hold down the INDEX LINE key to erase the PI line. -
Page 94: How To Select The Pi Lines Orientation
2. RADAR, CHART RADAR OPERATION 4. Select [REL] or [TRUE]. 5. Close the menu. 2.23.5 How to select the PI lines orientation 1. Open the menu. 2. Select [3 NAV TOOL] and [1 PI LINE] to show the [PI LINE] menu. 3. -
Page 95: Zoom
2. RADAR, CHART RADAR OPERATION 6. Set the length (setting range: 0.000 to 24.000 NM). Heading line Heading line PI line PI line Own ship position Own ship position Adjust the length Adjust the length forward a PI line. forward a PI line. Adjust the length Adjust the length backward a PI line. -
Page 96: Markers
2. RADAR, CHART RADAR OPERATION 2.25 Markers 2.25.1 Heading line The heading line indicates the ship's heading in all presentation modes. The heading line is a line from the own ship position to the outer edge of the radar display area and appears at zero degrees on the bearing scale in head-up mode. -
Page 97: Vectors
2. RADAR, CHART RADAR OPERATION 2.25.5 Vectors You can show or hide the vector for own ship and reference targets, on the [NAV TOOL] menu. [TARGET VECTOR] menu [REF TARGET VECTOR]: Turn the vector for the reference target on or off. 4 VECTOR COLOR WHT is replaced GRN / BLU / CYA /... -
Page 98: Antenna Marker
2. RADAR, CHART RADAR OPERATION 2. Select [7 BARGE] (B type) or [6 BARGE] (IMO and A types). 3. Select [1 BARGE MARK]. 4. Select [ON] to turn on the barge mark. 5. At [2 BARGE SIZE], enter length (three digits) and width (two digits) of the total number of barges. -
Page 99: How To Adjust Brilliance Of Screen Data
2. RADAR, CHART RADAR OPERATION 2.26 How to Adjust Brilliance of Screen Data You can adjust the relative brilliance levels of various markers and alphanumeric read- outs displayed on the screen. 1. Right-click the [BRILL] button on the InstantAccess bar then select [Brill Menu]. [BRIGHTNESS] menu, page 2 [BRIGHTNESS] menu, page 1 2. -
Page 100: Watch Alert
2. RADAR, CHART RADAR OPERATION 2.27 Watch Alert The watch alert provides a flashing visual alert at regular in- tervals to remind you to monitor the radar picture for safety or other purposes. To enable the watch alert, open the [8 INITIAL SETTING] menu followed by the [4 ALERT] menu. -
Page 101: Information Box
2. RADAR, CHART RADAR OPERATION 2.28 Information Box The information box shows navigation data and, when following a route set on the chart display, route information is also shown. 2.28.1 Information box contents Navigation data • Depth, analog and graph •... -
Page 102: How To Show The Information Box
2. RADAR, CHART RADAR OPERATION Route information The route 1 information displays route name, plan speed, plan course, course to steer, channel limit, and off track. The route 2 information displays waypoint no., distance to WOP (wheel over point), time to go, planning turn radius, turn rate, next waypoint no., bearing to next waypoint. -
Page 103: How To Turn Nav Data On/Off
2. RADAR, CHART RADAR OPERATION 2.28.3 How to turn NAV data on/off Wind, depth, ocean current and water temperature may be set up as follows: 1. Open the menu then select [4 INFORMATION BOX]. 2. Select [2 SET NAV DATA]. 3. -
Page 104: Interswitch
2. RADAR, CHART RADAR OPERATION 2.29 Interswitch The interswitch uses a network to transfer multiple radar signals to the monitor units connected in the network. A master/slave relation can be set for a single radar signal and that signal can be shown on multiple displays. Up to four antennas and four dis- play units can be connected. -
Page 105: How To Preset Antenna And Display Combinations
2. RADAR, CHART RADAR OPERATION 2.29.2 How to preset antenna and display combinations You can preset the antenna and display combinations for each antenna and display in the radar system. As an example, the procedure below shows how to select the no. 1 antenna unit for the no. -
Page 106: How To Select An Antenna
2. RADAR, CHART RADAR OPERATION • When connecting with FAR-2xx7 series radar When switching the antenna from FAR-3xx0 to FAR-2xx7, the image for FAR-2xx7 is displayed on the screen and each function is operative. However, when switching the antenna from FAR-2xx7 to FAR-3xx0, the following functions are not operative. •... -
Page 107: Dual Radar (B-Type Only)
2. RADAR, CHART RADAR OPERATION 2.30 Dual Radar (B-type only) When installing two FAR-3xx0 series radars, the image from both radars (main radar and external radar) may be shown together on one radar display. This allows you to take advantage of the best characteristics each type of radar has to offer. The dual radar function is available only for the B type. -
Page 108: How To Enable Or Disable The Dual Radar Display
2. RADAR, CHART RADAR OPERATION 2.30.1 How to enable or disable the dual radar display Turn on the power of main radar and external radar to set them in standby. The dual radar function is not available when one of two radars is in TX (transmit) state or turned off. - Page 109 2. RADAR, CHART RADAR OPERATION Restrictions The followings are the restrictions of the dual radar function. • A REF (reference) mark can be entered on the display of the main radar but not the external radar. • TT targets can be acquired manually. [TT SELECT] is set to manual acquisition. •...
-
Page 110: Performance Monitor
2. RADAR, CHART RADAR OPERATION 2.31 Performance Monitor The performance monitor, installed in the antenna unit, produces a visual indication on the radar display screen when the radar transmitter power and the radar receiver sensitivity and tuning are within the prescribed limits. A graph is also provided and it shows degradation of TX/RX/Power over time. - Page 111 2. RADAR, CHART RADAR OPERATION The radar is automatically set as follows when the performance monitor is activated. Setting at activation Adjustable while PM Setting at deactivation Item of PM is active of PM CONDITION Setting stored Setting before activation CUSTOMIZE Grayed out, setting Return to active display...
-
Page 112: Magnetron Reset (For A- And B-Types)
2. RADAR, CHART RADAR OPERATION 3. Close the menu. Note: The lengths and location of the arcs may change with the direction in which the antenna unit is installed. Judge the strength of the echo that appears within 60° from arc location to confirm if the radar is working properly or not. -
Page 113: Ccrp (Common Consistent Reference Point)
2. RADAR, CHART RADAR OPERATION 1) Set the radar settings as follows: • Range: 24 NM • A/C RAIN: OFF (turn off manually) • Pulse Length: Long • Echo Averaging (EAV): OFF • A/C SEA: OFF (turn off manually) • Video Contrast: 2-B 2) Adjust the gain so that a slight amount of white noise appears on the screen. - Page 114 2. RADAR, CHART RADAR OPERATION Range and bearing are measured and graphics are drawn according to reference point as shown in the table below. Reference point Category Item CCRP Antenna position Range and bear- Range and bearing Range and bearing ing measurement measured from measured from an-...
-
Page 115: Drop Mark
2. RADAR, CHART RADAR OPERATION 2.34 Drop Mark The drop mark is used to find the angle and distance from a point to your ship. This can be useful for marking a point to avoid while navigating to a destination. The drop marks can be shown or hidden on the screen. -
Page 116: How To Erase A Drop Mark
2. RADAR, CHART RADAR OPERATION 2.34.4 How to erase a drop mark Erase drop mark from menu 1. Open the menu then select the [5 MAP•MARK] and [1 MARK SETTING] menus. 2. Select [7 DROP MARK] (B type) or [6 DROP MARK] (IMO and A types). 3. -
Page 117: Sart
2. RADAR, CHART RADAR OPERATION 2.36 SART 2.36.1 What is an SART? A Search and Rescue Transponder (SART) may be triggered by any X-band (3 cm) radar within a range of approximately 8 NM. Each radar pulse received causes it to transmit a response which is swept repetitively across the complete radar frequency band. -
Page 118: Alert Box, Alert List
2. RADAR, CHART RADAR OPERATION Adjustable during Setting at activation Setting at deactivation Item activation of SART of SART feature of SART feature feature Setting before activation LOW LEVEL Setting stored Setting at deactivation ECHO NOISE Setting before activation REJECT OFF center Setting at deactivation Presentation Mode... -
Page 119: Alert List
2. RADAR, CHART RADAR OPERATION 2.37.2 Alert list The [Alert List] displays the status of the latest 900 system alerts, in order of genera- tion, latest to the earliest. To display the list, click the Alert list/log icon in the [Alert] box. -
Page 120: Echo Area
2. RADAR, CHART RADAR OPERATION 2. Select [3 PRIMARY ALERT]. 3. Click the box to the left of an alarm name to show a circle to give that alarm the same priority as the alert category "Alarm." 4. Close the menu. Note: The priority is immediately changed for an inactive alert. -
Page 121: Icing Prevention
2. RADAR, CHART RADAR OPERATION 2.40 Icing Prevention You can rotate the antenna (24 rpm) without transmission to keep the antenna from freezing. 1. Open the menu then select the [8 INITIAL SETTING] menu. Select [9 ICING PRE- VENTION] (IMO type) or [0 ICING PREVENTION] (A and B types). 2. -
Page 122: Chart Radar Functions
2. RADAR, CHART RADAR OPERATION 2.41 Chart Radar Functions 2.41.1 How to switch between radar and chart radar modes Click the [CHART ON/OFF] button on the InstantAccess bar to show or hide the chart. [Chart ON/OFF] button Indication on button and corresponding mode [Chart ON]: Chart radar mode active. - Page 123 2. RADAR, CHART RADAR OPERATION Item Function [Chart Legend] Show the chart legend for the current chart. See chapters 9 and 10 for a description of the chart legends. [CHART DISPLAY] menu 2-61...
-
Page 124: How To Create And Recall Custom Sets Of Chart Display Objects
2. RADAR, CHART RADAR OPERATION [IMPORTANT TEXT] [STANDARD ITEMS] [OTHER ITEMS] [OTHER TEXT] [SEL DISPLAY OBJECT] menu 2.41.3 How to create and recall custom sets of chart display objects You can create one custom set of chart display objects and recall them when required. For example, you can create a custom set of chart display objects to display when you navigate a certain coastline. -
Page 125: Chart Database Information
2. RADAR, CHART RADAR OPERATION 2.41.4 Chart database information You can select the quantity of objects and text to display on the chart radar screen, with the [Chart database] button on the Status bar. There are four different pre-defined settings available and one user-definable ([PERSONAL]). Indication of selected set- ting appears on the label of the [Chart database] button. -
Page 126: Chart Alert Function
2. RADAR, CHART RADAR OPERATION 2.41.7 Chart alert function The chart alert function operates in chart mode only. There are two types of chart alerts: your ship's predicted course, and route alert. See chapter 11 for details. For the ship's predicted course alert, the operator sets a safety contour. (See paragraph 8.2.1 for how to set a safety contour suitable for the ship.) The operator also sets the parameters for own ship predicted movement. -
Page 127: Radar Observation
2. RADAR, CHART RADAR OPERATION 2.42 Radar Observation 2.42.1 General Minimum range The minimum range is defined by the shortest distance at which, using a scale of 1.5 or 0.75 NM, a target having an echoing area of 10 m is still shown separate from the point representing the antenna position. -
Page 128: False Echoes
Practically, a 0.08 microsecond pulse offers the discrimination better than 40 m as do so with all FURUNO radars. Test targets for determining the range and bearing resolution are radar reflectors having an echoing area of 10 m band) or 1 m (S-band). - Page 129 2. RADAR, CHART RADAR OPERATION Sidelobe echoes Every time the radar pulse is transmitted, some radiation escapes on each side of the beam, called "sidelobes." If a target exists where it can be detected by the side lobes as well as the main lobe, the side echoes may be represented on both sides of the true echo at the same range.
-
Page 130: Racon
2. RADAR, CHART RADAR OPERATION Shadow sectors Funnels, stacks, masts, or derricks in the path of the antenna block the radar beam. If the angle subtended at the antenna is more than a few degrees, a non-detecting sec- tor may be produced. Within this sector targets can not be detected. Radar antenna Radar... -
Page 131: Solid State Radar
2. RADAR, CHART RADAR OPERATION 2.42.5 Solid state radar A solid state radar transmits and receives using pulse compression beyond synthesis distance (approx. 0.5 NM to 2 NM (depending on the pulse length)), and using non- compression within synthesis distance. The radar echoes of a solid state radar are synthesized echoes using these two methods. - Page 132 2. RADAR, CHART RADAR OPERATION This page is intentionally left blank. 2-70...
-
Page 133: Target Tracking (Tt)
TARGET TRACKING (TT) About TT The TT tracks and plots the movement of up to 200 radar targets and fully complies with IMO standards for TT. The TT automatically tracks an automatically or manually acquired radar target and calculates its course and speed, indicating them with a vector. Since the data gener- ated by the TT depends on the radar targets selected, the radar must be optimally tuned for use with the TT, to ensure required targets will not be lost or unnecessary targets like sea returns and noise will not be acquired and tracked. -
Page 134: How To Input Your Ship's Speed
3. TARGET TRACKING (TT) How to Input Your Ship's Speed The TT requires own ship's speed and heading data. The speed can be STW, SOG, or echo-referenced speed (based on 3 max. stationary objects) taken from this radar. Manual input is also possible. For automatic or manual speed input, see section 1.14. -
Page 135: Automatic Acquisition
3. TARGET TRACKING (TT) • When all tracked targets are deleted, the reference target mark is also deleted and the target-based speed becomes invalid. • Loss of reference target will affect the calculation of true speed and true course of targets. -
Page 136: How To Set An Automatic Acquisition Zone
3. TARGET TRACKING (TT) 3.4.2 How to set an automatic acquisition zone You can set an automatic acquisition zone to automatically track any targets entering the zone. The acquisition zone can be fan-shaped or polygonal. The maximum track- ing range is set during the installation. Fan-shaped zone of AZ1: The range is fixed at 3 - 6 NM (width 0.5 - 1.0 NM). -
Page 137: Manual Acquisition
3. TARGET TRACKING (TT) How to sleep, deactivate an acquisition zone Use the trackball to select the appropriate AZ box. Sleep or deactivate the acquisition zone as appropriate: Sleep acquisition zone: Push the left button momentarily to remove the acquisition zone from the screen. -
Page 138: How To Manually Acquire A Target
3. TARGET TRACKING (TT) 3.5.2 How to manually acquire a target Acquire a target from the Control Unit Use the trackball to put the cursor on the target you want to acquire. Push the ACQ/ ACT key. Acquire a target by the trackball module 1. -
Page 139: Tts Symbols And Tts Symbol Attributes
3. TARGET TRACKING (TT) 2. Select [Target Cancel] and [Any] or [TT Only] as applicable. 3. Click the TT or reference target to cancel tracking. 3.6.2 How to cancel tracking on all TTs Cancel tracking on all target from the menu 1. -
Page 140: Tt Symbol Brilliance
3. TARGET TRACKING (TT) 3.7.2 TT symbol brilliance 1. Right-click the [BRILL] button on the InstantAccess bar then select [Brill Menu]. 2. Go to page 2, select [TT SYMBOL] then spin the scrollwheel to adjust the bril- liance. 3.7.3 Color for TT symbol You can select the color for the TT symbol as follows: 1. -
Page 141: How To Display Tt Data
3. TARGET TRACKING (TT) How to Display TT Data The TT mode provides the full functionality of TT as required by the IMO MSC.192(79) and IEC 62288, including display of range, bearing, course, speed, CPA and TCPA of all tracked targets. The target bearing is show in relative bearing in the head-up mode and true bearing in the course-up, north-up and true motion modes, with the suffix "R"... -
Page 142: Tt Pop-Up Information
No. 21 BRG: 125.5°T RNG 3.434NM CPA: 2.923NM TCPA: 12:00 2 AIS Target INFO: A AIS transponder class* FURUNO (A, B, C) BRG: 120.2°T RNG: 5.211NM CPA: 3.345NM TCPA: 14:30 *Click “AIS Target” on the list to show or hide... -
Page 143: Vector Modes
3. TARGET TRACKING (TT) Vector Modes Target vectors can be displayed relative to own ship's heading (Relative) or North (True). Note: IMO recommends the use of the true vector mode in sea stabilization or relative vector mode for collision avoidance. 3.9.1 Description of vectors Stabilization modes... - Page 144 3. TARGET TRACKING (TT) True vector In the true motion mode, all fixed targets such as land, navigational marks and ships at anchor remain stationary on the radar screen with vector length zero. But in the presence of wind and/or current, the vectors appear on fixed targets representing the reciprocal of set and drift affecting own ship unless set and drift values are properly entered.
-
Page 145: Vector Motion And Length
3. TARGET TRACKING (TT) 3.9.2 Vector motion and length Vectors may be displayed in true or relative motion. Vector time (or the length of vec- tors) can be set between 30 seconds and 60 minutes. The vector tip shows an estimated position of the target after the selected vector time elapses. -
Page 146: How To Enable/Disable The Past Position Display, Select Past Position Reference
3. TARGET TRACKING (TT) 3.10.1 How to enable/disable the past position display, select past position reference Click the indications circled in the figure below to set the plot interval (or disable the display) and the past position reference (true or relative). Plot interval, past position display ON/OFF... - Page 147 3. TARGET TRACKING (TT) 3. Use the right and left arrow buttons to select the [SPD] page. Set speed and course of drift 4. Set [Stabilization Mode] to [Water]. 5. Click the [Set Drift] box to show a checkmark in the box. 6.
-
Page 148: Tt Cpa/Tcpa Alarm
3. TARGET TRACKING (TT) 3.12 TT CPA/TCPA Alarm The TT continuously monitors the predicted range at the Closest Point of Approach (CPA) and predicted time to CPA (TCPA) of each TT. When the predicted CPA of any TT becomes smaller than the preset CPA range and its predicted TCPA less than the preset TCPA limit, the audio alarm sounds and the Alert 526 "TT CPA/TCPA"... -
Page 149: Tt Lost Target Alert
3. TARGET TRACKING (TT) The alert in the [Alert] box and the flashing of the plotting symbol and vector continue until the dangerous situation is gone or you intentionally terminate tracking of the tar- get. 3.13 TT Lost Target Alert Tracked targets not detected in nine consecutive scans become "lost targets". -
Page 150: Trial Maneuver
3. TARGET TRACKING (TT) 3.14 Trial Maneuver The trial maneuver feature simulates the effect of own ship's movement against all tracked targets, without interrupting the updating of target information. It is available for use with the TT and AIS functions. For more accurate results, use relative motion and sea stabilization (water tracking). -
Page 151: How To Do A Trial Maneuver
3. TARGET TRACKING (TT) Position of target B at end of trial maneuver Course and speed changes completed; position where course and speed are changed Position of target A at end of trial maneuver Delay time Current position 3.14.2 How to do a trial maneuver To do a trial maneuver: 1. -
Page 152: Tt Simulation Mode
3. TARGET TRACKING (TT) 9. Click the Trial ON/OFF indication to show [ON]. 10. Click the Trial course indication. Spin the scrollwheel to set the trial course. 11. Click the Trial speed indication. spin the scrollwheel or use the Control Unit to set the trial speed. -
Page 153: Tt Alerts
3. TARGET TRACKING (TT) Three simulated targets move as the following table. The simulated target is au- tomatically generated with the relative movement in the following table based on own ship's movement at the start of simulation mode. Note: If own ship moves after the start of simulation mode, the movement of the simulated target is not matched with the values in the following table. -
Page 154: Criteria For Selecting Targets For Tracking
3.17 Criteria for Selecting Targets for Tracking The FURUNO TT video processor detects targets in midst of noise and discriminates radar echoes on the basis of their size. Target whose echo measurements are greater than those of the largest ship in range or tangential extent are usually land and are displayed only as normal radar video. - Page 155 CPA and TCPA of the tracked targets change. Qualitative description of tracking error The FURUNO TT's accuracy complies with or exceeds IMO standards. Own ship maneuvers For slow turns there is no effect. For very high turning rates (greater than 150°/minute, depending on gyro), then all tracked targets revert to full accuracy.
-
Page 156: Factors Affecting Target Tracking
3. TARGET TRACKING (TT) 3.18 Factors Affecting Target Tracking Sea returns If the radar anti-clutter control is adjusted properly, there is no serious effect because distant wave clutter, not eliminated by this control, is filtered out by more than one bang correlation and scan-to-scan matching of data. - Page 157 3. TARGET TRACKING (TT) Indirect echoes A target at close range is usually picked up directly, but it can also be received as re- flection from a large, flat surface. This will result in the radar presenting two or more echoes on the display, each at a different range.
- Page 158 3. TARGET TRACKING (TT) This page is intentionally left blank. 3-26...
-
Page 159: Ais Operation
AIS OPERATION An AIS transponder can be connected to this radar to overlay AIS targets on the radar display. The radar can store up to 2,000 AIS targets in its storage buffer. When this buffer becomes full of AIS targets, the Alert 533 "AIS Target Capacity 100%" is gen- erated to alert you to full storage buffer. -
Page 160: How To Deactivate The Ais Function
4. AIS OPERATION There can be several hundreds or several thousands of AIS targets, and of those only a few will be significant for your ship. To remove unnecessary AIS targets from the ra- dar display, the feature "active and sleeping AIS targets" is available. Initially any new AIS target received by an AIS transponder is not active (="sleeping"). -
Page 161: How To Show, Hide The Ais Display
4. AIS OPERATION How to Show, Hide the AIS Display Targets that are being tracked by an AIS transponder can also be displayed on the display. Click the AIS sta- tus indication to select [DISP OFF], [DISP FILT] or [DISP ALL]. [DISP OFF]: Turn off the AIS display. - Page 162 4. AIS OPERATION Symbol Default color Name Description Green Heading-turn indicator Show target’s direction of turning. Blue Physical (real) AIS ATON AIS aid to navigation Yellow Physical AIS ATON Off AIS aid to navigation with off position Position Blue Virtual AIS ATON Virtual AIS aid to navigation Yellow Virtual AIS ATON Off Po-...
-
Page 163: How To Filter Sleeping Ais Targets
4. AIS OPERATION How to Filter Sleeping AIS Targets If the screen becomes cluttered with AIS targets, you can filter out unnecessary sleep- ing AIS targets, from the [DISP FILTER] menu. 1. Right-click the AIS mode indication then click [AIS Menu] to show that menu. 2. -
Page 164: How To Automatically Activate Targets
4. AIS OPERATION 4.5.2 How to automatically activate targets You can get automatic activation of a sleeping AIS target when its CPA/TCPA are within a preset limit. The CPA/TCPA alarm must be active to use this feature. How to set conditions for automatic activation of AIS targets 1. -
Page 165: How To Sleep All Activated Ais Targets
4. AIS OPERATION 4.6.2 How to sleep all activated AIS targets Sleep all activated targets from the menu 1. Open the menu then select [2 TT•AIS] and [4 AIS]. 2. Select [3 SLEEP ALL TGTS] then [YES]. 3. Close the menu. Sleep all activated targets from the AIS box Long-click the AIS status indication at the bottom-right position to display [FUNC OFF] then click [DISP ALL] to sleep all AIS targets redisplayed. - Page 166 4. AIS OPERATION AIS no. (information display order) FURUNO Vessel name Bearing Heading Range Course over ground Rate of turn Speed over ground TCPA Bow crossing range Bow crossing time Navigation Position status Note 1: AIS is not available in dead reckoning when the radar type is selected to [IMO] on the [INSTALLATION] menu.
-
Page 167: Expanded Ais Data
The expanded AIS data display provides additional information about an AIS target, including call sign, MMSI No., IMO No., etc. To display expanded AIS data, show the basic data for a target, right-click the target data display then select [Expanded AIS Data]. Title bar FURUNO Vessel name WG27CQ Call sign Position... -
Page 168: Ais Cpa/Tcpa Alarm
4. AIS OPERATION AIS CPA/TCPA Alarm This radar calculates CPA and TCPA by using own ship and relative target positions. An AIS dangerous target is one whose CPA and TCPA are within the range of the CPA and TCPA limits set in the TT/AIS box. The AIS symbol of an AIS dangerous target is red and flashing, and is announced with the Alert 536 "AIS CPA/TCPA". -
Page 169: Ais Symbol Color
4. AIS OPERATION 4.10 AIS Symbol Color 1. Right-click the AIS mode indication then click [Symbol Menu] to show that menu. 2. Select [1 SYMBOL COLOR] and desired color. (Yellow is not available with the IMO type.) 3. Close the menu. 4.11 AIS Lost Targets An AIS target is declared a lost target when it fails to produce data... -
Page 170: How To Set The Ais Lost Target Filter
4. AIS OPERATION 4.11.2 How to set the AIS lost target filter If you are in an area where AIS targets often become lost, the lost target alert may ac- tivate frequently. In this case, you may want to specify which targets to classify as lost targets, to prevent frequent triggering of the lost target alert. -
Page 171: Past Position Points
4. AIS OPERATION 4.12.2 Past position points You can show 5 or 10 past position points per AIS target. Right-click the past position indication then click [Past POSN Menu] to show that menu. Set [6 AIS PAST POSN POINTS] to [5] or [10]. 4.13 How to Display True or Relative Speed Vectors AIS targets vector can be displayed relative to your ship's heading (relative) or with... -
Page 172: How To Set The Conditions For Association
4. AIS OPERATION 4.14.2 How to set the conditions for association 1. Open the menu then select [TT•AIS] and [6 ASSOCIA- TION]. 2. Enter the association conditions, referring to the follow- ing: [ASSOCIATION TGT]: Disable Association with [OFF], or select [AIS] or [TT]. [AIS] selects the AIS symbol for asso- ciation target;... -
Page 173: Ais Messages
4. AIS OPERATION 2. Select [1 NAV STATUS] then use the scrollwheel to set the applicable two-digit nav status code, referring to the table below. Nav status Status Underway using engine Under way Sailing At anchor Reserved for high speed craft Not under command Reserved for wing in ground Restricted Maneuverability... -
Page 174: How To Transmit A Saved Ais Message
4. AIS OPERATION 5. At [4 CHANNEL], select the channel over which to broad- cast your message. The choices are [A], [B], [A or B] or [A and B]. 6. Click [NEXT] to go to the next page. 7. Select [3 EDIT]. A text input box appears together with the software keyboard. - Page 175 AIS Received Messages list Received AIS messages are stored in the AIS received message list. A maximum of 200 messages are saved over 50 pages for FURUNO 19-inch monitor unit, 34 pages for FURUNO 23-inch monitor unit. 1. Right-click the AIS mode indication then click [AIS Menu] to show that menu.
-
Page 176: Other Ais Features
4. AIS OPERATION 4.17 Other AIS Features The [TT•AIS] menu additionally provides the features described below. AIS SCALED SYMBOL OFF / ON AIS BASE STATION OFF / ON AIS PHYSICAL ATON OFF / ON AIS VIRTUAL ATON OFF / ON Page 2 Page 1 [ATON SYMBOL COLOR]: Select the ATON symbol color. -
Page 177: Radar Map And Track
RADAR MAP AND TRACK What is a Radar Map? A radar map consists of a layer of marks and lines overlaid on the radar display. A map is intended for indicating safety-related areas and objects. Ten radar maps can be made and each map can have a total of 4,000 lines and marks. -
Page 178: How To Enter Radar Map Marks And Lines
5. RADAR MAP AND TRACK How to Enter Radar Map Marks and Lines Marks and lines can be entered in the radar mode. (Marks cannot be entered in the chart radar mode.) These marks and lines can be displayed in red, green, blue, cyan, magenta, yellow or white. -
Page 179: How To Find Number Of Map Points Used
5. RADAR MAP AND TRACK 4) At the context-sensitive menu, click [MAP File] then click the map file number where to save the mark. 4. For entry with the cursor, use the trackball to put the cursor on the location de- sired. -
Page 180: How To Select The Radar Map To Display
5. RADAR MAP AND TRACK How to Select the Radar Map to Display 1. Right-click the [Mark] box to show the context-sensitive menu. 2. Click [MAP File] and then click the map no. you want to display. How to Attach a Comment to a Radar Map, Find Comment for a Map 5.7.1 How to attach a comment to a radar map... -
Page 181: How To Erase Radar Map Marks And Lines
5. RADAR MAP AND TRACK How to Erase Radar Map Marks and Lines A total of 4,000 marks and lines is allotted per map. When this amount is exceeded in a map, no more map marks or lines may be entered into the map unless you erase some unnecessary marks or lines. -
Page 182: How To Erase All Radar Map Marks And Lines In A Map File
5. RADAR MAP AND TRACK 3. Specify the area as follows: 1) Put the cursor on the start point and push the left button. 2) Drag the cursor diagonally to the end point and push the left button. Start point Marks within the area End point are colored cyan... -
Page 183: How To Copy Radar Map Marks And Lines
5. RADAR MAP AND TRACK How to Copy Radar Map Marks and Lines 5.9.1 How to copy individual radar map mark and line to another map file You can copy individual mark and line from the currently displayed radar map to the radar map file of your choice. -
Page 184: How To Copy All Radar Map Marks And Lines In A Map File To Another Map File
5. RADAR MAP AND TRACK 5.9.3 How to copy all radar map marks and lines in a map file to an- other map file You can copy all radar map marks and lines in the currently displayed radar map to the radar map file of your choice. -
Page 185: How To Export Radar Map
5. RADAR MAP AND TRACK 5.10 How to Export Radar Map You can export a radar map to a USB flash memory. 1. Set the USB flash memory in the USB port on the Control Unit. 2. Open the menu then select the [5 MAP•MARK] and [1 MARK SETTING] menus. 3. -
Page 186: How To Import Radar Map
5. RADAR MAP AND TRACK 5.11 How to Import Radar Map You can import a radar map created on another equipment (FAR-3xx0 or FAR-2xx7). Copy the radar maps to a USB flash memory. 1. Set the USB flash memory that contains the radar map(s) to import in the USB port on the Control Unit. - Page 187 5. RADAR MAP AND TRACK The list of the radar map marks and lines The radar map marks and lines created on another FAR-2xx7 are converted to ones on the FAR-3xx0 series as below. Marks FAR-2xx7 FAR-3xx0 IMO or A type B type Symbol Color...
- Page 188 5. RADAR MAP AND TRACK Lines FAR-2xx7 FAR-3xx0 IMO or A type B type Symbol Color Name Symbol Color Name Symbol Color Name Yellow- Mark Buoy Mark orange Yellow- Mark Buoy Mark orange Nav Line Purple Buoy Nav Line Coast Line White Buoy Coast Line...
-
Page 189: How To Show, Hide Radar Map Features
5. RADAR MAP AND TRACK 5.12 How to Show, Hide Radar Map Features You can show or hide radar map objects as follows: 1. Right-click the [Mark] box then select [Map•Mark Menu] and [2 RADAR MAP]. 2. Turn objects on or off as appropriate. 3. -
Page 190: How To Erase Track
5. RADAR MAP AND TRACK 8. For the B-type radar, you can select the color for the track with [5 OWN TRACK COLOR]. 9. Close the menu. 5.13.2 How to erase track When the display becomes filled with track, for example, your ship traces the same route several times, you may want to delete some or all of your track from the display. -
Page 191: User Chart Display
5. RADAR MAP AND TRACK 5.15 User Chart Display The active user chart can be shown in the chart radar mode. See chapter 13 for a de- scription of the user chart. 1. Right-click the [Mark] box then select [Map•Mark Menu] and [5 USER CHART]. - Page 192 5. RADAR MAP AND TRACK This page is intentionally left blank. 5-16...
-
Page 193: Chart Overview
CHART OVERVIEW Chart Screen Overview The chart screen is divided into several areas, as illustrated below. Status bar Cursor position box Sensor information Chart scale/presentation mode box Own ship functions Route Electronic chart area Instant information Access Overlay/ Tools box Alert EBL1 box, EBL2 box Permanent... -
Page 194: Electronic Chart Area
To emphasize this point these charts are called "Non-ENC" charts in this manual. Note that some eToken dongles from the FEA-2xx7 can be used. These are labeled "JeT FURUNO XXXXX". This chart radar accepts the following C-MAP chart types: CM-ENC, Professional, Profes and Jeppesen Primary ECDIS Service. -
Page 195: Status Bar
6. CHART OVERVIEW 6.1.2 Status bar The Status bar mainly provides for selection of operating mode, chart type and IMO chart display setting. 13 14 NAVI Button name Description Operating mode Selects a mode: RADAR or CHART for RADAR. NAVI Selects the Voyage navigation mode. - Page 196 6. CHART OVERVIEW How to operate the buttons on the Status bar The Status bar has two types of controls: toggle button and drop-down list button. You operate the buttons with the trackball module. Button type Operating procedure Mode button A mode button selects the operating mode (see section 6.3).
-
Page 197: Instantaccess Bar
6. CHART OVERVIEW 6.1.3 InstantAccess bar The InstantAccess bar contains all the operating functions related to the chart operat- ing mode (Voyage navigation, Chart maintenance and Voyage planning) selected. The bar is divided into two sections, upper and lower. The buttons in the upper section change according to the mode selected. - Page 198 6. CHART OVERVIEW Button name Description Voyage navigation mode bar ← Minimize the InstantAccess bar. To restore the maximized bar, click anywhere on the bar. Click arrow Instant Track Click anywhere on the bar Route Route functions: select route, deselect route, move route to plan, monitor route. Processes AIS Safety and Navtex messages.
- Page 199 (Voyage, Details, Chart Usage), Target log (Danger Target). Voyage navigation and Voyage planning modes. Selects a color palette, day, dusk or night. Palette Adjusts the brilliance of a FURUNO monitor unit. BRILL Inscribes the MOB (ManOverBoard) mark. Takes a screenshot.
-
Page 200: Sensor Information Box
6. CHART OVERVIEW • Drop-down list button or slider bar: Rotate the knob to select an item or ad- just the slider bar. Push the knob to confirm your selection or setting. Note 1: You can use the ESC key to go back one step in the current operating sequence. -
Page 201: Route Information Box
6. CHART OVERVIEW • ENC info: ENC chart info appears here. No indication: ENC chart is currently displayed. "Non-ENC data": Non-official ENC material, in yellow characters. See section 7.18. • TM/CU status: "TM/CU Reset": True motion reset is active. (Chart is stationary and own ship moves on the chart.) "TM Reset off": When dragging the chart;... -
Page 202: Overlay/Nav Tools Box
6. CHART OVERVIEW 6.1.7 Overlay/NAV Tools box The [Overlay/NAV Tools] box sets up Minimize button the following objects and consists of Page name the following pages. • TT/AIS Page • Parallel index lines selection • Range rings buttons • Predictor (predicts ship’s future movements) •... -
Page 203: Context-Sensitive Menus
6. CHART OVERVIEW 6.1.11 Context-sensitive menus Context-sensitive menus are available at the locations shown below. Right-click the applicable area then select the appropriate item from the menu. The availability of the context-sensitive menu depends on the mode in use, as shown in the table below. Cursor info display Sensor selection... -
Page 204: How To Enter Alphanumeric Data
6. CHART OVERVIEW 6.1.12 How to enter alphanumeric data On some screens it is necessary to enter alphanumeric data. The data can be input two ways: software keyboard or trackball. Alphanumeric data entry from the software keyboard A software keyboard is also available for entry of alphanumeric data. Do as follows to use the software keyboard. -
Page 205: How To Select The Operating Mode
6. CHART OVERVIEW How to enter latitude and longitude data with the trackball module The trackball module can also be used to enter latitude and longitude data. 1. Put the cursor in the input box. A selection cursor (light- Selection cursor blue) appears. -
Page 206: How To Select The Chart Scale
6. CHART OVERVIEW How to Select the Chart Scale When you open a chart it is displayed with the default scale, called the compilation scale. To change the chart scale, do one of the procedures shown below. The scale range is 1:1,000 to 1:70,000,000. •... -
Page 207: How To Select The Presentation Mode
6. CHART OVERVIEW How to Select the Presentation Mode The presentation mode depends on the chart operating mode, as shown in the table below. Voyage navigation mode Voyage planning mode North up TM North up RM Course up TM Course up RM Route up TM Route up RM Head up RM... -
Page 208: Cursor Position Box
6. CHART OVERVIEW Cursor Position Box The Cursor position box shows • Cursor position in latitude and longitude • Time to go to the cursor position • The bearing (True or Relative) and range to the cursor position, or x-y coordinates of cursor position. -
Page 209: True Motion Reset
6. CHART OVERVIEW True Motion Reset In the true motion mode, the chart is stationary and own ship moves on the screen. With TM reset active, own ship moves until it reaches the true motion reset border- line(s), then the chart is redrawn and own ship jumps back to an opposite position on screen based on its course. -
Page 210: How To Control Route And User Charts In Voyage Navigation And Voyage Planning Modes
6. CHART OVERVIEW How to Control Route and User Charts in Voyage Navigation and Voyage Planning Modes Click for Voyage navigation mode Click for Voyage planning mode Functions in Voyage navigation mode Functions in Voyage planning mode Click the appropriate chart mode button [NAVI] or [PLAN] at the top of the display to go to respective mode. -
Page 211: How To Use The Vrm And Ebl
6. CHART OVERVIEW 6.10 How to Use the VRM and EBL The VRM measures the range to an object and the EBL measures the bearing to an object. There are two each of VRMs and EBLs. The lengths of the dashes on the EBL2 and VRM2 are longer than those of the EBL1 and VRM1 to distinguish them. -
Page 212: Ebl, Vrm Functions Available With The Context-Sensitive Menu
6. CHART OVERVIEW 6.10.4 EBL, VRM functions available with the context-sensitive menu The EBLs and VRMs have additional functions that are accessed from the context- sensitive menu. Right-click any VRM or EBL box to show the context-sensitive menu. Function Description [Centered] Centers the origin of the EBL and VRM on the current position. -
Page 213: Split Screen
6. CHART OVERVIEW 6.11 Split Screen This function is currently unavailable. 6.12 Datum 6.12.1 General Datum is a mathematical model of the earth based on which a sea chart is produced. If the datum of a position sensor and that of a sea chart are different, a transformation has to be made somewhere in the system. -
Page 214: How To Select Sensor Settings
The speed can be entered from a log (STW) or GPS (SOG), or manually on the menu. Note that FURUNO GPS Navigator GP-150 provides both COG and SOG. Speed data is checked for integrity (see section 16.7 for details), and the data is judged as [Passed], [Doubtful], [Failed], [Excluded] or [Not Available]. - Page 215 6. CHART OVERVIEW [Passed] (green): Data is available for comparison and data is normal. [Doubtful] (yellow): Data is not available for comparison, but data is normal. [Failed] (orange): Data is quite away from predicted value based on a comparison. [Excluded] (orange): Data is greatly changed compared with predicted value. [Not Available] (orange): Sentence status or mode indicator is abnormal.
-
Page 216: How To Enter Heading
6. CHART OVERVIEW 5. For automatic input, follow the procedure below. For manual input, go to step 6. 1) Check [Sensors]. 2) Set the priority for the speed sensors in case of Local sensor. Click the triangle on the Priority1 line to select the sensor to be the Priority1 sensor. Do the same for the Priority2. - Page 217 6. CHART OVERVIEW ship’s speed becomes greater than 10 knots and COG stabilizes, the data integrity au- tomatically changes to [Passed]. 1. Right-click anywhere in the Sensor information box to show the context-sensitive menu. 2. Click [Open MENU]. 3. Click [System Sensor Settings] or [Local Sensor Settings].
-
Page 218: Set Up Before Departure
6. CHART OVERVIEW 6.16 Set up Before Departure 6.16.1 Updates before departure Update S57 chart material Update your S57 chart material before embarking on a new voyage. See section 7.19. Display date and approve until dates for S57 charts and manual updates Note: It is very important that you set the Display and Approved until dates for charts as the current date. -
Page 219: Create Or Update A Route
6. CHART OVERVIEW 6.16.2 Create or update a route Create a new route or modify an existing one. See chapter 12. Check your route against chart alerts Before you sail your route, you should always check your route against chart alerts. This is important because your S57 charts and manual updates may contain chart viewing dates information. -
Page 220: How To Check And Prepare Route To Monitor
6. CHART OVERVIEW • Name of the Notes to be used during route monitoring together with this planned route, on the [User Chart] dialog box (click the [Planning] button then click the [User Chart] button). Check in Notes column indicates Notes is used with route monitoring and planned route. Recalculate timetable and ETA values Timetable and ETA values can be recalculated from the [Optimize] page in the [Route Plan] dialog box. - Page 221 6. CHART OVERVIEW Select confirm conditions of the route plan Check the setting on the [Chart Alert] dialog box; click the [DISP], [SET] and [Chart Alert] buttons to show that dialog box. Planned user chart, Notes To check what planned user chart is selected, open the [Route Information] dialog box and click the [User Chart] tab.
-
Page 222: Check Configuration Of Navigation Sensors
6. CHART OVERVIEW 6.16.4 Check configuration of navigation sensors You can check the configuration of your navigation sensors. Check speed settings ([SPD] page) Open the menu and click the [SPD] tab in the [System Sensor Settings] page or [Local Sensor Settings] page of the [Sensor] menu. The user can select navigation sensors for use in navigation and view their current values. -
Page 223: How To Reset Odometer And Trip Meter
6. CHART OVERVIEW Check position sensors ([POSN] page) Open the menu and click the [POSN] tab in the [System Sensor Settings] page or [Lo- cal Sensor Settings] page of the [Sensor] menu. The [Prim] and [Second] labels indi- cate the type of the position sensor. (In the figure below the [Prim] label shows GPS1.) [Prim] and [Second] indicate sensor status and priority. - Page 224 6. CHART OVERVIEW This page is intentionally left blank. 6-32...
-
Page 225: How To Manage Charts
HOW TO MANAGE CHARTS This chapter mainly shows you how to install the public keys, licenses and charts, manually update chart objects, and synchronize charts among chart radars. All chart- related operations begin from the Chart maintenance mode, which you access by clicking the [CHARTS] button on the Status bar. -
Page 226: How To Install Enc Licenses, Charts
7. HOW TO MANAGE CHARTS 5. Click the [Display Content] button on the [Select Public Key] dialog box to show the display contents. Public Key content //BIG p FCA6 82SE 8E12 CABA 26EF CCF7 110E 526D B078 B05E DECB CD1E B4A2 08F3 AE16 17AE 01F3 5B91 A47E 6DF6 3413 C5E1 2ED0 8998 CD13 2ACD 50D9 9151 BDC4 3EE7 3579 2E17 //BIG q... -
Page 227: How To Install Enc Charts
7. HOW TO MANAGE CHARTS 5. Find the license (permit.txt) then click the [OK] button to install the license. The [Licenses] dialog box then shows cell name, date of expiration, data server name and subscription type of the license. 6. Click the [Close] button to finish. Manual installation If you do not have the medium which has your ENC license, you can enter the license number manually. - Page 228 7. HOW TO MANAGE CHARTS the system is searching the medium (in the figure below the medium is a DVD) for chart data. The results of the search are displayed, an example of which is shown below. To cancel the installation, click the [Cancel] button. 3.
-
Page 229: How To Delete Enc Licenses
7. HOW TO MANAGE CHARTS 4. When the installation is completed, information about the installation appears in the [Error/Warning/Guidance] window. Click the [Confirm] button to finish. 5. If applicable, set the next sequential medium then repeat steps 2-4 to install the next database. -
Page 230: How To Install C-Map Charts
7. HOW TO MANAGE CHARTS How to Install C-MAP Charts Synchronize chart data before you install C-MAP charts, grouping the chart radar units to synchronize, otherwise the chart data cannot be shared. See the procedure in paragraph 7.20.1 for how to synchronize chart data. If C-MAP charts are not synchro- nized after installation, delete all C-MAP charts, and do the above procedure again. - Page 231 7. HOW TO MANAGE CHARTS 1. Insert the medium that contains the C-MAP database. 2. Get into the Chart maintenance mode then click the [AUTO Load] button on the InstantAccess bar. 3. The [Install chart data] window appears and shows the percentage of completion, with digital and analog indications.
-
Page 232: How To Install C-Map Licenses
7. HOW TO MANAGE CHARTS 7.4.3 How to install C-MAP licenses A C-MAP license can be installed automatically or manually. Automatic installation 1. Set the medium (DVD, USB flash memory, etc.) that contains the C-MAP license. 2. Get into the Chart maintenance mode then click the [License] button on the InstantAccess bar. -
Page 233: How To Generate And Order An Update File
7. HOW TO MANAGE CHARTS 7.4.4 How to generate and order an update file To update the C-MAP chart database, you have to generate an update file, and e-mail the file directly to C-MAP. The update file defines coverage of charts you can display on your chart system. -
Page 234: How To Install C-Map Dl (Dynamic Licensing) Charts
7. HOW TO MANAGE CHARTS How to Install C-MAP DL (Dynamic Licensing) Charts Register the eToken if it has not already been registered. See section 7.4.1. 7.6.1 How to generate and order an update file To update the C-MAP chart database, you have to create an update file and e-mail the file directly to C-MAP. -
Page 235: How To Enable And Set Up The C-Map Dl
7. HOW TO MANAGE CHARTS 7.6.3 How to enable and set up the C-MAP DL 1. Get into the Chart maintenance mode then click the [License] button on the InstantAccess bar. 2. Click the [C-MAP DL] tab to show the [Licenses] dialog box for C-MAP DL. C1210011 01 Jun 2012 Unissued... -
Page 236: How To Export A List Of Specific Licenses
7. HOW TO MANAGE CHARTS How to Export a List of Specific Licenses You can export a list of your ENC or C-MAP (excluding C-MAP DL) licenses to a USB flash memory, in .txt format. 1. Set a USB flash memory in the USB port on the Control Unit. 2. -
Page 237: How To View Permit Expiration Date
7. HOW TO MANAGE CHARTS 7.11 How to View Permit Expiration Date Permits are used to control the right to use chart data in this chart system. A permit is connected to the edition of a chart. Permits are issued in two different types: •... -
Page 238: How To Display Install/Update History
7. HOW TO MANAGE CHARTS 7.12 How to Display Install/Update History You can see a history of chart installations and updates. On the InstantAccess bar, click the [Record] and [Chart Log] buttons followed by the [ENC] or [C-MAP] button. The example below shows the install/update history for ENC charts. You can filter the log with [Period Covered (UTC)]. -
Page 239: Catalog Of Chart Cells
7. HOW TO MANAGE CHARTS 7.13 Catalog of Chart Cells A catalog is used to view graphical coverage of the charts stored in your SSD, avail- able in a named "medium". Available charts are displayed using their limits of charts. Note that sometimes the real coverage of the charts may be considerably less than the declared limits of it. -
Page 240: How To Group Chart Cells
7. HOW TO MANAGE CHARTS 5) [C-MAP Collections] A collection is a pre-defined dataset, the contents of which can be defined by zone, individual chart or any of those combinations. Applicable to C-MAP charts also. 6) [Official] Display official or unofficial charts. 7) [Up-to-date] Display charts which are or are not up to date. - Page 241 7. HOW TO MANAGE CHARTS 3. Click the [New] button. 4. In the [Outside Group] window, click the box to the left of the chart cell you want to add to the group to show a checkmark. (A context-sensitive menu with [Select All] and [Deselect All] functions is available by right-clicking the box to the left of [Name], in either window.) 5.
-
Page 242: How To View Status Of Chart Cells
7. HOW TO MANAGE CHARTS 7.13.2 How to view status of chart cells The [Cell Status] dialog box shows the status of the chart cells stored in the system. To show this dialog box, get into the Chart maintenance mode then click the [Cell Sta- tus] button on the InstantAccess bar. -
Page 243: How To Print Chart List, Cell Status List
7. HOW TO MANAGE CHARTS 7.15 How to Print Chart List, Cell Status List 7.15.1 How to print the chart list 1. In the Chart maintenance mode, click the [Manage Charts] button on the InstantAccess bar to show the [Manage Charts] dialog box. 2. -
Page 244: How To Print The Cell Status List
7. HOW TO MANAGE CHARTS 7.15.2 How to print the cell status list 1. In the Chart maintenance mode, click the [Cell Status] button on the InstantAccess bar to show the [Cell Status] dialog box. 2. Check the charts to print. 3. -
Page 245: How To Show Publishers Notes For Enc Charts
7. HOW TO MANAGE CHARTS 7.17 How to Show Publishers Notes for ENC Charts You should read the text file associated with each catalog, which you can view when installing a chart from a medium. Click the [Note] button in the [Manage Charts] dialog box. -
Page 246: How To Find The Chart Type
7. HOW TO MANAGE CHARTS 7.18 How to Find the Chart Type The electronic chart system can display more than one ENC chart cell at a time. This feature is called multi-cell display. If one ENC chart cell does not cover the whole dis- play, the system opens more ENC chart cells for display, if appropriate cells for the displayed area are available. -
Page 247: How To Insert Update Symbols
7. HOW TO MANAGE CHARTS 7.19.1 How to insert update symbols An update symbol can be added as shown in the procedure below. Note 1: If the system freezes when updating the drawing type [Area], reset the power. Note 2: An update symbol that straddles the international date line cannot be edited. In this case, insert the same symbol on each side of the line. -
Page 248: How To Delete Update Symbols
7. HOW TO MANAGE CHARTS 9. To add textual information to an attribute, select the attribute from the [Attributes] window then add text in the [Edit Attribute’s Value] window. 10. Click the [Commit] button to add all selected objects to the chart. Note: A manual update object is displayed until the display until date entered for it has passed. -
Page 249: How To Synchronize Chart Data
7. HOW TO MANAGE CHARTS 7.20 How to Synchronize Chart Data This section shows you how to synchronize chart data between FMD-3xx0 and FAR- 3xx0 units, so that all units share the same chart data. Synchronization can be done automatically or manually (see paragraph 7.20.2), however all units selected for syn- chronization must be powered to complete the synchronization. -
Page 250: How To Check Synchronization Status
7. HOW TO MANAGE CHARTS unit’s name is moved to the [Grouped with This Unit] window. To deselect a unit from synchronization: Put a checkmark next to the unit’s name in the [Grouped with This Unit] window then click the [>>] button. That unit’s name is moved to the [Not Synchronize with This Unit] window. -
Page 251: Manual Updates And Synchronization
7. HOW TO MANAGE CHARTS Note 1: In normal operation do not disable synchronization. If you accidentally disable synchronization, try to synchronize by clicking the [Enable Sync] button. If that does not work, reset the power of all units selected for synchronization then click the [Urge Sync] button to synchronize. - Page 252 7. HOW TO MANAGE CHARTS This page is intentionally left blank. 7-28...
-
Page 253: How To Control Chart Objects
HOW TO CONTROL CHART OBJECTS This chapter provides the information necessary for controlling chart features. How to Browse Your Charts You can view your charts using different positions and different scales. The basic tools for browsing charts are the RANGE key, chart offcenter, and scroll. RANGE - and RANGE + change the chart scale. - Page 254 8. HOW TO CONTROL CHART OBJECTS MULTI-COLOR presentation Chart zero Shallow contour Safety contour (input value) Safety contour (exisiting in ENC) Deep contour Non-navigable area Navigable area In the multi-color presentation four colors are used for depths. If the value entered as the safety contour does not exist in the electronic chart, the system automatically se- lects the next available deeper depth contour as the safety contour.
-
Page 255: Basic Setting Menu
8. HOW TO CONTROL CHART OBJECTS 8.2.2 Basic Setting menu To display this menu, click [DISP], [SET] and [Basic Setting] on the InstantAccess bar. [Symbols]: Select how to display chart symbols. The options are: [Simplified]: The shape of symbols is of modern design and the sea mark symbols are filled in a color. -
Page 256: Chart Display Menu
8. HOW TO CONTROL CHART OBJECTS 8.2.3 Chart Display menu To access this menu and its pages, click [DISP], [SET] and [Chart DISP] on the Instan- tAccess bar then open the [Standard], [Other] or [AIO] page as appropriate. The [Standard] page contains chart features defined by IMO that comprise a standard display. -
Page 257: Display Base
8. HOW TO CONTROL CHART OBJECTS 8.2.4 Display base A subset of chart features is called the “display base”. As required by IMO, these fea- tures cannot be made invisible. To get the display base, uncheck all items on the [Standard] and [Other] pages in the [Chart Display] menu. - Page 258 8. HOW TO CONTROL CHART OBJECTS [True outlines shown if]: If the length or width of the own ship mark is greater than 3 mm, the own ship mark is shown with the true scale symbol. Select [Length] or [Beam width].
-
Page 259: Tracking Page
8. HOW TO CONTROL CHART OBJECTS 8.3.2 Tracking page [Own Ship Past Tracks] [CCRP]: Check to plot CCRP position. [Primary]: Check to plot own ship's past track with position fed from sensor with high- est priority. [Secondary]: Check to plot own ship's past track with position fed from sensor with second highest priority. -
Page 260: Route Page
8. HOW TO CONTROL CHART OBJECTS 8.3.3 Route page The [Route] page selects the route parts of the monitored and planned routes to show on the chart. [Channel Limit]: The distance from the centerline to one side of the nav lane. -
Page 261: Targets Page
8. HOW TO CONTROL CHART OBJECTS [Tidals]: Check to show symbols and tidals on user charts. [Areas]: Check to show areas on the user charts. [Circles]: Check to show circles on user charts. [Transparent]: Set the degree of transparency for the user chart objects. Color fill for the areas can be selected as transparent from 25%, 50%, 75% and as [No color fill]. -
Page 262: Control Of Predefined Imo Chart Display Settings
8. HOW TO CONTROL CHART OBJECTS Control of Predefined IMO Chart Display Set- tings There are three sets of predefined chart display settings that can be used to display charts with certain chart features. The predefined chart display settings are •... -
Page 263: Vector (S57) Charts
VECTOR (S57) CHARTS Theoretically a chart can be coded for use on a computer as a vector chart. Vector- coded charts are coded using a variety of techniques. One technique is called S57ed3 and it has been chosen by IMO as the only alternative for SOLAS compliant electronic charts. -
Page 264: Definitions Of Terms
9. VECTOR (S57) CHARTS 9.1.1 Definitions of terms Cell A cell is a geographical area containing ENC data and it is the smallest di- vision of ENC data. Each cell has a separate unique name. Hydrographic Offices divide their responsibility area by the cells that they publish. S57 chart A database, standardized as to content, structure and format, is issued for use with this system without any authority of government-authorized Hydro-... -
Page 265: Permanent Warnings For S57 Charts
9. VECTOR (S57) CHARTS [Compilation Scale]: The scale of the original paper chart is shown here. [Projection]: Projection of current chart. [Horizontal Datum]: Horizontal datum used with current chart. [Sounding Datum]: Datum used to create sounding data. [Vertical Datum]: Vertical datum used with current chart. [Units of Depth]: Unit of depth used with current chart. -
Page 266: Chart Viewing Dates And Seasonal Features Of The S57 Chart
9. VECTOR (S57) CHARTS Chart Viewing Dates and Seasonal Features of the S57 Chart 9.2.1 Introduction S57 charts contain date-dependent features. Updating in general, including reissues, new editions and updates, creates date dependency. In addition to the obvious date dependency, some features of the S57 charts create additional date dependency. These features include "Date Start", "Date End", "Seasonal date start"... -
Page 267: How To Set Display Date And Approved Until Dates
9. VECTOR (S57) CHARTS 9.2.3 How to set Display date and Approved until dates Click the [Chart INFO] and [Viewing Dates] button on the InstantAccess bar to show the [Viewing Date] dialog box. Set desired dates then click the [Close] button. 9.2.4 About chart viewing date dependency of S57 standard How the issue date of updates changes the visibility of the changes... -
Page 268: Symbology Used In S57 Charts
9. VECTOR (S57) CHARTS Symbology Used in S57 Charts You can familiarize yourself with the symbology used by browsing IHO Chart 1, which is included in this system. Note that it behaves as any S57 chart and it follows your selections. -
Page 269: How To Find Information About S57 Chart Objects
9. VECTOR (S57) CHARTS How to Find Information About S57 Chart Objects The ability to cursor-pick an object to find additional information about the object is an important function of the system. However, an unprocessed cursor pick, which does not discriminate or interpret and merely dumps on the interface panel all the informa- tion available at that point on the display, will normally result in pages of unsorted and barely intelligible attribute information. -
Page 270: Admiralty Information Overlay (Aio)
9. VECTOR (S57) CHARTS Admiralty Information Overlay (AIO) The Admiralty Information Overlay includes all Admiralty Temporary and Preliminary Notices to Mariners (T&P NMs) and provides additional navigationally significant in- formation from UKHO's ENC validation programme. The AIO is displayed as a single layer on top of the basic ENC and is available free of charge as part of the Admiralty S57 Chart Service and within Admiralty Value Added Resellers' services. -
Page 271: Catalog Of Aio Cells
9. VECTOR (S57) CHARTS 9.5.3 Catalog of AIO cells A catalog of AIO cells is maintained in the [Manage Charts] dialog box. To show this box, get into the Chart maintenance mode then click the [Manage Charts] button on the InstantAccess bar. The AIO cell is GB800001. 9.5.4 How to find AIO chart object information Do the following to find chart object information contained in the AIO. -
Page 272: How To Select The Information To Display
9. VECTOR (S57) CHARTS 2. Click [Preliminary Notice] in the dialog box to show the [Chart object] dialog box. The [Chart object] dialog box shows the following information: • Cell (name) • Drawing type (Preliminary Notice, Temporary Notice) • Category (AIO) •... -
Page 273: 10. C-Map Charts
10. C-MAP CHARTS The descriptions in this chapter apply to the CM-93/3 charts. (This system does not support CM-93/2 charts.) 10.1 C-MAP Cartographic Service Your chart system has the capability of using and displaying the latest C-MAP world- wide vector chart database. These charts are fully compliant with the latest IHO S-57 3.1 specifications. -
Page 274: Troubleshooting
10. C-MAP CHARTS 10.5 Troubleshooting If you are having problems installing your software or charts please check the follow- ing before contacting C-MAP: • Check that the charts are available, with the chart management function. • Check that the license is correctly installed, with the license function. Contact Information: For information or help please call you're nearest C-MAP Office (details can be found on the reverse side of the C-MAP chart CO box) or contact C- MAP Norway. -
Page 275: Chart Display
10. C-MAP CHARTS 10.7 Chart Display 10.7.1 Introduction C-MAP charts are S57 charts displayed together with ENC (S57) and CM93/3 charts. These charts have the priority order shown below. 1. CM- ENC 2. C-MAP 93/3 Prof and C-MAP 93/3 Prof+ If the same navigational purpose charts are available over an area, priority is as shown above. -
Page 276: Permanent Warnings
10. C-MAP CHARTS 10.8 Permanent Warnings Permanent warnings help you keep the C-MAP up-to-date and these are shown at the bottom of the screen. Permanent warnings appear if the system detects a condition that may cause a chart to be not up-to-date. Message Meaning, Remedy CMAP: Database not up to date... -
Page 277: 11. Chart Alerts
11. CHART ALERTS The chart radar can detect areas where the depth is less than the safety contour or detect an area where a specified condition exists. If prediction of own ship movement goes across a safety contour or an area where a specified condition exists, the system does the following: •... -
Page 278: How To Set Safety Contour
11. CHART ALERTS 11.1 Chart Alerts Official S57 chart material contains depth contours that can be used for calculation of chart alerts. A chart database also includes different types of objects that the operator can use for chart alerts. The procedure for setting chart alerts is outlined below. 1. -
Page 279: How To Select Objects Used In Chart Alerts
11. CHART ALERTS 11.1.2 How to select objects used in chart alerts You can also include calculation areas that have to be noted when sailing (for exam- ple, restricted areas). To include these areas in chart alerts, do the following: 1. -
Page 280: How To Activate Own Ship Check
11. CHART ALERTS 11.2 How to Activate Own Ship Check Calculation of own ship predicted movement area is done using a check area about own ship position. Set the check area as follows: 1. Select the [Check Area] page from the [Overlay/ NAV Tools] box. -
Page 281: Route Planning
11. CHART ALERTS Object selected for Chart Alert Check Area Highlight (red) 11.3 Route Planning The system will calculate chart alerts using user-defined channel limit for routes. Dan- ger areas are shown highlighted if safety contour or user-chosen chart alert areas are crossed by the planned route. - Page 282 11. CHART ALERTS 4. Click the [Check Route] button to generate a list of chart alerts. The results appear on the [Check Results] page. The figure above shows the alerts to be monitored. If there are alerts included in the planned route, check alerts leg by leg, or check alerts by using category of alert.
-
Page 283: Route Monitoring
11. CHART ALERTS 11.4 Route Monitoring • When the ship enters a check area specified as a caution alert, a visual alert is gen- erated. Neither the object in the area or the route is highlighted. • When the ship enters a check area specified as a warning alert, a visual alert is gen- erated and the object and route are highlighted. - Page 284 11. CHART ALERTS This page is intentionally left blank. 11-8...
-
Page 285: 12. Routes
12. ROUTES 12.1 Route Planning Overview A route plan defines the navigation plan from starting point to the final destination. The plan includes: A route plan defines the navigation plan from starting point to the final destination. The plan includes: •... -
Page 286: Main Menu For Route Planning
12. ROUTES 12.2 Main Menu for Route Planning The main parameters for the route planning are: • Latitude and longitude of the waypoint • Channel limits to the waypoint • Turning radius of the waypoint • Maximum speed limit and planned speed for each leg There are two phases for a route: Route Plan and Route Monitor. - Page 287 12. ROUTES Note: A guide box that shows the range and bearing between waypoints as you drag the cursor is available. You can show or hide the box with the [Guide Box] button on the InstantAccess bar. Click the button to show its background color in light-blue to display the guide box.
-
Page 288: How To Use The Waypoints Page
Waypoint input: Delete last-entered waypoint. Text input: Erase last-entered character or character string. Note: The [UNDO] button is not displayed on the FURUNO 19-inch monitor unit. 12.3.1 How to use the Waypoints page The following fields and boxes can be found in the [Waypoints] page. -
Page 289: How To Use The User Chart Page
12. ROUTES WPT1 WPT2 Parallel Line for Leg 1 Parallel Line for Leg 2 WPT3 Note: You can select the route information data to display on the [Waypoints] page with the context-sensitive menu. Right- click an item from [WPT] to [PL 2/m] then select [Edit Columns] to show the context-sensitive menu. -
Page 290: How To Use The Optimize Page
12. ROUTES 12.3.3 How to use the Optimize page After all waypoints are inserted and you have made safe water calculation, you can optimize your route, on the [Optimize] page. If not selected, then optimization will be done automatically with max. speed. If you want do optimization with a specific strat- egy, see section 12.7 for how to optimize a route. - Page 291 12. ROUTES Radio buttons, input boxes Alert items Item Description Item Description [Check Check how to apply the alerts, [Draught/m] Ship’s draught type] to every leg or individual leg. (Only [Draught] can be applied to every leg.) [Safety Set the safety contour (in [Safety Contour] Safety contour Contour]...
-
Page 292: How To Use The Check Results Page
12. ROUTES 12.3.5 How to use the Check Results page The [Check Results] page allows you to make safe water calculation for your route. Click the [Check Route] button to do the check. After the button is operated, the alert type and latitude and longitude position of the alert appear for applicable legs on the route. -
Page 293: How To Change Other Waypoint Data
12. ROUTES 12.4.2 How to change other waypoint data Other data of a waypoint, such as name, steering mode, turning radius, min/max speed, can be edited from the [Waypoints] page. Select the route to edit and open the [Waypoints] page. Put the cursor on a desired field and spin the scrollwheel to change data. -
Page 294: Geometry Check Of Route
12. ROUTES 12.4.6 Geometry check of route When you add a new waypoint, modify a waypoint or change other waypoint data, the message "Impossible turn at WPT" may appear (in red). It means that the geometry of route makes it impossible for the ship to sail along a certain leg. Typically it is enough if you do the following, on the [Waypoints] page. - Page 295 12. ROUTES Search Options Sample pattern type [Expand- WPT7 ing square] 90.00° Start Leg Length WPT3 90° WPT4 WPT8 [Direction]: Set the direction to start 90.00° WPT2 the search, [Clockwise] or [Anti- WPT6 clockwise]. Search Pattern 90.00° [Search Pattern Heading]: See the Heading right figure.
- Page 296 12. ROUTES Search Options Sample pattern type [Sector Search Pattern Heading search] WPT3 WPT6 Sector #1 Sector #2 60° WPT9 WPT4 [Direction]: Select the direction to WPT2 WPT5 start the search, [Clockwise] or [An- ticlockwise]. [Search Pattern Heading]: See the Sector #3 right figure.
-
Page 297: Route Bank
12. ROUTES 12.6 Route Bank The route bank stores all the routes you have created. To show the route bank, in the Voyage planning mode, select [Planning], [Route], [Route Bank] in [Route Plan] dialog box: Route name Date created or modified Route32 15 Nov 2013 AAAAAA... -
Page 298: Route Optimization
12. ROUTES 7. Click the [<<] button to insert the waypoint(s) from the inactive route to the active route. In the example below, WPT1 of the inactive route is inserted at the end of the active route, becoming its waypoint 5. Route1 Route2 8. -
Page 299: How To Optimize A Route
12. ROUTES 12.7.2 How to optimize a route You can define Estimated Time of Departure (ETD), desired number of waypoints and Estimated Time of Arrival (ETA) on the [Optimize] page in the [Route Plan] dialog box to optimize your route. 1. -
Page 300: How To Plan A Speed Profile
12. ROUTES 3) For [Time table], the [Set ETA] window appears. Set the ETA to use for each waypoint. To enter the Time and Date, click the [Date] window to show the [Set date] window. Click the appropriate date. The date entered appears in the [Set ETA] window. -
Page 301: How To Import Routes
12. ROUTES 12.8 How to Import Routes 12.8.1 How to import FMD-3xx0, FCR-2xx9, FAR-3xx0 route data You can import a route created on another FMD-3xx0, FCR-2xx9, FAR-3xx0. 1. Set the USB flash memory that contains the route data to import in the USB port on the Control Unit. -
Page 302: How To Import Csv, Ascii Format Route Data
12. ROUTES 12.8.3 How to import csv, ASCII format route data 1. Set the USB flash memory to the USB port on the Control Unit. 2. Activate the Voyage planning mode. 3. On the InstantAccess bar, click the [Manage Data], [Route] and [Route Data Management] buttons to show the [Route Data Management] dialog box. -
Page 303: How To Export Route Data In Fea-2X07, Csv, Ascii Format
12. ROUTES 12.9.2 How to export route data in FEA-2x07, csv, ASCII format 1. Set the USB flash memory to the USB port on the Control Unit. 2. Activate the Voyage planning mode. 3. On the InstantAccess bar, click the [Manage Data], [Route] and [Route Data Management] buttons to show the [Route Data Management] dialog... -
Page 304: 12.11 Reports
12. ROUTES 12.11 Reports This chart radar generates reports for waypoints in the selected route. If connected to a printer, reports can be printed by clicking the [Print Text] button. Text in reports can be searched with the [Find] button. To generate a report, do the following: 1. - Page 305 12. ROUTES WPT table report The WPT report contains the following information: • Route name • Date of report • Waypoint no. • Length of waypoint • Distance remaining in route • Position in latitude and longitude • Planned courses and steering methods (RL (RhumbLine), GC (GreatCircle)) •...
- Page 306 12. ROUTES Full WPT report You can generate a full waypoint report for the route selected. The report includes the following for each waypoint. • Route name • Date of report • Waypoint no. • Position in latitude and longitude •...
- Page 307 12. ROUTES Passage plan report The passage plan report generates waypoint information for each waypoint in the route selected. • Route name • Date of report • Waypoint no. • Position in latitude and longitude • Length • Cumulative length •...
- Page 308 12. ROUTES This page is intentionally left blank. 12-24...
-
Page 309: 13. User Charts
13. USER CHARTS 13.1 Introduction User charts are overlays that the user creates to indicate safety-related objects and areas. They can be displayed on both the radar display and the electronic chart. These charts are intended for pointing out safety-related items like position of important nav- igation marks, safe area for the ship, etc. -
Page 310: How To Create A User Chart
13. USER CHARTS areas as defined by the master or by the policy of the ship's owner. They are always available regardless of the type of chart material used. • Circle: The operator can define an area with a circle, which can define a location to avoid. - Page 311 13. USER CHARTS 5. Put the cursor on the location to insert the object then push the left button. See the figure below for how to construct lines, areas and circles. For the “Tidal” object, you can set Orientation, Strength and Time from the dialog box. With the “Label” object you can enter text and show that text on the screen.
- Page 312 13. USER CHARTS 3) At the [Range of notes] (shown only for line) input box, enter the distance from the Notes position at which to display the Notes. Note: You cannot select both [Danger] and [Notes] for these symbols; select either [Danger] or [Notes].
- Page 313 Area, Line: Erase last-entered point. For [Area], the area must have at least four points. And for a [Line], there must be at least three points. Text input: Erase last-entered character or character string. Note: The [UNDO] button is not displayed on the FURUNO 19-inch monitor unit. 13-5...
-
Page 314: How To Import A User Chart Created With Ecdis Fea-2X07
13. USER CHARTS 13.3 How to Import a User Chart Created with ECDIS FEA-2x07 User charts created at the ECDIS FEA-2x07 can easily be imported to this ECDIS. Copy the user charts to a folder (see chapter 17 in the operator’s manual of the FEA- 2x07) in a USB flash memory then do as follows. -
Page 315: How To Edit Objects On A User Chart
13. USER CHARTS 13.4 How to Edit Objects on a User Chart Do steps 1 and 2 in section 13.2 to show the [User Chart] dialog box then click the [Se- lect] button. Select the user chart to edit then click the [Open] button. Follow the ap- propriate instructions below. -
Page 316: How To Select The User Chart Objects To Display
13. USER CHARTS 13.6 How to Select the User Chart Objects to Display User charts can be displayed on the electronic chart. Open the [Mariner] page in the [Symbol Display] menu and check the user chart items to display. Select the degree of transparency for the objects with [Transparent]. -
Page 317: User Chart Reports
13. USER CHARTS 13.8 User Chart Reports 1. Click the [Plan] button to go to the Voyage planning mode. 2. Click the [Report] button followed by the [User Chart] button to show the [Select User Chart] dialog box. 3. Select the appropriate user chart then click the [OK] button to show the selected report. -
Page 318: Tidal Report
13. USER CHARTS Tidal report A tidal report provides • Position of the tidal • Type of tidal (current or predicted) • Speed and direction of the tidal • Time of the tidal Line report A line report provides • Line name •... - Page 319 13. USER CHARTS Clearing line The Clearing line report shows the name and position of clearing lines entered on the chosen user chart selected. Area report An area report provides • Area no. and area name • The latitude and longitude position of each point of the area •...
-
Page 320: Circle Report
13. USER CHARTS Circle report The circle report provides the position and radius of circles drawn on a user chart. Label report A label report provides • Latitude and longitude position of each label • Name of each label • “On radar" is shown if the label is shown on the radar overlay. 13-12... -
Page 321: 14. How To Monitor Routes
14. HOW TO MONITOR ROUTES Route monitor is a means for permanent monitoring of the ship's behavior relative to the monitored route. The [Route Information] box displays the data on the ship's posi- tion relative to the monitored route. The monitored route consists of the following in- formation, displayed in the electronic chart area: •... - Page 322 14. HOW TO MONITOR ROUTES Method 2: Selection from the Route information box Right-click the route name location in the [Route Information] box then select [Select Route] to show the [Select Route] dialog box. Select a route then click the [Open] but- ton.
-
Page 323: How To Stop Route Monitoring (Manual, Auto)
14. HOW TO MONITOR ROUTES About monitoring routes When you select a route for monitoring, the messages shown below appear, on the [Select Route] dialog box or in a message window, when a route cannot be opened for monitoring. •... -
Page 324: How To View Waypoint Information
14. HOW TO MONITOR ROUTES 14.4 How to View Waypoint Information Click the [Route] and [Route INFO] buttons on the InstantAccess bar to show the [Route Information] dialog box. Click the [Waypoints] tab to show waypoint informa- tion. * Scroll list horizontally to view items shown in the right figure. -
Page 325: How To View User Chart Information
14. HOW TO MONITOR ROUTES 14.5 How to View User Chart Information In the Voyage navigation mode, click the [Route] and [Select] buttons on the InstantAccess bar, select a route, click the [Open] button, then click the [User Chart] tab. The [Linked User Chart] list shows all the user charts linked with the monitored route and their contents. -
Page 326: How To Use Instant Track To Return To Or Deviate From Monitored Route
14. HOW TO MONITOR ROUTES 14.7 How to Use Instant Track to Return to or Deviate from Monitored Route The instant track feature provides a temporary track, consisting of four waypoints, to return to or deviate from the monitored route. Correct data from navigation sensors is essential to this function. -
Page 327: Back To Track Mode
14. HOW TO MONITOR ROUTES 3. Roll the trackball to select the angle of approach to the destination then click. Current position Monitored route Instant track WPT2 WPT2 (orange) Instant track waypoints Destination (orange) Click destination point . Click a location to set desired angle of approach. A circle and arrow appear. -
Page 328: Instant Track Messages
14. HOW TO MONITOR ROUTES 2. Click a leg or a waypoint on the monitored route. The location must be within 50 NM of current position. Monitored route Current position WPT2 WPT2 Instant track Click a leg on monitored route. Instant track (orange) waypoints... -
Page 329: Instant Track Details
14. HOW TO MONITOR ROUTES Message Meaning Color "Checking..." Checking route. "OK" Instant track checked and is suitable to follow. Green "NG" Instant track check failed. "Check error." Route check error. "Instant Track is expired." Route monitor timeout. "Too many WPTs in monitoring More than 190 waypoints are in the monitored route."... -
Page 330: How To Monitor, Stop Monitoring An Instant Track Route
14. HOW TO MONITOR ROUTES 14.7.5 How to monitor, stop monitoring an instant track route How to monitor an instant track route If the route check results is "OK", click the [Monitor] button on the [Planning] page in the [Instant Track] dialog box to start monitoring the instant track route. Click the but- ton before the time remaining counts to zero, otherwise the instant track will be can- celled, followed by the message "Instant Track is expired."... -
Page 331: How To Change A Monitored Route When Following An Instant Track Route (Safe Off Track Mode Only)
14. HOW TO MONITOR ROUTES How to stop monitoring an instant track route Click the [Stop] button on the [Monitoring] page in the [Instant Track] dialog box to stop monitoring the instant track route. The system returns to monitoring the monitored route and the [Planning] page of the [Instant Track] dialog box opens. -
Page 332: Button Label And Equipment State
14. HOW TO MONITOR ROUTES 14.7.7 Button label and equipment state The label on the button at the position circled in the figure below changes according to the state of the instant track. Instant track state Button label Monitoring [Stop] Return to original route after [Reset] (Instant track route is erased - another instant back to track mode... -
Page 333: 15. Navigation Tools
15. NAVIGATION TOOLS This chapter presents the various navigation tools available with the system. With the exception of the mini conning display and the divider, the tools listed below are in the [Overlay/NAV Tools] box. • TT/AIS (see chapters 3 and 4) •... -
Page 334: Parallel Index (Pi) Lines
15. NAVIGATION TOOLS 15.2 Parallel Index (PI) Lines The parallel index lines are useful for keeping a constant distance between own ship and a coastline or a partner ship when navigating. Up to six sets of PI lines are avail- able and as many as six can be shown. -
Page 335: How To Adjust Pi Line Orientation, Pi Line Interval
15. NAVIGATION TOOLS 15.2.5 How to adjust PI line orientation, PI line interval There are two ways to adjust PI line orientation and PI line interval: through the menu and on the screen. How to adjust PI line orientation, PI line interval from the menu 1. -
Page 336: How To Adjust Pi Line Length
15. NAVIGATION TOOLS 15.2.7 How to adjust PI line length You can adjust the forward and backward lengths of a PI line when [Index Lines] is set to 1. 1. Open the MENU and select [NAV Tools], [PI Lines] and [Truncate]. 2. -
Page 337: Ring
15. NAVIGATION TOOLS 15.4 Ring The range rings are the concentric set of rings on the chart display. They provide an estimation of the range to an object. You can turn them on or off from the [Ring] page. Range ring The interval between rings changes with the chart scale as shown in the table below. -
Page 338: Anchor Watch
15. NAVIGATION TOOLS The Predictor is updated every three seconds internally and the status of the predictor is shown with [Status] as shown in the table below. Indication Status Speed is suitable (0.5 kn or higher). Not Enough Speed Speed is too low to use the Predictor. Not Available. -
Page 339: Ukc (Under Keel Clearance)
15. NAVIGATION TOOLS 15.7 UKC (Under Keel Clearance) 15.7.1 UKC overview The UKC is the distance between the deepest point of the vessel's hull and the sea- bed. The UKC feature continuously checks ship's draught setting (UKC), and actual depth. When the depth gets shallower than the UKC, the Alert 634 "UKC Limit" is gen- erated. -
Page 340: Ukc Window
15. NAVIGATION TOOLS 15.7.3 UKC window The UKC window provides a visual graphic of the relationship between UKC, draft and current depth. The window can be shown or hidden as desired and located anywhere within the electronic chart area. To show the window, click [Show UKC Window] on the [UKC] page. -
Page 341: Mini Conning Display
15. NAVIGATION TOOLS 15.8 Mini Conning Display The mini conning display, available in the Voyage navigation mode, provides various navigation information and is set during the installation. The display example below shows heading, doppler log speed and rudder angle. To show or hide the mini conning display, click the [Mini Conning] button on the InstantAccess bar. -
Page 342: Divider
15. NAVIGATION TOOLS 15.9 Divider The divider, available in the Voyage navigation and Voyage planning modes with rhumb line navigation, measures the range, bearing and TTG between points, like us- ing a dividers on a paper chart. Only one divider can be displayed. The divider is neither saved nor shared among chart radar units. -
Page 343: Usage Characteristics, Limitations
15. NAVIGATION TOOLS 15.9.2 Usage characteristics, limitations • The distance between points is shown to the hundredths decimal place up to 100 NM and to the tenths decimal place thereafter. • A maximum of 50 points can be inserted, and the maximum measurable distance between two points is 240.0 NM. - Page 344 15. NAVIGATION TOOLS This page is intentionally left blank. 15-12...
-
Page 345: 16. Navigation Sensors
16. NAVIGATION SENSORS 16.1 CCRS This chart radar employs a Consistent Common Reference System (CCRS) for the ac- quisition, processing, storage and distribution of sensor information. The CCRS en- sures that all parts of the system uses the same source and values, e.g., speed through water, heading, etc. -
Page 346: How To Select Navigation Sensors
16. NAVIGATION SENSORS 16.2 How to Select Navigation Sensors The operator can select navigation sensors to use for navigation and view their current values on the applicable page in the [System Sensor Setting] and [Local Sensor Set- ting] menus. To access these menus, right-click the Sensor information, datum box then click [Select Sensor] followed by [Setting]. - Page 347 16. NAVIGATION SENSORS [SPD] page (System Sensor) [Stabilization Mode]: Select the water stabilization mode: Select [Bottom] for ground stabilization, or select [Water] for sea stabilization. [Sensor Type]: Select [GPS] in case of a GPS navigator, or [LOG] for speed log. [Data Source]: Check [Sensors] to use a sensor in the [Sensors] list, or click [Manual] to enter speed manually.
- Page 348 16. NAVIGATION SENSORS [POSN] (Position) page The sensor label (here, GPS001, GPS002) indicates the name of the sensor. [Data Source]: Check [Sensors] to use a sensor in the [Sensors] list, or click [DR] to enter position manually. When the position source is changed based on priorities and signal validity to another position source, then you get the Alert 471 "Position Source Change".
- Page 349 16. NAVIGATION SENSORS [COG/SOG] page Select the source (GPS receiver) for speed over the ground and course over the ground. GPS001 [Other Sensor] page To show the [Other Sensors] page, open the menu and select [Other Sensor Settings] in the chart mode. [Wind]: Wind (True, Theoretical or Apparent) speed (kn or m/s) and direction are dis- played.
-
Page 350: Source Of Position
16. NAVIGATION SENSORS 16.3 Source of Position The figure below shows how source for position is chosen. The position sensors have either primary or secondary as input for their calculation. DGPS position sensors are considered more accurate than other position sensors. The latitude and longitude position is shown at the top-right position on the chart radar display, and in the example below the position source is DGPS. -
Page 351: Primary And Secondary Positions Of Own Ship
16. NAVIGATION SENSORS 16.4 Primary and Secondary Positions of Own Ship The system has three different positions for own ship: System position, Primary posi- tion and Secondary position. • System position: CCRP • Primary position: Position generated by position source with highest priority. •... -
Page 352: Source Of Navigation Data
16. NAVIGATION SENSORS 16.5 Source of Navigation Data The figure below shows how various sources of navigation data are chosen. "SOG, COG" is speed over the ground and course over the ground, respectively. "SPD" is speed through the water.”Drift” is the difference between speed through the water and speed over ground. - Page 353 16. NAVIGATION SENSORS Speed used by the system is shown at the top-right position on the chart radar dis- play.The figure below shows the source of water speed is used for drift calculation. Selected and Manual Water Stabilization Speed Manual speed set drift exists Mode Selected Manual...
-
Page 354: Switching Of Sensor And Indication
16. NAVIGATION SENSORS 16.6 Switching of Sensor and Indication When a sensor cannot be used because of some problem, the system automatically switches the sensor. When this occurs the name of the newly selected sensor appears in yellow. GYRO1 GYRO1 Speed sensor changed 16.7... - Page 355 16. NAVIGATION SENSORS [Passed] (green): Data is available for comparison and data is normal [Doubtful] (yellow): Data is not available for comparison, but data is normal. [Failed] (orange): Data is quite away from predicted value based on a comparison. [Excluded] (orange): Data is greatly changed compared with predicted value. [Not Available] (orange): Sentence status or mode indicator is abnormal.
-
Page 356: Position Alignment
16. NAVIGATION SENSORS The [Comparisons] column shows the sensors compared and the integrity evaluation of compared sensors in parentheses. Using the illustration above as an example, SOG/COG data fed from GP0002 is compared with the sensors GP0001 and VD0001. The integrity evaluation for the compared sensors is [Passed]. To unselect a sensor manually, select the sensor from the drop-down list at the bot- tom left corner of the page, click the [Unselect] button then click the [Save] button. -
Page 357: How To Cancel Position Alignment
16. NAVIGATION SENSORS 16.8.2 How to cancel position alignment Click the [Offset] button to cancel the position offset. 16.9 Wind Sensor The chart radar can display and output wind data in the following three formats: Apparent: Windmeter-measured wind speed and direction. Wind angle reference: Heading North: True wind angle, true wind speed Wind angle reference: True North... -
Page 358: 16.10 Depth Sensor
16. NAVIGATION SENSORS Wind Angle (Apparent: 345°) North Wind speed Wind from NNW (330°) (Apparent: 10 kn) Apparent Wind Heading True Wind Ship's Speed (SOG: 8.7 kn) Wind Speed (North/Theoretical: 5.0 kn) Angle (reference North) Wind Angle (Theoretical: 285°) Wind Angle (North: 330°) Apparent, north or theoretical wind may be selected from the [Other Sensor Settings] menu. - Page 359 16. NAVIGATION SENSORS 130.7m Mid: 130.8m Aft: 130.8m The system displays depth value as depth below the transducer. If required, you can get an alert when the measured depth is less than the "Echo Alarm Limit" setting at the [UKC] page in the [Overlay/NAV Tools] box. The system generates the Alert 485 "Depth Limit".
- Page 360 16. NAVIGATION SENSORS This page is intentionally left blank. 16-16...
-
Page 361: Ais Safety, Navtex Messages
17. AIS SAFETY, NAVTEX MESSAGES 17.1 AIS Safety Messages You can send and receive messages via the VHF link, to a specified destination (MM- SI) or all AIS-equipped ships within communication range of your ship. Messages can be sent to warn of safety of navigation, for example, an iceberg sighted. Routine mes- sages are also permitted. -
Page 362: How To Display Received And Sent Ais Safety Messages
How to display the Messages dialog box, view a message 1. Click the [MSG] and [Safety MSG] buttons on the InstantAccess bar. 2. Click the [Receive Box] or [Send Box] button as appropriate. 3. Click a message to view its contents. WELCOME TO FURUNO 17-2... -
Page 363: How To Delete Received And Sent Ais Safety Messages
17. AIS SAFETY, NAVTEX MESSAGES 17.1.3 How to delete received and sent AIS safety messages Note: A large amount of messages may take some time to delete. How to delete a received or sent message 1. Click the [Receive Box] or [Send Box] as appropriate. 2. -
Page 364: How To Delete Received Navtex Messages
17. AIS SAFETY, NAVTEX MESSAGES 17.2.2 How to delete received Navtex messages Note: A large amount of messages may take some time to delete. How to delete received Navtex messages 1. Click the [MSG] and [NAVTEX MSG] buttons on the InstantAccess bar. 2. -
Page 365: 18. Tt And Ais Displays
18. TT AND AIS DISPLAYS Tracked targets and AIS targets can be overlaid on the chart. Only the differences be- tween the radar and chart TT and AIS displays are described here. The data of received radar-tracked targets must have reference to ground. If the data does not meet that criteria, target vectors are not shown and the indications COG and SOG in the TT info data box show [missing]. -
Page 366: How To Display Tracked Target Data
18. TT AND AIS DISPLAYS 18.1.3 How to display tracked target data Control Unit: Put the cursor on a target then push the TARGET DATA key. Trackball module: Click the target for which you want to show its data. Title bar TT No. -
Page 367: Past Position Point Attributes
18. TT AND AIS DISPLAYS 18.1.4 Past position point attributes You can define past position point attributes for tracked targets by points and style. 1. Click the [DISP], [SET] and [Symbol DISP] buttons on the InstantAccess bar to show the [Symbol Display] menu. 2. -
Page 368: Ais Display
18. TT AND AIS DISPLAYS 18.2 AIS Display 18.2.1 AIS symbols Refer to section 4.3. 18.2.2 Voyage data Before you embark on a voyage, set your navigation status, ETA, destination, draught and crew, on the [Voyage Data] page in the [NAV Status] menu. The data entered here is reflected to the AIS transponder. -
Page 369: How To Filter Ais Targets
18. TT AND AIS DISPLAYS 18.2.3 How to filter AIS targets 1. Right-click [AIS] on the [TT/AIS] page in the [NAV Tools/Overlay box], select [Set- ting] and open the [Setting.1] page. (The [Setting.1] page can also be opened from the menu (MENU → [TT/AIS] → [Setting] →... -
Page 370: How To Sleep All Activated Targets
18. TT AND AIS DISPLAYS 18.2.5 How to sleep all activated targets You can sleep all activated targets. Right-click [AIS] on the [TT/AIS] page in the [NAV Tools/Overlay box], select [Setting] and open the [Setting.1] page. Click the [Sleep All Targets] button to sleep all activated targets. -
Page 371: How To Display Ais Target Data
18. TT AND AIS DISPLAYS 18.2.7 How to display AIS target data Normal data Put the cursor on an AIS target then push the left button. Title bar “Level of detail” button MMSI Scroll buttons* Vessel name Close button Heading Bearing Range Course over ground... - Page 372 18. TT AND AIS DISPLAYS Expanded data Put the cursor on a desired AIS target then push the left button. Click the [Expand] but- ton (level of detail) on the [AIS Info] box to show expanded AIS data. Title bar “Level of detail”...
-
Page 373: How To Display Own Ship Data
You can see own ship's data on the [Own Ship] page in the [NAV Status] menu. Open the menu then click both [NAV Status] in the [TT/AIS] menu and the [Own Ship] tab. MMSI: 457804356 Length(LOA): 223.2 m Name: FURUNO Voyager Width: 31.8 m Call Sign: JZ5890312 Ref Bow: 3.3 m... -
Page 374: How To Set The Conditions For Association
18. TT AND AIS DISPLAYS Note: You can also select the method by right-clicking the loca- Association: OFF tion. Click desired association method. Association: TT Association: AIS 18.3.2 How to set the conditions for association To set the criteria for association, right-click [AIS] on the [TT/AIS] page in the [NAV Tools/Overlay] box, select [Setting] and open the [Setting.2] page. -
Page 375: 19. Recording Functions
19. RECORDING FUNCTIONS The chart radar records various voyage-related items like movement and position of own ship and dangerous radar targets (from Radar). These items are recorded in the following logs: Event log: Records user events and position events. NAV log: Records entire voyage (i.e., a sailing of a route from first point to the last, also MOB data), details (position, speed and course every minute), chart usage (information on charts used for display). -
Page 376: Position Events
19. RECORDING FUNCTIONS 19.1.2 Position events The operator may manually save positions to the [Event] log by position or LOP (Line of Position): To record a position, get into the Voyage navigation mode or Voyage planning mode then do as follows: 1. - Page 377 19. RECORDING FUNCTIONS 4. For [Manual], manually enter position, enter a comment if required, then click the [Record] button. Enter position manually. Enter comment here if required. The position event mark appears at the manual input position. The position is re- corded to the [Voyage] log.
- Page 378 19. RECORDING FUNCTIONS Time transfer: If the observations are not simultaneous, they should be transferred to a common time. Transferring is based on dead reckoning of ship movement. If a po- sition line (or ring) is transferred, the letters TPL are shown beside its timestamp on the chart.
-
Page 379: Details Log
19. RECORDING FUNCTIONS 19.2 Details Log The [Details] log contains voyage information, recorded once per minute. • [Date] • [Time] • [Source]: No. of unit which generated log • [Type]: Type of position data • [Auto]: Automatic input of position •... -
Page 380: Voyage Log
19. RECORDING FUNCTIONS 19.3 Voyage Log The [Voyage] log records all voyage-related data of the past three months. Recorded events are: • [Date]: Date of entry • [Time]: TIme of entry • [Source]: No. of unit which generated log • [Type]: Log entry types •... - Page 381 19. RECORDING FUNCTIONS How to view the Voyage log To open the Voyage log, click the [Record], [NAV Log] and [Voyage] buttons on the InstantAccess bar. Export File • To show the logs of a specific period, enter the period to show with [Period Cov- ered (UTC)] then click the [Set Period] button.
-
Page 382: How To Set Conditions Of Logging
19. RECORDING FUNCTIONS 19.3.1 How to set conditions of logging The operator can set the conditions for automatic voyage logging. When your speed or course equals the amount set here, an entry is made in the [Voyage] log: • Define the amount of course and speed change which creates a log entry. •... - Page 383 19. RECORDING FUNCTIONS • To show the logs of a specific period, enter the period to show with [Period Cov- ered (UTC)] then click the [Set Period] button. Use the [Clear Period] button to dis- play all logs. • To refresh the log, click the [Refresh] button. •...
-
Page 384: Danger Targets Log
19. RECORDING FUNCTIONS 19.5 Danger Targets Log The [Danger Targets] log stores information about dangerous targets that are re- ceived from a radar (TTs) and/or targets that are received from an AIS transponder (AIS targets). If a TT or AIS target is within the set CPA (Closest Point of Approach) and TCPA (Time to CPA), information of all TTs (including non-dangerous targets) are recorded into the danger target log. -
Page 385: How To Set The Conditions For Logging Danger Targets
19. RECORDING FUNCTIONS 19.5.1 How to set the conditions for logging danger targets The operator may set Closest Point of Arrival (CPA), Time for CPA (TCPA) and Log interval for viewing dangerous TT and AIS targets on the chart radar display. 1. - Page 386 19. RECORDING FUNCTIONS This page is intentionally left blank. 19-12...
-
Page 387: 20. Alerts
20. ALERTS 20.1 What is an Alert? “Alert" is a generic name for a notice to any unusual or potentially dangerous situation generated within the system. Alerts are classified according to priority and category. Alert priority There are three alert priorities: alarm, warning and caution. Alarm: Situations or conditions which require immediate attention, decision and (if necessary) action by the bridge team to avoid any kind of hazardous situation and to maintain the safe navigation of the ship. -
Page 388: Alert Box
20. ALERTS 20.2 Alert Box When an alert is generated, the related alert message and alert state icon appear in the [Alert] box, which is at the bottom right corner on the screen. An audible alarm is additionally generated for alarms and warnings. In addition to the alert message and alert state icon, the [Alert] box has the buzzer stop button and provides access to the [Alert List] and [Alert Log]. - Page 389 20. ALERTS Alert message display format Priority Alert indication Alert state Display state of alert Alarm - Not acknowledged/Not Black characters on red rectified. background. TT CPA/TCPA - Not acknowledged/Rec- Flashing interval tified. • 0.5 s, 0.5 s (Not rectified) Displayed •...
- Page 390 20. ALERTS Alert state icons The table shows the icons used to indicate the various alert states for the alarm, warn- ing and caution alerts. Icon Alert state Icon description Alert priority: Alarm Not acknowledged/Not rectified Red triangle with black loudspeak- er in center of triangle.
-
Page 391: How To Temporarily Silence The Buzzer For An Alarm Or Warning
20. ALERTS 20.3 How to Temporarily Silence the Buzzer for an Alarm or Warning When the buzzer for an alarm or warning sounds, you can temporarily silence it by do- ing one of the following: • Click the buzzer stop button in the [Alert] box. •... -
Page 392: Alert List
20. ALERTS 20.5 Alert List The [Alert List] displays all active alerts, with unacknowledged alerts at the top, in pri- ority order. To display the list, right-click the [Alert List/Alert Log] button in the [Alert] box then select [Alert List/Log Window]. The ZDA sentence is required to display the time in the list. -
Page 393: Alert Log
20. ALERTS How the alert list is updated after acknowledgement, rectification When you acknowledge an alert, its display method on the [Alert] list changes accord- ing to alert category and alert state. Acknowledged and rectified alerts are immediately removed from the list. Alert Display after Display after... -
Page 394: Alert Reception From Connected Sensors
20. ALERTS You can select what type of alerts to display with [Priority Filter] and [Category Filter] at the top of the list. The list can be sorted by [Priority], [Cat.], [Alert No.], [Description], [Occurred Time], [ACKed TIime] or [Rectified Time]. Click the corresponding column title to sort. - Page 395 20. ALERTS Default Text priority Sentence Syntax Error Caution Main Monitor COM Timeout Caution Sub Monitor COM Timeout Caution Sensor Adapter 1 COM Timeout Caution Sensor Adapter 2 COM Timeout Caution Sensor Adapter 3 COM Timeout Caution Sensor Adapter 4 COM Timeout Caution Sensor Adapter 5 COM Timeout Caution...
- Page 396 20. ALERTS Default Text priority Gyro 1 COM Error Caution Gyro 2 COM Error Caution Gyro 3 COM Error Caution Gyro 4 COM Error Caution Gyro 5 COM Error Caution Backup Navigator Alarm UTC Time Not Available Warning Depth(Bow) Not Available Caution Depth(Midship) Not Available Caution...
- Page 397 20. ALERTS Default Text priority Water Temp COM Error Caution AIS COM Error Warning NAVTEX COM Error Caution Network Printer Not Available Caution Local Printer Not Available Caution Other Sensor 11 COM Error Caution Other Sensor 12 COM Error Caution Other Sensor 13 COM Error Caution Other Sensor 14 COM Error...
- Page 398 20. ALERTS Default Text priority AIS Target Display 100% Warning AIS Target Capacity 95% Caution AIS Target Capacity 100% Warning AIS Target Activate 95% Caution AIS Target Activate 100% Warning AIS CPA/TCPA Alarm AIS Lost Warning AIS Message Received Caution AIS Message Transmit Error Caution AIS Transmitting...
- Page 399 20. ALERTS Default Text priority EXT Radar No Signal Warning EXT Radar COM Error Warning Datum Mismatch Warning SPU Error Warning MTR-DRV Error Warning PM Error Warning RF-Converter Error Warning PSU-Control Error Warning NAVTEX Message Received Caution EPFS 1 Sensor Banned Caution EPFS 2 Sensor Banned Caution...
- Page 400 20. ALERTS This page is intentionally left blank. 20-14...
-
Page 401: 21. Parameters
21. PARAMETERS 21.1 Ship and Route Parameters The purpose of the ship and route parameters is set the basic parameters for the ship. These parameters are relative to ship steering and they are very important to get cor- rect function of the integrated navigation system. They must be maintained carefully. Modification requires a good knowledge of the parameters' importance. -
Page 402: Instant Track Parameters
21. PARAMETERS 21.2 Instant Track Parameters The instant track feature can create, in route monitoring, a simple route in the following situations: • Return to the monitored route when the vessel goes outside the channel limits. • Temporarily deviate from the monitored route (avoid collision, etc.). How to set instant track parameters Set the parameters for the instant track ([MENU] →... -
Page 403: Cost Parameters
21. PARAMETERS 21.3 Cost Parameters The cost parameters are used in the optimization calculation. Therefore define these parameters before doing the calculation. Open the menu and select [Cost Parameters] from the [General] menu to show the [Cost Parameters] page. Set each item according to ship’s plan, etc. At the [Cost] window, enter the cost/hour and cost/ton for heavy fuel oil and diesel oil. - Page 404 21. PARAMETERS This page is intentionally left blank. 21-4...
-
Page 405: 22. Settings Menu
22. SETTINGS MENU The [Settings] menu provides file import, export and maintenance, testing facilities (display, keyboard, self test), customizing, screenshot processing, and CCRP selec- tion. 22.1 How to Access the Settings Menu Radar Installation Name Description Click the button then select [Settings] to open the [Settings] menu. -
Page 406: File Export
22. SETTINGS MENU 22.2 File Export The [File Export] page lets you export setting data, routes, user charts, radar maps and radar installation to a USB flash memory, in .zip file format. Radar Installation Name Description [Setting data] Check to export setting data (radar, chart, conning, com- mon, performance monitor data) and ten user profile data. -
Page 407: File Import
22. SETTINGS MENU 22.3 File Import The [File Import] page lets you import setting data, routes, user charts, radar maps and radar installation from an external media (USB flash memory, etc.). Radar Installation Name Description [Select file to Click to show the [OPEN FILE] dialog box, where you can select import] button the file to import. -
Page 408: File Maintenance
22. SETTINGS MENU 22.4 File Maintenance The [File Maintenance] page lets you restore the last-saved route/user chart applica- tion and route/user chart system. Name Description [Route/Userchart Click to restore last-saved route/userchart application. Application Back- [Route/Userchart Click to restore last-saved route/userchart system. System Backup] [Restore] button Click to restore item selected. -
Page 409: Self Test
22. SETTINGS MENU 22.5 Self Test The [Self Test] page is mainly for use by the service technician to check the equip- ment. The chart radar is inoperative during the test. [EC-3000] RADAR Software Version: 0359266-02.xx [Radar Sensor] SPU Software Version: 0359281-01.xx [key1] Software Version: 2450086-01.xx [Dongle Information]... -
Page 410: Data Sharing
22. SETTINGS MENU 22.6 Data Sharing The [Data Sharing] page selects the items to share between the radar and the chart radar. NAV Tools PI Line Display Settings Color Palette Display Brilliance Name Description [NAV Tools] Check the NAV tools items to share them between the chart and the radar. -
Page 411: Customize
22. SETTINGS MENU 22.7 Customize The [Customize] page lets you set buzzer volume, key beep volume, and scrollwheel rotation direction. Name Description [Wheel rotation] Set the direction of scrollwheel rotation direction. [Normal]: Downward to increase value, upward to decrease value. [Reverse]: Reverse of [Normal]. -
Page 412: Display Test
22. SETTINGS MENU 22.8 Display Test The [DIsplay Test] page displays various test patterns to check the FURUNO-supplied monitor for proper display of colors. Click the [Display Test] button to start the test. The buzzer sounds when the display test starts. -
Page 413: Keyboard Test
22. SETTINGS MENU 22.9 Keyboard Test The [Keyboard Test] page checks the controls and keys on the Radar Control Unit and the ECDIS Control Unit and the trackball module on the Radar Control Unit, ECDIS Control Unit and Trackball Control Unit. Name Description Common controls... - Page 414 22. SETTINGS MENU Name Description Keys of both the Radar Con- Operate each key. The pressed key lights in trol Unit and chart radar light blue. Control Unit Trackball module Check the trackball module of a Control Unit: 1) Spin the scrollwheel and rotate the track- ball.
-
Page 415: 22.10 Screenshots
22. SETTINGS MENU 22.10 Screenshots The [Screenshot] page handles the exporting (to a USB flash memory) and deleting of screenshots from the SSD. Delete Export Name Description List List of screenshots taken. Screenshots are automatically assigned a file name consisting of the time and date the screenshot was taken. -
Page 416: 1How To Export Screenshots
22. SETTINGS MENU 22.10.1 How to export screenshots You can export screenshots to a USB flash memory as follows: 1. Insert a USB flash memory in the USB port on the Control Unit. 2. Open the [Screenshot] page. 3. Put a checkmark in the checkbox of the screenshot(s) to export. 4. -
Page 417: 22.11 User Default
22. SETTINGS MENU 22.11 User Default The [User Default] page restores all default settings for [Radar menu], [Chart menu], [User profile] and [Setting menu]. Click the [Restore User Setting] button. The mes- sage "All setting data will be restored to the default. Do you wish to continue?" ap- pears. -
Page 418: 22.12 Ccrp
22. SETTINGS MENU 22.12 CCRP The [CCRP] page provides for selection of CCRP (Consistent Common Reference Point) and shows the location of various sensors. Name Description [CCRP] Select the CCRP to use in the case of multiple CCRPs. [Display Filter] Check the items to show on the ship’s graphic. -
Page 419: 23. Common Reference System
23. COMMON REFERENCE SYSTEM 23.1 Installation of the System Special attention of following topics is required to maintain the "Common Reference System." The origin of the common reference system is the conning position on ves- sel. • The values of the center and conning positions depend on the size and geometry of the ship. - Page 420 23. COMMON REFERENCE SYSTEM • If synchro or stepper gyro data is fed to the chart radar, the heading indication on the chart radar must be adjusted to match that of the gyro. For the adjustment procedure, see section 1.15. Speed data: •...
-
Page 421: Maintenance And Troubleshooting
24. MAINTENANCE AND TROUBLE- SHOOTING Periodic checks and maintenance are important for proper operation of any electronic system. This chapter contains maintenance and troubleshooting instructions to be fol- lowed to obtain optimum performance and the longest possible life of the equipment. Before attempting any maintenance or troubleshooting procedure please review the safety information below. -
Page 422: Maintenance
Maintenance schedule Interval Check point Check and measures Remarks When needed FURUNO-supplied Dust or dirt may be removed Do not use chemical-based monitor unit and from a cabinet with a soft cleaners for cleaning. They Processor Unit cloth. Water-diluted mild de-... -
Page 423: How To Replace The Fuses
24. MAINTENANCE AND TROUBLESHOOTING Interval Check point Check and measures Remarks 3 to 6 months Cabling Check that all cabling is firmly connected and is not dam- aged. Exposed bolts and Exposed bolts and nuts are Check that bolts and nuts nuts of antenna unit subject to corrosion. -
Page 424: Trackball Maintenance
24. MAINTENANCE AND TROUBLESHOOTING 24.3 Trackball Maintenance If the cursor moves abnormally, dust or dirt may be on the trackball. Clean the trackball as shown below. 1. Turn the retaining ring on the trackball module counterclockwise 45° to unlock it. Retaining ring 2. -
Page 425: Troubleshooting
24. MAINTENANCE AND TROUBLESHOOTING 24.5 Troubleshooting The troubleshooting table below provides common faults and the remedy with which to restore normal operation. Radar troubleshooting If… then… Remedy the radar echoes disappear and check the connection between Reconnect the cable (if loos- the alert 727 "Radar Sensor the EC-3000 and radar sensor. - Page 426 "There is • dongle is not connected. • Connect dongle. no dongle or an error • data in the dongle is corrupted. • Contact FURUNO for assistance. has occurred in the dongle. The system will automatically shut down." appears monitored route is not •...
-
Page 427: Consumable Parts
24. MAINTENANCE AND TROUBLESHOOTING If… then… Remedy the message "Memory • the memory usage limit for soft- Click the [Restart] button to reset the ware is reached. Performance power. No other operations are avail- usage limit reached. Click the Restart button may be affected. -
Page 428: Color Differentiation Test For S57 Charts
24. MAINTENANCE AND TROUBLESHOOTING 24.7 Color Differentiation Test for S57 Charts The color differentiation checks if the chart radar monitor can distinguish between the various color-coded areas, lines and symbols. 1. Click the [Chart INFO] and [Chart 1] buttons on the InstantAccess bar to show the [ECDIS Chart 1] menu. -
Page 429: Fallback Arrangements
24. MAINTENANCE AND TROUBLESHOOTING 24.8 Fallback Arrangements If the top priority sensor (e.g. GPS1) can not be used, this equipment automatically uses the second priority sensor (e.g. GPS2) when the multiple sensors (e.g. GPS1 and GPS2) are installed. When all sensors can not be used, each function is limited as follows: Sensor Operation of this equipment... - Page 430 24. MAINTENANCE AND TROUBLESHOOTING This page is intentionally left blank. 24-10...
-
Page 431: Appendix 1 Menu Tree
APPENDIX 1 MENU TREE Radar menu MENU key (press) MENU bar (click) 1 ECHO 1 CUSTOMIZE 1 INT REJECT (OFF, 1, 2, 3) ECHO 2 ECHO STRETCH (OFF, 1, 2, 3) 3 ECHO AVERAGE (OFF, 1, 2, 3) 4 NOISE REJECT (OFF, ON) 5 AUTO SEA (OFF, ON) 6 AUTO RAIN (OFF, ON) 7 VIDEO CONTRAST (1, 2, 3, 4;... - Page 432 APPENDIX 1 MENU TREE (Continued from previous page) 4 AIS 1 VOYAGE DATA (NAV STATUS, ETA, DESTINATION, DRAUGHT, CREW) 2 STATIC DATA 3 SLEEP ALL TGTS (NO, YES) 4 CPA AUTO ACTIVATE 1 MAX RANGE (OFF, ON (0 to 99, 0 NM)) 2 MIN SHIP SPEED (OFF, ON (0 to 9.9, 1.0 kn)) 3 EXCEPT CLASS B (OFF, ON)
- Page 433 APPENDIX 1 MENU TREE (Continued from previous page) 4 INFORMATION 1 DISP INFO BOX (OFF, ON) 1 DEPTH (OFF, m, ft) 2 SET NAV DATA 3 ZOOM DISPLAY (STAB GND, 2 DEPTH GRAPH SCALE (10, 20, 50, 100, 200, 500, Auto) STAB HDG, STAB NORTH, TT TRACK) 3 DEPTH MARK...
- Page 434 APPENDIX 1 MENU TREE (Continued from previous page) 3 SHALLOW CONTOUR (0 to 99, 10 m) 4 SAFETY DEPTH (0 to 99, 30 m) 5 SAFETY CONTOUR (0 to 99, 30 m) 6 DEEP CONTOUR (0 to 99, 50 m) 7 SYMBOLS (SIMPLIFIED, PAPER CHART) 8 DEPTH ZONE (2 COLOR , 4 COLOR) 9 BOUNDARIES (PLAIN, SYMBOLIZED)
-
Page 435: Chart Menu
APPENDIX 1 MENU TREE Chart menu MENU key (press) MENU bar (click) General Ship & Ship Parameters Ship & MAX Speed (0.8 to 80, 22.1 kn) Route Route MAX Height (0.0 to 100, 16.1 m) Parameters MAX Draught (0.0 to 100, 20.0 m) Route Parameters MAX ROT (5 to 200, 60°/min) WPT Approach (30 to 60, 30 sec) - Page 436 APPENDIX 1 MENU TREE (Continued from previous page) DISP Basic Symbols (Paper Chart, Simplified) Setting Setting Depths (Two Color, Multi Color) Boundaries (Plain, Symbolized) Lightsectors (Limited, Full) Shallow Pattern (None, Diamond) Shallow Hazard (OFF, ON) TM Reset (20 to 99, 80%) Chart Standard* (Checkbox for each of Unknown Object or Presentation;...
- Page 437 APPENDIX 1 MENU TREE (Continued from previous page) Chart Set WARNING or CAUTION for Safety Contour, Areas To Be Avoided Alert User Chart Danger, Traffic Separation Zone, Inshore Traffic Zone, Restricted Area, Caution Area, Offshore Production Area, Military Practice Area, Seaplane Landing Area, Submarine Transit Lane, Anchorage Area, Marine Farm / Aqua Culture, PSSA Area, UKC Limit, Non-official ENC, No Vector Chart, Not Up-to-date, Permit Expired) Shallow Contour (0-99, 10 m)
- Page 438 APPENDIX 1 MENU TREE Settings menu File Export Select data to export (Setting data, Route/User chart, Radar map) Settings (Click) File Import Select file to import Select data to import (Setting data, Route/User chart, Radar map) File Maintenance Restore the last-saved route/user chart application and route/user chart system Self Test (Check various components of the system.) Data Sharing...
-
Page 439: Appendix 2 Abbreviations, Symbols
APPENDIX 2 ABBREVIATIONS, SYM- BOLS Abbreviations Abbreviation Meaning Anti Clutter Automatic Clutter Elimination Acknowledge Acquire Activate Adjustment Automatic Identification System ALARM Alarm Antenna April ATON Aid To Navigation August AUTO Automatic Blackbox Bow Cross Range Bow Cross Time Blue Bearing BRILL Brilliance Bottom Tracking... - Page 440 APPENDIX 2 ABBREVIATIONS, SYMBOLS Abbreviation Meaning Echo Average Electronic Bearing Line ENTER Enter Echo Stretch Escape Estimated Time of Arrival External February FILT Filter GAIN Gain Global Positioning System Green Gray GYRO Gyrocompass Heading HIDE Hide Heading Line International Maritime Organization Indication Integrated Navigation System Interference Rejection...
- Page 441 APPENDIX 2 ABBREVIATIONS, SYMBOLS Abbreviation Meaning North November October OFFSET Offset Own Ship PALETTE Palette PANEL Panel Illumination Personal Computer PERPENDIC Perpendicular Parallel Index (lines) POSN Position PULSE Pulse Relative Radius RAIN Rain RANGE Range Reference Relative Relative Motion Range Rate of Turn South S1 (2)
- Page 442 APPENDIX 2 ABBREVIATIONS, SYMBOLS Abbreviation Meaning True-S True-sea Tracked Target or Target Tracking Tracked Target Data Time to go Tracked Target Information TUNE Tune Transmit UNDO Undo Universal Time, Coordinated VECT Vector VECTOR Vector VIEW View Variable Range Marker West Without White Wheel Over Point...
- Page 443 APPENDIX 2 ABBREVIATIONS, SYMBOLS Symbol name and description Symbol graphic(s) Radar antenna position This symbol indicates location of the radar antenna. Select if position of radar antenna is displayed with symbol + in [MARK SETTING] menu. Own ship heading line This line originates from CCRP or Radar antenna position.
- Page 444 APPENDIX 2 ABBREVIATIONS, SYMBOLS Symbol name and description Symbol graphic(s) Radar targets in acquisition state - automatically detected Automatically detected target symbol is red and it flashes until acknowledged. 5 mm in diameter Tracked radar targets 3 mm in diameter Tracked radar targets - dangerous targets Dangerous target symbol is red and it flashes until acknowledged.
- Page 445 APPENDIX 2 ABBREVIATIONS, SYMBOLS Symbol name and description Symbol graphic(s) Activated AIS targets - alternative Associated targets represented by AIS target symbols Sarah J Sarah J Associated targets represented by radar tar- get symbols Activated AIS targets - heading lines Activated AIS targets - heading lines - turn indica- tors Velocity vectors...
- Page 446 APPENDIX 2 ABBREVIATIONS, SYMBOLS Symbol name and description Symbol graphic(s) Target past positions Radar target past positions AIS target past positions S arah J S arah J Associated target past positions S arah J S arah J AIS aid to navigation (ATON) Physical (real) ATON is solid line and virtual ATON is dashed line.
- Page 447 APPENDIX 2 ABBREVIATIONS, SYMBOLS Symbol name and description Symbol graphic(s) Selected targets Selected radar targets Selected AIS targets S arah J S arah J Selected association targets S arah J S arah J Selected AIS ATON Selected AIS SART AP-17...
- Page 448 APPENDIX 2 ABBREVIATIONS, SYMBOLS Symbol name and description Symbol graphic(s) Lost targets Lost radar targets Lost target symbol is red and it flashes until acknowl- edged. Lost AIS targets S arah J S arah J Lost associated targets S arah J S arah J LOST AIS ATON Lost AIS SART...
- Page 449 APPENDIX 2 ABBREVIATIONS, SYMBOLS Symbol name and description Symbol graphic(s) User cursor Electronic bearing line (EBL) Second example show with range marker. Variable range marker (VRM) Range rings Parallel index lines Trial maneuver Displayed (flashing) during trial maneuver. Simulation mode Displayed (flashing) during TT performance test.
- Page 450 APPENDIX 2 ABBREVIATIONS, SYMBOLS Radar map symbols IMO and A types B-type Category Symbol Color* Name Category Symbol Color Name 7 colors Buoy Buoy 7 colors Buoy Green Buoy 7 colors Buoy Buoy 7 colors Buoy Green Buoy 7 colors Danger Buoy 7 colors...
- Page 451 Display received AIS message (radar mode) Access user profile, common settings Information (show program no., operator's manual) Undo, redo Note: This symbol is not displayed on the FURUNO 19-inch monitor unit. Screenshot capture Monitor brilliance (FURUNO monitor only) Color palette selection...
-
Page 452: Appendix 3 Data Color And Meaning
APPENDIX 3 DATA COLOR AND MEANING Indication Sensor COG/SOG Display example color color SYSTEM THS-A GNS-A,D,F,P,R VBW-A VTG-A,D,P GGA-1,2,3,4,5 GLL-A,D and (status: A) RMC-A,D,F,P,R and (status: A) All values in green. DGPS update interval in GGA, GNS sentence is higher than 10 seconds. -
Page 453: Specifications
3050 MHz ±30 MHz, P0N Solid state radar CH1: 3043.75 MHz (P0N)/ 3063.75 MHz ±5 MHz (Q0N) or CH2: 3053.75 MHz (P0N)/ 3073.75 MHz ±5 MHz (Q0N) Output power FAR-3210/3310 12 kW FAR-3220/3320/3320W 25 kW FAR-3230S/3330S/3330SW 30 kW FAR-3230S-SSD/3330S-SSD 250 W (equivalent to magnetron radar 30 kW) - Page 454 FURUNO FAR-32x0/33x0 SERIES Solid state radar: Pulselength of P0N/Q0N Range scale (NM) Range (Hz approx.) 0.125 0.25 0.5 0.75 1 1.5 2 3 4 6 8 96 120 2400* 0.07/5.0 μs 2000* 0.18/7.5 μs 1500 0.3/12.5 μs 1060 0.5/17.5 μs 1000 0.7/18.3 μs...
- Page 455 MC-3030D (digital-out) 3 ports: relay contact, normal open and normal close available POWER SUPPLY Power supply unit (w/ antenna and transceiver unit) FAR-3210/3310 (X-band, 12 kW) PSU-014 (24rpm) 100-230 VAC: 2.0-1.0 A, 1 phase, 50-60 Hz PSU-014 (42rpm) 100-230 VAC: 2.4-1.1 A, 1 phase, 50-60 Hz...
- Page 456 FURUNO FAR-32x0/33x0 SERIES Switching HUB (option) HUB-3000 100-230 VAC: 0.1 A max. 1 phase, 50/60 Hz HUB-100 100-230 VAC: 0.1 A max. 1 phase, 50/60 Hz Transformer (RU-1803, option) 440 VAC, 1 phase, 50/60 Hz De-icer (option) 100-115/220-230 VAC: 2.6/1.3 A, 1 phase, 50-60 Hz...
-
Page 457: Index
INDEX voyage data........4-14 18-4 A/C RAIN control........2-5 voyage data (chart mode) ..... 18-4 Alert box ....... 2-56 6-10 20-2 A/C SEA control ........2-3 Alert list ........... 20-6 ACQ/ACT key..........4-5 Alert log ........... 20-7 Acquisition zone Alert parameters page......12-6 acknowledging alarm for ...... - Page 458 INDEX Cost parameters........21-3 status............7-18 Chart database (chart radar)....2-63 Course-up mode ........2-18 Chart database button ......8-10 CPA/TCPA alarm CHART DISP button ........2-60 AIS ............4-10 Chart display indications ......1-12 TT............3-16 Chart legend Cursor attributes........2-36 C-MAP............10-3 Cursor position box S57............9-2 chart ............6-16 Chart objects (chart radar) radar, chart radar ........1-25 custom sets of ........2-62 Customize page ........22-7...
- Page 459 INDEX ENC charts messages ..........14-8 AIO display ..........9-8 monitoring ........... 14-10 catalog of chart cells ......7-15 safe off track.......... 14-6 chart cell grouping ......... 7-16 stopping monitoring ......14-11 Interference rejector ........2-7 chart cell status ........7-18 chart installation ........
- Page 460 INDEX copying marks and lines in an area..5-7 copying marks and lines to Palette button ..........1-6 another map file ........5-8 Parallel index lines erasing all marks and lines in a map file ..5-6 activating, deactivating......15-2 bearing reference ......2-31 15-2 erasing individual marks and lines ...5-5 erasing marks and lines in an area ..5-5 displaying ..........2-31...
- Page 461 INDEX full WPT report ........12-22 file maintenance page ......22-4 importing csv, ASCII data....12-18 keyboard test page........ 22-9 importing FEA-2x07 data ....12-17 screenshots page ........ 22-11 importing FMD-3xx0, FCR-2xx9 data.. 12-17 self test page ......... 22-5 user default page ........ 22-13 inserting waypoint .........
- Page 462 INDEX lost target alert ........3-17 lost target alert filter (chart mode) ..18-3 VECTOR MODE key........3-13 manual acquisition ........3-5 VECTOR TIME key ........3-13 past position display.......3-13 Vectors past positions, attributes (chart mode) ...18-3 own ship ..........2-35 pop-up info ..........3-10 target ............2-35 showing ............3-1 Voyage log simulation mode ........3-20...
Need help?
Do you have a question about the FAR-3210 and is the answer not in the manual?
Questions and answers