Table of Contents
Advertisement
Quick Links
Introduction
• Thank you for purchasing this IWATSU's instrument.
• Please read this manual before using the instrument, then keep the manual handy for
future reference.
• To ensure safe operation of this instrument and to prevent injury to the user or damage
to property, read and carefully observe the warnings and cautions in the following
section.
• This operation manual mainly describes notes on use, operation method through the
panel, examples of use, and performance. For details about remote control through RS-
232C and GP-IB (special optional cable needs to be used), please refer to the Commands
Manual in the later part of this operation manual.
Note
• Parts of the contents of this manual may be modified without notice for improvements
in performance and functions.
• Reproduction or reprinting of the contents of this manual without prior permission
from IWATSU is prohibited.
• The TFT color LCD contains cold cathode fluorescent lamps. Observe local ordinances
and regulations when disposing of the LCD.
• Windows and MS-DOS are registered trademarks of Microsoft Corporation.
• For questions about this instrument, contact IWATSU TEST INSTRUMENTS
CORPORATION our Homepage listed at the end of this manual or our sales distributor.
Revision History
May 2002
: 1st edition
November 2002 : 2nd edition
KML042321
A201-422500(B)
i
Advertisement
Table of Contents

Subscribe to Our Youtube Channel
Related Manuals for Iwatsu DS-8814


Summary of Contents for Iwatsu DS-8814
- Page 1 LCD. • Windows and MS-DOS are registered trademarks of Microsoft Corporation. • For questions about this instrument, contact IWATSU TEST INSTRUMENTS CORPORATION our Homepage listed at the end of this manual or our sales distributor.
-
Page 2: Safety Precautions
Safety precautions To ensure safe operation of this instrument and to prevent injury to the user or damage to property, read and carefully observe the warnings and cautions in the following section and associated symbols marked on the panel diagrams. Definitions of warnings and cautions used in this manual Incorrect operation or failure to observe the warning may result in death or Warning... -
Page 3: Warnings
Read the following safety information. Warnings Installation • Do not use in an environment with explosive gases. It may cause an explosion. • If you notice smoke, foul odor or abnormal noise, immediately stop measuring to avoid electric shock or fire. Turn off the instrument to be measured and disconnect the power cable from the power outlet. - Page 4 Read the following safety information. Warnings • Power cord Do not use a damaged power cord or adapter, otherwise fire or electric shock could result. If the power cord is damaged, please contact our Homepage listed at the end of this manual or our sales distributor for repair. •...
- Page 5 Read the following safety information. Warnings Operation • Make sure no water gets on or inside the product • Do not use the product if wet, otherwise electric shock or fire could result. If water gets on or inside the unit, turn the power switch to STBY and remove the power cord.
-
Page 6: Cautions
Read the following safety information. Cautions Installation • Always use this instrument only within the rated operating range. If used over the rated range, failure may occur. Use this instrument only indoors. Operating conditions Temperature: 0 to +40°C Humidity: 80% RH or less (non-condensing) Height: 2,000 meters or less •... - Page 7 Read the following safety information. Cautions Handling • Set the power switch to STAND BY before connecting or disconnecting the power cord. Connecting or disconnecting the power cord while the power is supplied to the instrument may cause electric shock or malfunction. •...
- Page 8 Read the following safety information. Cautions Cautions before using the floppy disk drive • Before using the floppy disk drive, make the front panel of the instrument faced forward. If the instrument is operated with its front panel made faced upward, write or read error may occur.
-
Page 9: Check The Items Included In The Package
Check the items included in the package. When you receive the product, please check the items included. If any item is missing or damaged , immediately contact our Homepage listed at the end of the manual or our sales distributor. Components •... - Page 10 Packing Diagram Top packing Polyethylene bag Corner pats Bottom pad Main unit Accessory Bottom packing Figure 1 Main Unit Packing Diagram Figure 2 Packing...
-
Page 11: Table Of Contents
Contents Introduction ...................... i Safety precautions ..................ii Warnings ....................... iii Cautions ......................vi Check the items included in the package ............ix Components ....................ix Menu hierarchy and table of contents ............xiv Section 1 Basic Operation ..................1 Appearance .................... - Page 12 AUTO/NORM/SGL, Sweep mode in roll function ..........20 RUN/STOP ......................21 Cursor measurement ................22-23 ∆V/∆t/∆V & ∆t/∆V at t/OFF, FUNCTION, C1/C2/TCK ........... 22 Type of cursor measurement ................23 Copy function ................... 24-25 Making a hard copy ....................24 Loading printer roll paper ..................
- Page 13 Horizontal axis ....................45 Triggering ..................... 46 TV trigger ...................... 48 ACQUISITION ....................50 Peak detection (Peak Det) ................... 50 Average (Average) ....................51 Equivalent sampling (EQU SMPL) ............... 52 Roll (ROLL) ......................53 Sweep mode in Roll operation ................54 Persistence (PERSISTENCE) ................
-
Page 14: Menu Hierarchy And Table Of Contents
Menu hierarchy and table of contents The numbers in parentheses indicate reference pages. 0 to 100%(10) Contrast Trace Join Coupling XY1&2 Type CH1/CH2/ Auto XY3&4 Probe CH3/CH4 DISPLAY XY1&2/3&4 1:1 to 1000:1 Grid Scale Axis (30,31,44) (12,14,15) Frame Zoom 1.01 to 2.50 Division Offset Volts... - Page 15 Top-Base 100% Upper 11 to 90% Lower 10 to 89% Vrms MEASURE Vmean CH1/CH2 freq /CH3/CH4 Period (32,33,58 to 62) 10 to 90% Level Duty Parameter +Peak -Peak Set the parameter values enclosed with dotted line. Base Edge From Level Edge Level Skew12...
- Page 16 Auto Normal Sweep Single (20,21) Count Edge Burst Event Extra Trig Type Missing Both Even TRIGGER TV-H Source (In any mode Line other than roll mode) (19,20,46) Coupling HF-R LF-R Slope Hold off* 200ns to 2s * "Hold off" exclusively for when Edge of Trig Type is selected Endless Sweep Trigger’d...
- Page 17 CURSORS MEASURE V-CI Vrms V-C2 Vmean V-TRACK freq Period H-CI H-C2 1/ t H-TRACK Duty FUNCTION V/ t12 H-CI V-CI +Peak V-C2 H-C2 -Peak V-TRACK H-TRACK 1/ t Base V/ t34 V-CI H-CI V-C2 H-C2 V-TRACK H-TRACK Skew12 1/ t Skew34 Skew13 V at t...
- Page 18 Memo xviii...
- Page 19 Operation Manual...
-
Page 20: Section 1 Basic Operation
Section 1 Basic Operation This section describes the basic operation including start-up. See Section 2, “Explanation of Functions” for details. -
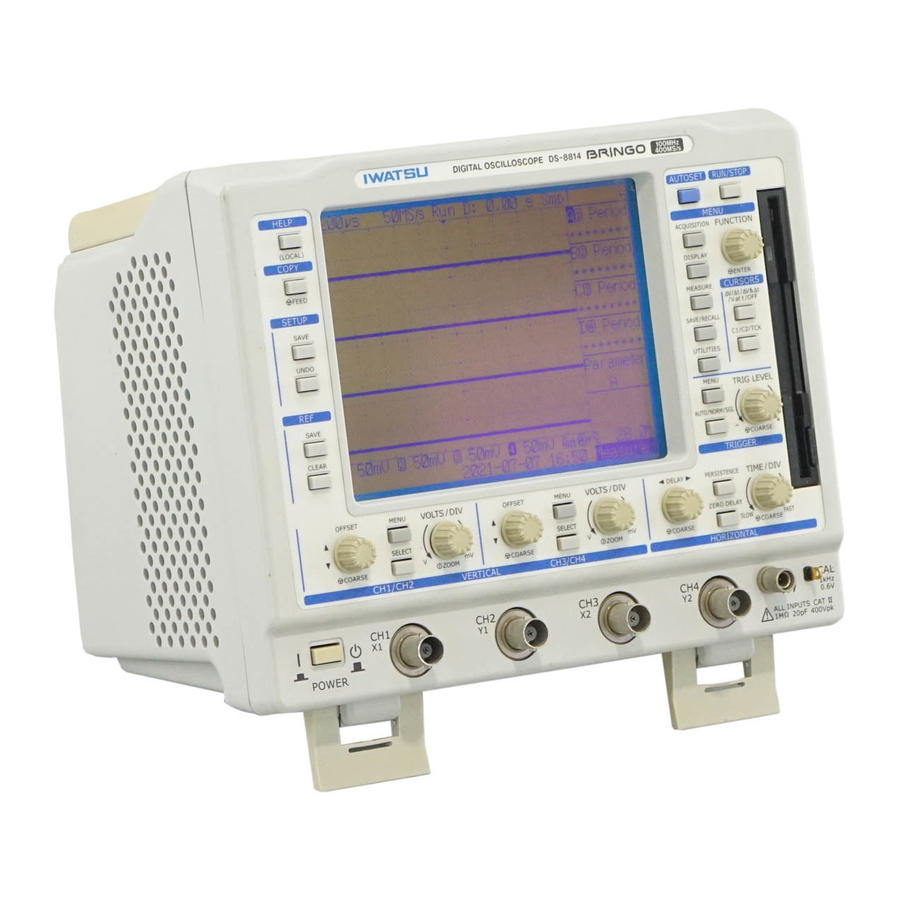
Page 21: Appearance
Appearance ⑤ ① ④ ② ② ③ ② ② Front View ① Power switch ② Input terminal ③ CAL terminal/calibration signal output terminal ④ Ground terminal ⑤ Floppy disk drive... -
Page 22: Rear/Upper View
③ ① ④ ⑤ ② Rear View ① GP-IB port ② RS-232C port ③ AC power inlet ④ Fuse holder ⑤ PCMCIA Type II slot ① Upper View ① Built-in printer... -
Page 23: Operating Buttons And Knobs
Operating buttons and knobs Buttons Single function button: Pressing the button with relevant name executes the associated function. AUTOSET, RUN/STOP, HELP, COPY, SETUP SAVE, SETUP UNDO, REF SAVE, REF CLEAR, ZERO DELAY Channel change button Every time the SELECT button is pressed, the channel to be operated with CH1 and CH2 or CH3 and CH4 is changed. -
Page 24: Menu (Function) Operation
Menu (FUNCTION) operation There are two ways of selecting a setting item in the menu; one is to turn the FUNCTION knob to select an item, and then press the knob to fix it, and the other is to fix the item by pressing the menu button while the item is displayed. -
Page 25: Description Of Operation Section
Description of operation section Shown in ( ) is the reference page. [MENU] button: Displays the CH1,CH2, CH3 and CH4 menus. (P14, P15, P44, P45) VOLTS/DIV MENU OFFSET [SELECT] button: Every time the SELECT button is pressed, the channel to be operated with CH1 and CH2 or CH3 and CH4 is SELECT changed. - Page 26 [DELAY] knob: Sets the trigger delay TIME/DIV PERSISTENCE DELAY time. (P16) ZERO DELAY [ZERO DELAY] button: Set the trigger SLOW FAST COARSE COARSE delay time to zero. (P16) [PERSISTENCE] button: Sets overwrite ON or OFF. When ON, waveforms are accumulated on the display. (P17) [TIME/DIV] knob: Selects the sweep rate in 1-2-5 sequence.
-
Page 27: How To Read Screen
How to read screen ① ① ① ① ① Waveform display area ④ ④ ④ ④ ④ Vertical axis/trigger display area Displays a waveform and scale. At the left end of the screen, the GND 1 200mV + 2 200mV 3 200mV 4 200mV Aut 2 +HF -99.9mV reference markers of CH1 to CH4 waveforms are displayed as markers 1 to... - Page 28 Marks on waveform display GND: Reference mark display Indicates the GND position with ‘_’. Up/down Delay mark Trigger level mark arrows ▲ or ▼ are displayed at the upper or lower position when the channel position is outside of the display area. Trigger level mark display Indicates the trigger position with ‘T’...
-
Page 29: Before Starting The Measurement
Before starting the measurement Make the following adjustments if necessary. Contrast setting Adjusts the contrast of the screen. The contrast is automatically set initially when the power is turned on. You may adjust the contrast manually if necessary. This manually-adjusted condition is maintained until the power is turned off. 1. -
Page 30: How To Restore The Setting At Time Of Purchase
Display date on the screen To display the date in the message area, select Date in the Status menu. 1. Press the DISPLAY button. 2. Select Date in the Status menu with [FUNCTION operation]. 3. The date is displayed at the bottom right of the screen. Reverse display function (LCD) Toggles the screen between Normal (white background) and Reverse (blue background). -
Page 31: Displaying Cal Waveform By Autoset
Displaying CAL waveform by AUTOSET If you are not sure about the amplitude or frequency of a signal, or how to operate the scope, press the AUTOSET button. The scope then automatically sets the vertical, horizontal and trigger condition for displaying the input signal. (For details of AUTOSET, see the appendix 3.) Auto setup function After the signal is input, press the AUTOSET button... -
Page 32: Calibrating The Probe
Calibrating the probe To measure correct waveforms, it is necessary that the phase of the probe has been adjusted properly. Before using the probe, follow the steps below to adjust the phase. Insert the screwdriver supplied with the instrument into the probe phase adjustment hole and turn the variable capacity to change the displayed waveform to the correct square waveform. -
Page 33: Operating Vertical Axis
Operating vertical axis MENU: Displays the vertical menu. SELECT: Sets a channel, through which MENU, OFFSET, or VOLTS/ DIV can be operated. Trace Selects display (On) or non-display (Off) of CH1/CH2/CH3/CH4 waveform. OFFSET Sets the position of the waveform in the vertical direction. Pressing OFFSET moves the waveform in Turn clockwise (moves up) 1-division steps in the direction it was last... -
Page 34: Coupling, Bw, How To Use Volts
Selects the input signal coupling from DC → Ground → AC. Coupling Square wave when Square wave when AC is selected DC is selected ∼ ∼ ∼ ∼ ∼ AC coupling (V) : The signal of 10 Hz or below is attenuated and the DC component is blocked. -
Page 35: Operating The Horizontal Axis
Operating the horizontal axis TIME/DIV Sets the sweep rate per scale (approximately 9 mm). The setting range is 5 ns to 50 s/div in 1-2-5 sequence. When pressing the TIME/DIV knob if FFT is not selected in Math, either 1-2-5 sequence or 1-10-100 sequence are set. -
Page 36: Sampling Rate, Memory Length, Persistence
How to use trigger delay (DELAY) zero To expand/reduce waveform relative to trigger point, set trigger delay time to zero. Sampling rate This is the number of data points acquired in one second. It is determined by the memory length and sweep rate (see page 75 through 78). -
Page 37: Trigger
Trigger Trigger signal: Sets the trigger level within the range of the signal amplitude to trigger. Level A trigger signal is generated at the cross point of the input signal and the trigger level. The relation between the trigger level, delay time and captured waveform is shown in the figure below. -
Page 38: Trig Type, Slope, Source, Coupling, Hold Off
Selects “Edge”, “EVENT” or “TV” Type in the TRIG menu. Trig Type (For EVENT and TV, see Section 2.) The trigger signal is generated at the cross point of the input signal and the trigger level in the edge trigger as shown in the figure on page Selects the rising slope (Pos) or the falling slope (Neg) of the input Slope signal to generate a trigger signal. -
Page 39: Sweep Mode
Sweep mode Changes the sweep mode from AUTO → NORMAL → SINGLE. AUTO/ NORM/SGL (The same operation can also be set by Sweep in the TRIG menu.) The selection conditions of [Auto] [Norm] [Sngl] are displayed at the bottom of the screen. AUTO Free run sweep starts when no trigger signal is available. -
Page 40: Run/Stop
RUN/STOP Sets start/stop of waveform capturing. Toggles between Run/Stop and displays the current condition at the top center of the screen. Operation Stops capturing a new waveform in the STOP condition. The already while STOP captured waveform (currently displayed waveform) can be enlarged or reduced or its position can be varied for both the vertical and horizontal axes. -
Page 41: Cursor Measurement
Cursor measurement Horizontal (H cursor) and vertical (V cursor) are displayed simultaneously. ∆ ∆ ∆ ∆ ∆ V/∆ ∆ ∆ ∆ ∆ t/∆ ∆ ∆ ∆ ∆ V & Every time the button is pressed, the cursor measurement type can be ∆... -
Page 42: Type Of Cursor Measurement
[Example] ∆ ∆ ∆ ∆ ∆ V&∆ ∆ ∆ ∆ ∆ t12 measurement → Measurement item currently selected V-C1 → Cursor that can be operated by FUNCTION knob Δ V → ∆V measurement result at CH1 voltage sensitivity H-C2 (When trace is OFF, *** is displayed) H-C1 Δ... -
Page 43: Copy Function
Copy function Outputs a hard copy of the screen to the built-in printer, floppy disk and ATA card. Copy Outputs a hard copy of the screen to a specified device. See Section 2, for details. UTILITIES Displays the UTILITIES menu. Select Copy in the UTILITIES menu with [FUNCTION operation]. -
Page 44: Loading Printer Roll Paper
Built-in printer Paper feed Pressing the Copy button for 1 second or more starts paper feed when the built-in printer is used. The paper feed stops when the button is released. (Pressing this button for less than 1 sec simply performs normal copy operation.) Attachment procedure Loading printer roll paper... -
Page 45: Save/Undo Of Setup
SAVE/UNDO of SETUP Simply pressing these buttons saves the current panel setting to internal memory or recalls the saved setting. SETUP Saves the current panel setting in internal memory. The internal memory SAVE stores the condition immediately before the last pressing of the button. SETUP Recalls the saved setup from the internal memory. -
Page 46: Save/Clear Button Of Ref
SAVE/CLEAR button of REF Displays the reference menu. Pressing the button again erases all reference waveforms displayed. Stores the currently displayed waveform as a reference waveform on the screen and saves the waveform data to internal memory with panel SAVE setting data as reference data. -
Page 47: Acquisition Menu
Acquisition menu ACQUISITION Displays the acquisition menu. Sets various functions related to waveform capturing. (See page 50 in Section 2 for details.) ACQUISITION Selects from the following 3 functions. At the top right of the screen, mode setting the selection conditions of [Smpl] [Peak] [Avg] are shown. Normal sampling Samples the input signal in sweep rate related period. -
Page 48: Acquisition Mode Vs. Sweep Range
Acquisition mode vs. Sweep range Memory length: Short Long 5ns↔200ns↔1µs↔2µs ↔ 20µs↔100µs↔100ms↔2s ↔ 5s ↔ 50s Acquisition Peak Det EQU Smpl Roll Average Norm Smpl Inter Leave Limitation of acquisition EQU sampling and averaging are not available for long memory. Averaging and persistence are not available in Roll mode. -
Page 49: Display Menu
DISPLAY menu DISPLAY Displays the DISPLAY menu related to the waveform or readout display. (See Section 2 for details.) Sets the contrast between the waveform and background. (0 to 100%) Contrast The contrast is automatically set initially when the power is turned on. setting You may adjust the contrast manually if necessary. -
Page 50: Scale/Math/M Source/Status Setting
Sets the scale for display (Grid, Axis, Frame) in the waveform display Scale area. setting Grid: Example of selecting Grid Displays the grid, which 1 DIV divides the vertical direction 1 DIV into eight divisions and the horizontal direction into ten divisions. -
Page 51: Measure (Auto Measurement) Menu
MEASURE (auto measurement) menu Selects any of the 4 items A, B, C and D from auto-measurement MEASURE items such as Tr (rise time) and freq (frequency) of a signal, which are executed simultaneously. For some measurement items, parameters need to be set and the measurement points are displayed (+ marks). -
Page 52: Measurement Item, Auto-Measurement Parameter
Measurement item For the types of auto-measurement and details of the measurements, see Section 2. Menu-Symbol Parameter menu Measuring point + display Item ① Rise time ① Fall time RMS measurement Vrms Average voltage Vmean Channel ② Frequency freq symbol, ②... - Page 53 Auto-measurement parameter Menu Setting item Set value ① 100% value Top-Base/P-P Upper 10 to 90% Lower 10 to 90% ② Level 10 to 90% ③ From Edge 1:Rise/1:Fall/2:Rise../4:Fall From Level Voltage value To Edge 1:Rise/1:Fall/2:Rise../4:Fall To Level Voltage value CH1*/CH3**/CH1***Edge Rise/Fall CH1*/CH3**/CH1***Level 10 to 90%...
- Page 54 The auto measurement is performed for desired 4 items (A, B, C, and D) of full auto measurement items. The following shows the auto measurement sequence and channels to be measured. The auto measurement is performed for desired 4 items (A, B, C, and D)
-
Page 55: Save/Recall Menu
SAVE/RECALL menu SAVE/ Saves and recalls SETUP (panel setting) and WAVEFORM (waveform RECALL data) to a floppy disk or ATA card. The CH1, CH2, CH3 and CH4 waveforms are saved simultaneously. Both the panel setting and the waveform data are recalled simultaneously. Saves/recalls the CH1/CH2/CH3/CH4 waveforms irrespective of display ON/OFF. -
Page 56: Saving Panel Settings To Floppy Disk
Saving panel settings to floppy disk 1. Press the SAVE/RECALL button to display the SAVE/RECALL menu. 2. Set Device to Floppy with [Function operation]. 3. Set Type to Setup (panel setting) with [Function operation]. 4. Set Function to Save with [Function operation]. 5. -
Page 57: Saving Waveform To Floppy Disk
Saving waveform to floppy disk 1. Press the SAVE/RECALL button to display the SAVE/RECALL menu. 2. Set Device to Floppy with [Function operation]. 3. Set Type to Waveform with [Function operation]. 4. Set Style to Binary with [Function operation]. 5. Set Function to Save with [Function operation]. 6. -
Page 58: Save/Recall Menu (Continuation)
Save/Recall menu (continuation) Format Formats a medium inserted to a specified device. Note that formatting setting the medium will erase all data saved in the medium. Using a medium such as floppy disk or ATA card requires formatting. Formatting the floppy disk The format operation erases all stored data. -
Page 59: Utilities Menu
UTILITIES menu UTILITIES Displays the Copy, Interface, Comment, Date or Config menu. Copy menu Selects a device or sets the output format (Style) and output destination setting (Source), etc. Example where Floppy is selected from Device in Copy menu Output device Menu Output format Output source... -
Page 60: Comment/Date/Config Menu, Self Cal/Auto Cal/Update Setting
Update Used to update the software. For details about how to update the setting software, see IWATSU’s home page. Cautions for use of Auto Cal • Auto Cal may be failed if a specific signal is input. • If Auto Cal is failed, perform Self Cal with all input signals disconnected. - Page 61 Memo...
-
Page 62: Section 2 Explanation Of Functions
Section 2 Explanation of Functions This section gives detailed explanations of functions. Page Waveform display Vertical axis Horizontal axis Triggering TV trigger ACQUISITION Peak detection (Peak Det) Average (Average) Equivalent sampling (EQU SMPL) Roll (ROLL) Sweep mode in Roll operation Persistence (PERSISTENCE) Memory length (Length) Interleave (Interleave) -
Page 63: Waveform Display
Waveform display There are four types of waveforms displayed on the screen: CH1/CH2/ CH3/CH4, REF1/REF2, Math1/Math2, and FFT. CH1, CH2 Displays sampling results of signals input to channels 1 to 4. CH3, CH4 Displayed waveforms can be expanded or reduced. waveforms CH1 to CH4 waveforms are also used as waveforms to be saved/recalled to an ATA card or floppy disk. -
Page 64: Vertical Axis
Vertical axis Probe Selects an attenuation ratio of the probe used by the probe setting in the CH1 to CH4 menu from 1:1, 10:1, 100:1 and 1000:1. setting Selecting Auto automatically recognizes the probe with a probe sense function (1/10, 1/100) and sets an attenuation ratio. When using the probe, set Auto. -
Page 65: Triggering
Triggering Specifies trigger count or trigger period (interval time setting), and EVENT generates valid trigger signal and acquires waveform only a specific trigger condition is satisfied. Selects Count, Burst, Extra or Missing as event type. Type setting Generates valid trigger signal every specified count of trigger signal. It Count is suitable for operation check of counter circuit. - Page 66 MISSING Automatically generates valid trigger signal when there is no trigger signal within specified time. The valid trigger is generated within 50ns after the interval time has passed from the last trigger. It allows waveform to be acquired when part of repetition signal is missing due to power interruption or data dropout.
-
Page 67: Tv Trigger
TV trigger Displays NTSC or PAL (SECAM). It generates trigger in the selected TV trigger field (Both, Odd, Even) or line. Type Selects field and horizontal synchronization. Both: Triggers by selecting a line number of horizontal sync signal from vertical odd field or even field. Odd: Triggers by selecting a line number of horizontal sync signal from vertical odd field. - Page 68 Example of measurement with line No. 24 of odd field (Odd) of NTSC signal Selecting any of Auto/Norm/Sngle allows stable observation of a TV signal. Specifies TV. Specifies Odd. Specifies line No. TV system and features System Line number Field frequency Video signal Country bandwidth...
-
Page 69: Acquisition
ACQUISITION Detects the Max. and Min. values that occur in a period twice longer Peak than the sampling period corresponding to the sweep time (see detection (Peak Det) appendixes 1 and 2) and alternately records the detected values in memory. The minimum time allowing detection of the Max. and Min. values is 5 ns (200M sample/s). -
Page 70: Average (Average)
Average Every capturing of an input signal averages data on the same time (Average) axis and displays the waveform. A verage Selecting Average shows the Count on the menu. Set an average count count (2, 4, 8, 16, 32, 64, 128 and 256) depending on the noise condition. (Count) The greater the count, the greater the effect of eliminating noise in the signal becomes, but processing takes more time. -
Page 71: Equivalent Sampling (Equ Smpl)
Equivalent Using equivalent sampling for a repetition signal can speed up effective sampling sampling rate than the maximum single-shot sampling rate. (EQU SMPL) Principle Every time waveform data is captured, the time tn (n=1, 2, 3,...) after trigger generation until data is sampled is measured and data is overwritten taking account of relative time relationship. -
Page 72: Roll (Roll)
Roll (ROLL) The acquired waveform is displayed in real time. Available sweep range is 100ms to 50s in Short memory length, 2s to 50s in Long memory length. When operating at slower sweep rate with roll mode off, the waveform is displayed on the screen after all waveform data has been captured up to the specified memory length, and so it is not possible to observe the phenomenon in real time. -
Page 73: Sweep Mode In Roll Operation
Sweep mode in Roll operation The setting of the sweep mode is performed by Sweep in the TRIGGER menu or with the AUTO/NORMAL/SGL button. The sweep mode setting is changed depending on whether the roll mode is OFF or ON. Roll operation Roll mode is OFF In roll mode... -
Page 74: Persistence (Persistence)
Persistence The acquired waveforms are overwritten infinitely on the screen. This (PERSIS- is convenient to continuously observe changes of a signal. TENCE) If the state is changed from STOP to RUN by pressing the RUN/STOP button, persistence operation is started and the screen is initialized when the first captured waveform is displayed. -
Page 75: Interleave
Interleave In the interleave mode, the normal sampling speed (200 MS/s) can be (Interleave) doubled to 400 MS/s. The interleave mode setting is that only the CH1 and CH3 waveforms are on. This interleave mode setting is automatically set according to the sweep range (see appendixes 1 and 2). Additionally, the memory length is the same as that in a mode other than the interleave mode. -
Page 76: Xy Display
XY display Allows observation of the phase difference between signals. XY1&2: Displays a waveform by expressing the horizontal direction XY1&2 (X) on the CH1 voltage axis and the vertical direction (Y) on the CH2 voltage axis. XY3&4: Displays a waveform by expressing the horizontal direction (X) on the CH3 voltage axis and the vertical direction (Y) on the CH4 voltage axis. -
Page 77: Calculated Waveform
Calculated Displays results of calculation between channels. waveform (Math) Performs the setting if Add, Sub, or Multi is selected from the Math menu. According to the setting, the following calculation waveform is displayed. When CH1&CH2 is selected. Add: Waveform that the CH1 waveform is added to the CH2 waveform. - Page 78 Multiplication Measurement example of multiplied waveform (CH1&CH2) (Mult) Mult Multiplying CH1 by CH2 waveform in the figure on the right. Used for power observation from a voltage waveform and current waveform, etc. Multiplications are performed according to the following expression: Mult = (CH1 waveform data −...
-
Page 79: Automatic Measurement (Measure)
Automatic measurement (MEASURE) Measurement Specifies the measurement area between H cursors. If no H cursors area are shown, the measurement area is the entire screen. The H cursors are displayed by pressing the ∆V/∆t/∆V&∆t/V at t/ OFF button and selecting ∆t of cursor measurement. (Likewise, the H cursors can also be displayed by selecting ∆V&∆t measurement.) Select ∆t for cursor measurement. - Page 80 Rise time (Tr) Measures rise time of waveform in the specified area. Measures fall time of waveform in the specified area. Fall time (Tf) Set the following parameters. 100% Upper Level (e.g. 90%) The point at which the waveform crosses This span is the level is indicated with a + mark.
- Page 81 Measures root square mean of waveforms in the specified area. Root square mean (Vrms) Mean value Measures mean value of waveforms in the specified area. Note that measured values of both Vrms and Vmean vary greatly (Vmean) depending on the setting of measurement interval. There are no measurement parameters (no + mark is displayed either).
- Page 82 +Pulse width Measures + pulse width of waveform in the specified area. (+PW) Measures − pulse width of waveform in the specified area. − − − − − Pulse width (− − − − − PW) Measures the ratio of waveform period to + pulse width in the specified Duty ratio (Duty) area.
- Page 83 Top value (Top) Measures top value of waveform in the specified area. Measures base value of waveform in the specified area. Base value (Base) Measures difference between top value and base value of waveform Top/Base value in the specified area. There is no measurement parameter (no + mark (T-B) either).
- Page 84 Skew Measures time difference between rising (falling) edge of the selected waveform and rising (falling) edge of the selected waveform in the (SKEW) specified area. The level of the measurement point is relatively specified CH1-CH2 by the ratio to the amplitude. When specifying (or setting) the level of (Skew12) the measurement point by the absolute voltage, ∆t measurement must CH3-CH4...
- Page 85 2. Describe the function of Added Auto Measurements (MEASURE) Integration (Area) The integration of the waveform in the measurement interval is measured. The integration is measured based on the reference of the channel to be measured. (The integration measurement is performed for the actually taken data and is not performed for the interpolation data.) Example of measurement : In this example, the integration values =S1 + S2 + S3 + S4 + S5 + S6 of the CH1...
- Page 86 r.m.s. value of integer cycles (CVrms) In the measurement interval, cycles passing through the level set by the auto measurement parameter (Level) are found. The r.m.s. value of these integer cycles is measured. Mean value of integer cycles (CVmean) In the measurement interval, cycles passing through the level set by the auto measurement parameter (Level) are found.
- Page 87 +Overshoot (+Oshot) In the measurement interval, a close point where 1st positive slope intersects with the auto measurement parameter (Level) is detected, and then + overshoot at this rise is measured. −Overshoot (−Oshot) In the measurement interval, a close point where 1st negative slope intersects with the auto measurement parameter (Level) is detected, and then −overshoot at this fall is measured.
- Page 88 Number of + pulses (+Pulse) The number of +pulses of the waveform in the measurement interval is measured. When the waveform level is passed from the upper portion to the lower portion after it has been passed from the lower portion to the upper portion based on the value set by the auto measurement parameter (Level), the count is incremented.
-
Page 89: Save/Recall/Delete
Save/recall/delete (SAVE/RECALL/DELETE) Also see Section 1 "SAVE/RECALL menu" (pages 36 to 39). Capacity Selecting DEVICE in the SAVE/RECALL menu shows the remaining display capacity of a medium. While Floppy or ATA Card is highlighted, the remaining capacity of the medium is displayed at the bottom of the screen. - Page 90 Saving waveform data to ATA card 1. Display SAVE/RECALL menu. 2. Through [FUNCTION operation], set Device to ATA card. 3. Through [FUNCTION operation], set Type to Waveform (waveform). 4. Through [FUNCTION operation], select Binary or ASCII as Style. When ASCII is selected, it is necessary to set Step. Subsequently, perform the same operation steps 4 to 6 as described for saving of the panel setting.
- Page 91 File count/size/storing time to a floppy disk With ASCII save, the YT waveform data is saved with voltage values, and therefore, when memory length is “Long”, cannot be saved onto a floppy disk unless Step (data decimation) is 4 or greater. (Data can be saved to an ATA card even when Step is 1.) With a floppy disk, ASCII waveform data can be saved with file numbers from 1 to 200.
-
Page 92: Utilities/Copy
Copy (COPY) A lso see Section 1 "Copy function" (page 24), "Built-in printer" (page 25) and "UTILITIES menu" (page 40) together. Outputs a hardcopy of the screen and panel setting to the built-in printer, floppy disk, ATA card and Centronics port. Source When Screen is selected When Panel is selected... - Page 93 Copy to floppy disk 1. Select Copy in the UTILITIES menu and display the copy menu. 2. Through [FUNCTION operation], set Device to Floppy. 3. Through [FUNCTION operation], set Type to TIFF (or BMP). 4. Through [FUNCTION operation], set Function to Copy. 5.
-
Page 94: Appendix 1
Appendix 1 Table 1 Sampling Period and On-Screen Data Count for Short Memory (4CHs are used.) Time axis (range) Sampling rate Sampling period On-screen data count 50 s/div 2 S/s 500 ms 1,000 words 20 s/div 5 S/s 200 ms 1,000 words 10 s/div 10 S/s... -
Page 95: Appendix 1
Appendix 1 Table 2 Sampling Period and On-Screen Data Count for Short Memory (Only CH1 and CH3 are used in the interleave mode.) Time axis (range) Sampling rate Sampling period On-screen data count 50 s/div 2 S/s 500 ms 1,000 words 20 s/div 5 S/s 200 ms... -
Page 96: Sampling Rate And Display Memory Length For Long Memory
Appendix 2 Table 3 Sampling Rate and Display Memory Length for Long Memory (4CHs are used.) Time axis (range) Sampling rate Sampling period On-screen data count 50 s/div 200 S/s 5 ms 100,000 words 20 s/div 500 S/s 2 ms 100,000 words 10 s/div 1 kS/s... - Page 97 Appendix 2 Table 4 Sampling Rate and Display Memory Length for Long Memory (Only CH1 and CH3 are used in the interleave mode.) Time axis (range) Sampling rate Sampling period On-screen data count 50 s/div 200 S/s 5 ms 100,000 words 20 s/div 500 S/s 2 ms...
-
Page 98: Appendix 3: Autoset Measuring Conditions
Appendix 3 AUTOSET measuring conditions VERTICAL Trace selection CH1 to CH4: Do not change the setting. VOLT/DIV When frequency is 50 Hz to 50 MHz 2 mV to 10 V/div and amplitude approx. 2 to 7 div Zoom Coupling DC or AC Offset 1 CH is displayed.: Near 0 div from center of... -
Page 99: Appendix 4:
Appendix 4 <Panel setting> to be saved All ACQUISITION menu items All DISPLAY menu items except Display and Status All MEASURE menu items All CH menu items All TRIG menu items Detailed menu trees ACQUISITION MEASURE (28,29) (32,33,58 62) DISPLAY TRIGGER (30,31,44) Other than...To Be Saved -
Page 100: Section 3 Daily Care
Section 3 Daily Care... -
Page 101: Maintenance Method
a. Maintenance method • Cleaning Disconnect the power cord before cleaning to prevent electric shock. Wipe off the dirt on the surface of the instrument and cover with a small volume of water or mild detergent. Use only recommended cleaning solvents; failure to comply could result in discoloration or damage. - Page 102 Automatic calibration is carried out under conditions shown below. Immediately after the power has been turned ON. 5 min. after the power has been turned ON. Ambient temperature changes approximately 5°. The measurement is stopped during automatic calibration. To carry out the continuous measurement, set Auto Cal to Off before starting the measurement.
-
Page 103: Diagnostic Guideline
i. Diagnostic guideline If this instrument does not work or some abnormality is suspected, check the descriptions in Table 1. Table 1 Diagnostic Guideline Symptom Check item Action Power switch turned Is the power cord connected to the Connect the power cord to ON but LCD does not AC receptacle? the AC receptacle. - Page 104 ATA card. Format in the SAVE/ RECALL menu. Is the ATA card the one Use the product recommended by Iwatsu? recommended by Iwatsu. See our homepage or contact your nearest our sales office. Paper jam of built-in...
- Page 105 How to restore the setting at time of purchase 1. Press the power switch to turn OFF the power. 2. While holding down the ACQUISITION button, press the power switch to turn ON the power. 3. “SHUT DOWN...” is displayed and the power is automatically turned OFF. 4.
-
Page 106: Section 4 Specifications
Section 4 Specifications... - Page 107 Display Form 5.8 inch diagonal LCD with high intensity backlight Color: blue 320 × 240 pixels (115.17 × 86.37 mm) Display resolution Display contrast Automatic adjustment function available (arbitrary setting also possible) Vertical section (Y axis) Specification common to CH1 through CH4 2 mV/div to 10 V/div (1-2-5 sequence), accuracy: ±2% Range DC to 100 MHz −3 dB...
- Page 108 Minimum trigger level Frequency CH1, CH2, CH3, CH4 DC to 10 MHz 0.5 div 10 MHz to 100 MHz 1.5 div TV Trigger TV system NTSC, PAL, (SECAM) Field selection Both, Odd, Even, TV-H (Specify the number of lines for Both, Odd and Even) Horizontal section (X axis) Sweep time 5 ns/div to 50 s/div (1-2-5 sequence)
- Page 109 Display Type Displays Y-T, X-Y in dedicated waveform display area (250×200 dots). X-Y display X: CH1, Y: CH2 fixed display X2: CH3, Y2: CH4 fixed display Interpolation Linear Expansion/reduction Vertical axis Expanded/reduced within voltage sensitivity setting range Zoom Voltage sensitivity setting continuously expanded up to ×2.5 Horizontal axis Expanded/reduced centered on the center of screen...
- Page 110 Interfacing RS-232C Baud rate 2.4 k, 4.8 k, 9.6 k, 19.2 k, 38.4 k, 57.6 k, 115.2 k Data bits 7 bits or 8 bits Parity None (fixed) Delimiter Select from LF or CR/LF GP-IB (Option) DS-539 GP-IB Cable Address 0 to 30 Delimiter LF, CR/LF...
- Page 111 Calibration signal output Waveform Square waveform 0.6 V ± 1% Output voltage 1 kHz ± 0.01% Frequency Other functions Auto setup With UNDO function Automatic calibration function Calibrates offset ranging from 2 to 5 mV/div. (It is possible to make this function invalid.) Self-calibration function Calibrates sensitivity, offset, trigger level.
- Page 112 EC Declaration of Conformity The product meets requirements of the EMC Directive, 89/336/EEC, Low Voltage Directive, 73/23/EEC for Prod- uct Safety. Low Voltage Directive EN61010-1:93+A2:95, Safety Requirements for electrical equipment for measure- ment, control and laboratory use. Do not operate in environments where conductive pollut- ants may be present.Installation Category CAT Ⅱ.
- Page 113 Memo...
-
Page 114: Section 5 Fft Computation
Section 5 FFT Computation... - Page 115 Overview • Power spectrum Indicates the signal power of each frequency component in dBm. dBm is referenced to 1mW and the equivalent voltage (0.316V peak/0.224Vrms) at a 50Ω load. • Display of time axis (YT/XY) waveform or frequency axis (FFT) waveform The display is switched to either the time axis (YT/XY) waveform or frequency axis (FFT) waveform of the selected trace (CH1 through CH4).
- Page 116 What is the FFT (Fast Fourier Transform) used for? Digital oscilloscopes normally display the signal under observation as waveform data in the time axis domain. By performing an FFT of this digital data, the signal under observation can be displayed in the frequency axis domain, similar to a spectrum analyzer.
- Page 117 Basic Edition FFT Menu Settings Procedure 1. Press the DISPLAY button and display menu will appear. Contrast 2. Turn the FUNCTION knob and select Math. Join 3. Press the FUNCTION knob to enable selection of the setting items. Setting items are displayed as highlighted text. Type 4.
- Page 118 Screen Description (1) FFT waveform display area. Displays FFT results and scale. (2) Horizontal axis and acquisition display area (Ex) 9.765MHz (×1) P:48.63MHz Smpl a : Horizontal axis sensitivity Hz/div b : Horizontal zoom (×1∼×10) c : Run/Stop state d : Position along horizontal axis (screen center) e : Acquisition mode f : Equal sampling g : Memory length Short/Long...
- Page 119 m : Trigger coupling n : Trigger level (5) Message status display area Displays the value of the vertical axis position when moved. Also, displays the selected status, temporary messages and warnings. The selected menu is displayed as highlighted text at the right edge. (6) Displays the 0dBm position of the FFT waveform as ‘_’.
- Page 120 FFT Menu Operation OFFSET Sets the vertical position of the waveform. (Units: dBm) The same operation can be performed by using either the CH1/CH2 or CH3/CH4 knobs. Pressing the knob causes a shift of 1div in the direction of the last movement. VOLT/DIV Sets the sensitivity of the waveform’s vertical axis to 1, 2, 5, 10, or 20dBm/div.
- Page 121 FFT data with Memory length “Short” All of the waveform data (1024 points) of the specified source are used for the FFT. • When the equal sampling (Equ) is Off, the time axis range is slower than 200 ns/div. • When the equal sampling (Equ) is On, the data is displayed on the screen as shown below in a time axis range other than 5 ns/div and 200 ns/div.
- Page 122 Lets take a measurement ! To correctly perform an FFT, the waveform must be appropriately displayed with the normal time axis (YT) display screen. Procedure (1) Connect the signal to be observed to the CH1 input. With Length from the DISPLAY menu set to Short, press the AUTOSET button to execute AUTOSET.
- Page 123 F-10 To appropriately perform a FFT, a window suitable for the data to be measured must be selected. (4) While the Display menu is being displayed, the FFT menu will be displayed if the FUNCTION knob is turned counter clockwise. From the F Window menu, select a window function (Hanning, Flat Top, Rectangular).
- Page 124 F-11 Cursor Measurement of the FFT Waveform The FFT waveform displayed in the FFT screen can be measured with the cursor. For the method of cursor operation, please refer to page 22. While the FFT screen is being displayed, the type of cursor measurement ∆V/∆t/∆V&∆t changes sequentially each time the button is pressed.
- Page 125 F-12 dBm at f Measurement When the ∆V/∆t/∆V&∆t/V at t/OFF button is pressed, the Cursors menu will be displayed. Press the ∆V/∆t/∆V&∆t/V at t/OFF button and set Type (type of measurement) dBm at f. Turn the FUNCTION knob and move the H-C1 cursor to the position were it is desired to learn the frequency and dBm value.
- Page 126 F-13 Saving the FFT Result The FFT result can be saved on a floppy disk or ATA card in CSV format. Saving the FFT Result to Floppy Disk Procedure Device Display the FFT result on the screen. Floppy Unless the FFT waveform is displayed on the screen, the Type FFT result cannot be saved.
- Page 127 F-14 FFT Waveform Data Saved as ASCII is Edited With Excel Data saved in the ASCII format cannot be called by this product, however, this data can be edited by using a software program such as Excel or Lotus on a nearby PC. In the example below, a saved file is opened with Excel, and Data (dBm) is displayed with the broken line graph of the graph wizard.
- Page 128 F-15 Applications 1. Fast Fourier Transform (FFT) Digital oscilloscopes normally display the signal under observation as waveform data in the time axis domain. By performing an FFT of this digital data, the signal under observation can be displayed in the frequency axis domain, similar to a spectrum analyzer. (change energy to power in graph below) With this product’s FFT, the power spectrum can be displayed.
- Page 129 F-16 Similarly, when performing an FFT, data containing frequency components higher than 1/2 the sampling rate (Nyquist frequency), aliasing will occur and the waveform will appear to have a lower frequency. With this product, the FFT sampling rate is displayed at the bottom of the screen during the FFT waveform display.
- Page 130 F-17 Procedure for FFT Process <Reference> → 1) Verify the signal band to analyze. 4. Frequency Range of FFT Waveform → 2) Determine the window function. 5. FFT Window Selection → 3) Determine the number of computation 6. F Points Selection and Effect points.
- Page 131 F-18 5. FFT Window Selection When a FFT is performed, data within the computation range is processed as continuous data. Therefore, unless an integral number of cycles of the input signal fit within the computation range, the time axis waveform will be discontinuous and the spectrum obtained by the FFT will spread out.
- Page 132 F-19 5.2 Hanning A Hanning window differs from a Rectangular window in that the signal can be analyzed without regard for waveform continuity at the front and rear of the computation range. Precision of the frequency increases, but amplitude errors may occur.
- Page 133 F-20 7. Computation Range for Memory Length Long In the case of a time axis range in which TIME/DIV is slower than 20 µs/div, data is selected for the FFT computation as shown below. Set the waveform to be measured in a range of approximately ±4div from the screen center.
- Page 134 F-21 8. Added Functions In this product, the following functions are added or changed compared to prior product versions. 8.1 Waveform Data Decimation and Save With this product, waveform data or FFT results can be decimated and saved in CSV format on a floppy disk or ATA card.
- Page 135 F-22 8.2 Waveform Data Decimation Function During Remote Control With this product, data can be decimated if the waveform data or FFT result is transferred to a PC via RS-232C or GP-IB (option). For details, refer to the DTSTEP command in the Command List section. 8.3 Saving Voltage Value of ASCII Save With this product, when saving the YT waveform data in CSV format on a floppy disk or ATA card, it can be saved with the voltage value (units: Volts).
- Page 136 F-23 Memory length With ASCII save, the YT waveform data is saved with voltage values, and therefore, when memory length is “Long”, cannot be saved onto a floppy disk unless Step (data decimation) is 2 or greater. (Data can be saved to an ATA card even when Step is 1.) With a floppy disk, ASCII waveform data can be saved with file numbers from 1 to 200.
- Page 137 Memo...
-
Page 138: Index
Index Buttons and Knobs Auto ......... 20, 45, 47 [AUTO/NORM /SGL] button ....6 Auto Copy ........53, 73 [AUTOSET] button ........ 7 Auto measurement menu ..... 32, 33 [C1/C2/TCK] button ....... 6 Auto Save ........... 39 [CH1/CH2 MENU] button ...... 6 AUTO/NORM/SGL ...... - Page 139 FUNCTION ........5, 6, 22 Date ........10, 31, 41 DC ..........15, 19 DEFAULT ..........11 GND ........8, 9, 14, 15 Delay ..........16, 45 Grid ..........5, 31 Delete ..........39, 70 Device ..........73 Directory ..........73 H cursor ..........
- Page 140 Measurement area ......60 REF CLEAR ........27 Memory length ........17 REF SAVE ........... 27 Minimum value (-PEAK) ...... 62 Reference ........... 44 Missing .......... 46, 47 Reference waveform ..... 27, 60 Mult ..........31, 59 Reference waveform display ....57 Resolution ...........
- Page 141 Sub ..........31, 58 Sweep Mode ......8, 20, 54 Waveform ..........71 Sweep time TIME/DIV ..... 8, 45 Waveform display (non-display) ..44 Tf ............61 XY ..........30, 53 TIFF ............. 73 TIME/DIV ........16, 21 Top-Base ..........61 ZERO DELAY ........
Need help?
Do you have a question about the DS-8814 and is the answer not in the manual?
Questions and answers