Table of Contents
Advertisement
Advertisement
Table of Contents

Related Manuals for GE Optica


Summary of Contents for GE Optica
- Page 1 Sensing Optica General Eastern Dew Point Analyzer Operator’s Manual...
-
Page 2: January
Sensing Optica General Eastern Dew Point Analyzer Operator’s Manual A40238752C January 2006 The Optica Dew Point Analyzer is a General Eastern Instruments product. General Eastern Instruments has joined other GE high-technology sensing businesses under a new name—GE Sensing. - Page 3 1. Notify GE Infrastructure Sensing, giving full details of the problem, and provide the model number and serial number of the instrument. If the nature of the problem indicates the need for factory service, GE Infrastructure Sensing will issue a RETURN AUTHORIZATION number (RA), and shipping instructions for the return of the instrument to a service center will be provided.
-
Page 4: Table Of Contents
January 2006 Table of Contents Chapter 1: Features and Capabilities Introduction................1-1 Electronics Enclosure . - Page 5 January 2006 Table of Contents (cont.) Chapter 2: Installation Introduction ................2-1 Benchtop Installation.
- Page 6 Operating the VGA Optica........
- Page 7 Table of Contents (cont.) Chapter 4: Programming the VGA Optica Introduction ................4-1 Programming Fundamentals .
- Page 8 Table of Contents (cont.) Chapter 5: Programming the 4x40 Optica Introduction................5-1 Programming Technique.
- Page 9 Programming Automatic Balance for a 4x40 Optica ........
- Page 10 4X40 Optica Configuration ........
- Page 11 Chapter 1...
- Page 12 Features and Capabilities Introduction........... . 1-1 Electronics Enclosure .
-
Page 13: Chapter 1: Features And Capabilities
• moisture content from 500 ppb to over 5.71 × 10 The Optica also measures and displays gas pressure using a GE Infrastructure Sensing PT-30A or PT-300A pressure sensor, or a user-supplied 4–20mA or 0–5 VDC pressure sensor. Note: If the pressure is known to be constant, a fixed pressure can be programmed, eliminating the need for a pressure sensor. -
Page 14: Electronics Enclosure
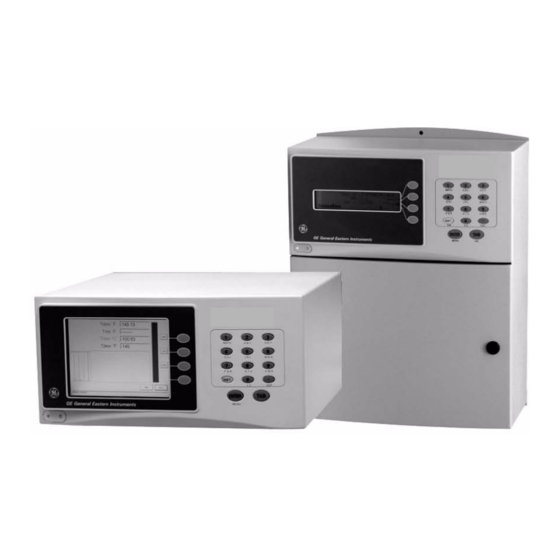
• a wall-mount unit, housed in a NEMA-4 enclosure, suitable for industrial environments See Chapter 2, Installation, for details on how to mount the Optica. Front Panel The Optica’s front panel is shown in Figure 1-1 below. The panel includes: a display, an alphanumeric keypad for data entry, ENTER and TAB keys, and four softkeys to the right of the display screen. -
Page 15: Input/Output Capability
Standards and Technology (Certificate of Conformance) System Planning The Optica can be used for a wide variety of measurement applications, including the measurement of dew points of gasses that are at pressures that exceed the measurement range of GEI’s sensors. -
Page 16: Dew Point Sensors
Hygrometer Function Figure 1-2 on page 1-5 illustrates how GE Infrastructure Sensing hygrometers detect and measure dew point. The condensate mirror is illuminated with a high-intensity, solid state, light emitting diode (LED). -
Page 17: Hygrometer Calibration
January 2006 Hygrometer Calibration The Optica unit can be sent to the National Institute of Standards and Technology (NIST) in Gaithersburg, Maryland for certification or to any National Standards lab for calibration against their primary humidity standards. A calibrated instrument can then be used as a transfer standard in local laboratories to calibrate lower echelon instruments. -
Page 18: Other Hygrometer Applications
Contaminant Error Reduction) that is very effective in reducing the Raoult Effect error associated with soluble contaminants, particularly for near-ambient dew points. The Optica is equipped with the PACER cycle as well as AUTO balance as found on earlier models. The user can choose which self-cleaning and balancing routine to run depending on the severity of contamination. - Page 19 January 2006 The PACER Cycle (cont.) Figure 1-3: A Typical PACER Cycle This excess water easily dissolves any water-soluble contaminants. The mirror is then heated. During the heating phase, the large puddles of water gradually evaporate, carrying increasingly heavy concentrations of salts as the puddles become smaller. Finally, when all the puddles have evaporated, dry “islands”...
- Page 20 Chapter 2...
- Page 21 Installation Introduction........... . 2-1 Benchtop Installation .
-
Page 22: Chapter 2: Installation
January 2006 Introduction This chapter explains the installation of the benchtop and wall-mount versions of the Optica, the various sensors used with the system, and the I/O and power wiring. Benchtop Installation Mounting the Benchtop The Optica benchtop dimensions are shown in Figure 2-1 below. Two feet on the bottom of the case can be unfolded to raise up the front for easier viewing, if desired. -
Page 23: Using The Rack Mounting Option
19-inch rack (see Figure 2-2 below, Figure 2-3 on page 2-3, and Figure 2-4 on page 2-4). The two brackets are attached to the front panel using four No. 8 screws. The Optica is mounted to the brackets using the eight mounting holes located just in front of and behind the unit’s feet. - Page 24 January 2006 Figure 2-3: Optica Rack-Mount Adapter - Front Panel Installation...
- Page 25 January 2006 Figure 2-4: Optica Rack-Mount Adapter - Bracket Installation...
-
Page 26: Wiring The Benchtop
Wiring the Benchtop Input Power The Optica operates with input power from 90 to 126 VAC at 4 amps, or from 208 to 252 VAC at 2.5 amps. It is designed for a nominal 100, 115 or 230 VAC source. A switch on the rear panel selects the appropriate voltage range (see Figure 2-5 below): •... -
Page 27: Wall-Mount Installation
January 2006 Wall-Mount Installation The Optica Wall-Mount unit is designed to mount on a flat, vertical surface, such as a wall or panel. To mount the wall-mount version, see Figure 2-6 and Figure 2-7 below. Mounting the Wall-Mount Figure 2-6: Optica Wall-Mount Dimenisons Ø.261 (6.63 mm) -
Page 28: Wiring The Wall-Mount
January 2006 Wiring the Wall-Mount All connections to the wall-mount unit are made through the panel at the bottom of the case as shown in Figure 2-8 below. Any I/O cabling is brought into the unit through a gland at the lower left of the case and connects to the terminal blocks on the left side of the case. -
Page 29: Output Wiring
Figure 2-11 below shows the Slot A connections. The Wall-Mount Optica input/output terminal blocks are located inside the front door as shown in Figure 2-8 on page 2-7. Cabling is brought in through the gland on the bottom of the unit and wired to the terminal blocks shown in Figure 2-11 below. -
Page 30: Analog Outputs
January 2006 Analog Outputs Note: When the Optica is being programmed, the analog outputs provide 4–20mA and 0–5 VDC signals representing the designated parameters. • For 4–20mA output, connect to terminals labelled 4–20 (+) and RTN (–). Note: The maximum load allowed for current output is 500 Ohms. -
Page 31: Alarm Outputs
January 2006 Additional Voltage Outputs It is possible to use either of the analog current outputs as an additional voltage output by connecting a precision resistor from the current output to its return. A voltage will be produced equal to the output current times the load resistance. - Page 32 January 2006 Set Point Alarm For the Set Point alarm type, the alarm band provides hysteresis to prevent frequent operation of the alarm relay when the parameter is near the specified value. The relay is activated when the parameter exceeds the upper limit, and deactivated when the parameter goes below the lower limit.
-
Page 33: Serial Output
For a basic interface without handshaking, only pins 2, 3 and 5 (RX, TX and GND) on the Optica connector are needed. Pin connections are given for both 25-pin and 9-pin devices. -
Page 34: Sampling Lines
January 2006 Sensor Information When selecting a location for installing a sensor, consider the following criteria: (cont.) • Locate the sensor as close as is practical to the source of the gas to be measured, to keep the sampling lines as short as possible. This minimizes the system response time and reduces the error rate at low frost points due to sample line outgassing. -
Page 35: Ensuring Heat Transfer
Some sensors can be mounted on a liquid heat exchanger, or a temperature-controlled electric hot plate, or installed in a heated enclosure. GE Infrastructure Sensing recommends closed- loop active control of the elevated sensor body temperature. The sensor base should be coated with zinc-oxide-filled silicone thermal grease and securely anchored to the heat sink with suitable fasteners. -
Page 36: Filter Requirements
January 2006 Filter Requirements If the gas to be monitored is free from particulates and hydrocarbon liquids or vapor, filtering is not necessary. However, most sample gas streams contain some particulates, and using a filter reduces the need for frequent mirror cleaning. On the other hand, filtering tends to slow the system’s response, particularly at low frost points. -
Page 37: Sensor Installation
January 2006 Sensor Installation This section provides installation details for the GE Infrastructure Sensing line of chilled-mirror humidity sensors. Model 1111H Sensor The Model 1111H is an open-type sensor (see Figure 2-15 below). It can be threaded into standard pipe fittings or mounted in a type 0111D pressure boss, which encloses it and adapts it for ¼-inch... -
Page 38: Model 1311Dr Sensor
January 2006 Model 1311DR Sensor The 1311DR is a stainless steel, liquid cooled, four-stage sensor suitable for measuring dew points between –75°C and +25°C. Mount the 1311DR sensor so that the air inlet and exhaust openings are free from obstruction (see Figure 2-17 below). If the sensor is liquid cooled, vertical wall mounting is recommended, observing the “UP”... -
Page 39: Model 1311Xr Sensor
January 2006 Model 1311XR Sensor The 1311XR is a stainless steel, water cooled, five-stage sensor (see Figure 2-18 below) that can measure frost points as low as –80°C. The sample gas flow rate should be between 1 and 5 ft3/h. The maximum permissible coolant temperature is +50°C;... - Page 40 When set to AUTO, the system operates fully automatically, controlling the heat pump in response to any dew/frost point within its operating range. In AUTO mode, the controller senses the current supplied by the Optica to the top two stages of the AUTO thermoelectric coolers.
-
Page 41: Model Sim-12H Heated Sensor And Components
January 2006 Purging the Sensor Caution! The 1311XR must be purged after each use, either with the sample gas after measuring it, or with another dry gas source. Otherwise, condensation inside the sensor housing may cause corrosion and eventual failure of the thermoelectric coolers. -
Page 42: Connecting The Sensors
Connecting the Sensors Dew point, temperature and pressure sensors provided by GE Infrastructure Sensing for the Optica monitor are pre-wired with connectors installed. Plug these connectors into their corresponding sockets as shown in Figure 2-5 on page 2-5 for the benchtop unit, or Figure 2-8 on page 2-7 for the wall-mount unit. - Page 43 Chapter 3...
- Page 44 Operating the 4x40 Optica........
-
Page 45: Chapter 3: Operation
Details are given in Chapter 7, Maintenance. Normal Operation Normal operation of the Optica is very simple. To turn the unit on, check that the main power switch on the rear of the benchtop unit is set to ON (—), then press the right-hand side of the power switch (located at the lower left corner on the front of the unit). -
Page 46: Operating The Vga Optica
January 2006 Operating the VGA The parameters chosen during programming are displayed Optica numerically in the top half of the screen, and graphically at the bottom (see Figure 3-1 below). To program the unit, see Chapter 4. A balance indicator is shown as a vertical bar on the right side of the screen. -
Page 47: Operating The 4X40 Optica
Figure 3-3: Possible Balance Indicator Displays Network Operation The VGA Optica can be operated and programmed remotely over a network. Networked operation is very similar to operation using the front panel. For programming from a network, see Chapter 6. A typical network screen is shown in Figure 3-4 below. -
Page 48: Process Pressure
January 2006 Process Pressure The Optica provides several ways of measuring or specifying sample gas pressure (needed for pressurized humidity measurements). You can: • actively measure the pressure at the dew point sensor, or • manually enter the pressure, if it is known and stable, or •... -
Page 49: Scenario 1: Measurement Without Enabling The Process Pressure Feature
Measuring Vapor Pressure To measure vapor pressure with a 4-20 mA, 0-30 psia pressure sensor, With a Pressure Sensor connect the sensor to the Optica’s terminal block and make the following entries in the Pressure Input menu: • Input: Iin 4-20 •... -
Page 50: Scenario 2: Measurement Requiring The Process Pressure Feature
Optica’s Process Pressure feature (see Figure 3-6 below). Figure 3-6: Measurement Scenario 2... - Page 51 = 0.1283 mbar Per Dalton’s Law of Partial Pressure: e1 = (P2/P1) × e2 = (500/14.7) × 0.1283 = 4.36 mbar Using standard vapor pressure equations, the actual pressurized dew point is calculated by the Optica to be: Tdew1 = –4.022°C Operation...
-
Page 52: Status Line Indications
January 2006 Status Line Indications The status line at the bottom of the display shows whether the unit is ready for normal operation, or is still in its start-up phase, or needs service. The following is a complete list of status indications: Table 3-1: Status Indications Indication Meaning... -
Page 53: Factory Default Settings
January 2006 Factory Default Settings As shipped from the factory, the Optica is normally programmed with the configuration shown in Table 3-2 below. Table 3-2: Factory Default Values Function Setting Analog Output A Humidity, Units: Tdew °C, Range: –40°C to +60°C Analog Output B Temperature, Units: Tmp °C, Range: 0 to 100°C... -
Page 54: Sensor Balancing
The interval and type of balance are configurable as described in chapters on Optica programming. If the Service indicator is displayed after a balance operation, the sensor may need to be adjusted (see Balancing the Sensor Optics on page 7-2). -
Page 55: Supercooled Dew Points
January 2006 Supercooled Dew Points Slightly below the freezing point, water can exist in a supercooled liquid state for extended periods of time. Extra care may be needed when making measurements in the frost point region of 0 to –20°C, because the mirror temperature may temporarily stabilize at the supercooled dew point, 0.5 to 1°C below the actual frost point. - Page 56 January 2006 Water-Soluble Contaminants which readily dissolve in water, such as naturally Contaminants occurring salts, are detrimental to accurate vapor concentration measurement by any condensation method. These materials readily go into solution with the water condensate on the mirror surface, and then reduce the vapor pressure in accordance with Raoult’s Law.
-
Page 57: Mirror Flooding
The sensor location and hookup arrangement can influence the pressure. When the pressure at the sensor is different from the process pressure, the Optica can perform a conversion from the measured pressure to the desired process pressure (see Process Pressure on page 3-4 for details). - Page 58 Chapter 4...
- Page 59 Programming the VGA Optica Introduction........... . 4-1 Programming Fundamentals.
-
Page 60: Chapter 4: Programming The Vga Optica
January 2006 Introduction The Optica is programmed at the factory to display and output the data required for many applications (see Table 3-2 on page 3-9). In these cases, no further programming is required. By programming the Optica, the following categories of data can be customized for your application: •... -
Page 61: The Keys
January 2006 The Keys The following keys on the Optica’s front panel are used for programming: • ENTER Performs the function shown on a selected control button. • TAB Moves cursor to the next field or control button to select it. - Page 62 TAB to move to the next field. Figure 4-2 below shows a drop-down entry box, with the GrphColor (Graph Color) field selected and ready for choosing the desired color using the UP and DOWN arrow softkeys. Figure 4-2: Typical Drop-Down Box Programming the VGA Optica...
-
Page 63: Units Of Measure
In some applications an output may be needed that is not a simple function of a single parameter, but a combination of two or three. One or more user equations can be defined within the Optica to calculate new parameters that meet the application’s requirements. The equation can be formed from following elements: •... - Page 64 Dynes/cm2 BTU/lb(0) User Equation 1 BTU/lb(32) User Equation 2 pw(mbar) User Equation 3 The equation 2 × Tdew °F + (%RH / Twet°C) would be entered as 2 × A1 + (A2 / A3) Programming the VGA Optica...
-
Page 65: Menu 1
Choose the units for this parameter for the parameter chosen) Set the parameter value that will produce full-scale Upper Limit (Enter a number) output Set the parameter value that will produce zero Lower Limit (Enter a number) output Programming the VGA Optica... -
Page 66: Pressure Input
Enter a process pressure when it is different from the pressure at the dew point sensor (see page 3-4). Status Set whether the process pressure is active (enabled). Enable/Disable Pressure Enter the process pressure, if this feature is enabled. (Enter a number.) Programming the VGA Optica... -
Page 67: Alarms
• Outer band: alarm activates when parameter is outside upper and lower limits. • Control: alarm activates when Optica is actively controlling mirror temperature. • Service: alarm activates when Service indicator is activated. • PACER: alarm activates when PACER balance is active. -
Page 68: Automatic Cleaning And Balance Function
To program the Automatic Cleaning & Balance Function on the Optica VGA monitor: 1. Make sure the internal clock of the Optica has the correct time. a. From the main screen enter Menu, then More, then Set Time and Date. - Page 69 IMPORTANT: For environments or a gas sample where the mirror accumulates contamination rapidly, the use of an inline filter is recommended. Lower flow rates will also reduce the accumulation of contaminants. 4-10 Programming the VGA Optica...
-
Page 70: Data Fields
The number of decimal places for the numeric dis- Enter a number (6 maximum). play Buzzer/Sound Table 4-8: Buzzer/Sound Option Item Function Available Options Buzzer/Sound Sets the length (apparent loudness) of keyclick Enter length of keyclick sound sounds. in msec (150 msec maximum). Programming the VGA Optica 4-11... -
Page 71: Network Menu
Table 4-9: Network Settings Options Item Function Available Options Host Name Enter the host name for the Optica unit of the LAN. Domain Enter the Domain name for the local network. IP Address Use the left and right arrow keys to select between... -
Page 72: Datalog
January 2006 Datalog Enter parameters for automatically logging data within the Optica. This menu is accessed by selecting the Data Log control button on Menu 1 and pressing ENTER. Figure 4-5: Datalog Menu The large window below the center of the screen shows a list of parameters chosen for logging. -
Page 73: Download Screen
If logging is in progress at midnight, a new file is automatically started at that time. To view or output the logged data, select the Download control button and press ENTER. The Optica will display the Download screen, described below. -
Page 74: Menu 2
January 2006 Menu 2 Menu 2 is shown in below. This menu is accessed by selecting More on Menu 1, and pressing ENTER. Figure 4-7: Menu 2 Programming the VGA Optica 4-15... -
Page 75: General
Enter the test label for the selected equation. Enter an alphanumeric name. Using the keypad, enter the Enter the user equation (see User Equations on alphanumeric codes for the Equation page 4-4). equation elements, shown in Table 4-2 on page 4-5. 4-16 Programming the VGA Optica... -
Page 76: Communication Parameters
Table 4-2 on page 4-5. For example A0 has units Tdew °C, so the 0 requests Tdew °C. $GETSTATUS < > Returns a string of 1s and 0s corresponding to PACER, Service, Control, Heat, Cool, Alarm 1, Alarm 2 Programming the VGA Optica 4-17... -
Page 77: Serial Output Data
Select button and press ENTER. decimals designated. Control button to remove from the output list the REMOVE parameter selected at the top of the serial output Select button and press ENTER button menu. 4-18 Programming the VGA Optica... -
Page 78: Set Time & Date
The Time and Date menu is accessed by selecting Set Time and Date on Menu 2, and pressing ENTER. To set the Optica’s internal clock, press TAB to select each field of the date and time, and press the up and down softkeys to set each field. -
Page 79: Saving Configuration Files
3. To load or delete an existing configuration file, highlight the name under Load Configuration File and click LOAD or DELETE as desired. 4. To exit the Configuration screen click OK. Figure 4-9: Configuration Screen 4-20 Programming the VGA Optica... - Page 80 Chapter 5...
-
Page 81: Chapter 5: Programming The 4X40 Optica
Programming the 4x40 Optica Introduction........... . 5-1 Programming Technique . -
Page 82: Introduction
January 2006 Introduction The 4x40 Optica can be easily programmed to choose the data to be displayed, the data to be output on the analog or serial outputs, and the alarm settings. A typical data display is shown in Figure 5-1 below: Tdew °... -
Page 83: Programming Technique
5. After choosing a value for a setting, press ENTER to lock it in. Or, you can press the LEFT key to cancel the entry (restoring the original value) and return to choose another setting. To return to the function choice, press the LEFT key. Programming the 4x40 Optica... - Page 84 Press "left" softkey (<<<<) to cancel and/or return to previous position. Down Communication >>>> Serial Mode Parameters Down DOWN >>>> Serial Output Baud 1200 Units DOWN Down DOWN ENTER Baud rate DOWN Parity DOWN DOWN Figure 5-3: Programming the 4x40 Optica Programming the 4x40 Optica...
-
Page 85: Programmable Functions
Set the number of stop bits as required Number of Stop Bits 1, 1.5 or 2 by the receiving device. Set the flow control as required by the Serial Flow Control None, Software, Hardware receiving device. Programming the 4x40 Optica... -
Page 86: Serial Output Units
Enter a number. (for Serial Mode: All). Output dew point sensor status with Show Status* each data string (Heat, Cool, Balance, Enabled/Disabled PACER, Service, Alarm 1, Alarm2). Output date and time with each data Time Stamp Enabled/Disabled string. Programming the 4x40 Optica... -
Page 87: Alarms
• Outer band: Alarm activates when parameter is outside upper and lower limits. • Control: Alarm activates when the Optica is actively controlling mirror temperature. • Service: Alarm activates when the Service indicator is activated. • PACER: Alarm activates when the PACER balance is active. -
Page 88: Data Fields
Input Default Enter a number. measured input is disabled. Process Pressure Set whether the process pressure is Enabled/Disabled Default active (enabled) (see page 3-4). Enter the process pressure (if this Process Pressure Enabled/Disabled feature is enabled). Programming the 4x40 Optica... -
Page 89: Automatic Cleaning And Balance Function
To program the Automatic Cleaning & Balance Function on the Optica 4X40 monitor: 1. Make sure the internal clock of the Optica has the correct time. From the main screen: a. Press the ENTER key. b. Press the DOWN soft key until Set Time and Date is displayed. - Page 90 When heated, some of the contaminants are flash evaporated and the remaining residue accumulates in clusters, resulting in the cleaning of much of the mirror’s surface. The PACER cycle generally takes longer to complete. Programming the 4x40 Optica...
- Page 91 If Hold is selected, the last prevailing dew point, measured before the balance cycle was initiated, will be transmitted during the time that the balance cycle is running. 8. Power down and restart the Optica 4x40 display analyzer for the settings to take effect. IMPORTANT:...
-
Page 92: Buzzer And Sounds
Enter or edit equation 1 using the Edit Equation #1* equation elements shown in Table 4-2 See Table 4-2 on page 4-5. on page 4-5. *The equation number shown is the one chosen in “Select Equation.” Programming the 4x40 Optica 5-11... -
Page 93: Set Time And Date
Setting Description Available Options Restore settings to factory defaults Restore Defaults NO, YES shown in Table 3-2 on page 3-9. Factory Calibrations Table 5-16: Factory Calibration Options Setting Description Available Options For factory use only. 5-12 Programming the 4x40 Optica... - Page 94 Chapter 6...
-
Page 95: Chapter 6: Network-Based Programming
Network-Based Programming Introduction........... . 6-1 Programming Screens. -
Page 96: Introduction
Environment (JRE) obtained from the GE Infrastructure Sensing distribution CD or Sun’s website. If the Sun JRE is not installed on a machine that connects to Optica via Ethernet, a web page will direct the user to Sun’s website. To set up the Optica’s networking configuration, see Chapter 4 for programming using the Optica’s VGA programming method, and... - Page 97 January 2006 Programming Screens Click on Menu to display the Data programming screen: (cont.) Figure 6-2: Data Programming Screen Press More... to display the Other Options screen. Figure 6-3: Typical Main Data Screen Network-Based Programming...
- Page 98 January 2006 Programming Screens Press Display from the main data screen to configure the Main Display screen. (cont.) Figure 6-4: Main Display Screen Network-Based Programming...
- Page 99 Chapter 7...
- Page 100 Maintenance Minor Maintenance of Sensor Optics......7-1 Field Replacement of Sensor Mirrors ......7-4 Test and Calibration .
-
Page 101: Minor Maintenance Of Sensor Optics
3. Open the sensor by removing the sensor cover. 4. Moisten a cotton swab with a cleaning solution suitable for mirrors, such as the cleaning solution in the GE Infrastructure Sensing maintenance kit, or dilute methanol or alcohol. Clean the mirror with a few light wipes. -
Page 102: Balancing The Sensor Optics
January 2006 Balancing the Sensor If the Service indicator reappears after a PACER cycle (even after Optics performing the mirror cleaning procedure above) check the sensor balance adjustment. Improper adjustment of the optical balance is the most common cause of instrument malfunction. In addition, new systems may require an optical balance adjustment after one or two months of operation. - Page 103 5. Initiate a PACER cycle by pressing the PACER button on the Optica panel. At the completion of the PACER cycle, the system is properly balanced. For more information on the PACER cycle, see The PACER Cycle on page 1-6.
-
Page 104: Field Replacement Of Sensor Mirrors
January 2006 Field Replacement of One advantage of using a GE Infrastructure Sensing chilled mirror Sensor Mirrors dew point sensor is that the mirror is user-replaceable. The sensor does not have to be returned to the factory for replacement of the reflective surface, unless that is desired. -
Page 105: Replacing The Sensor Mirror
Required equipment: torque driver, set to 20-30 inch-ounces of Mirror torque. GE Infrastructure Sensing type TW-1 is recommended. The kit supplied by the factory contains the replacement mirror, a container of white thermal compound for proper heat transfer, and (in some models) a mylar washer that is to be placed under the mirror. -
Page 106: Test And Calibration
January 2006 Test and Calibration The procedures in this section effectively test and/or calibrate the following aspects of the Optica: • Startup and power supply voltage • Normal sensor operation • Front panel display • Digital and analog outputs. The unit has been completely tested and calibrated at the factory, and is ready to plug in and operate. -
Page 107: Incorrect Dew Point Display
Wire the decade box to the unit’s sensor connector as shown in Figure 25, and verify that the resistance settings shown in the table produce the temperatures shown. Optica 1123HK Sensor Cable... -
Page 108: Balance" Remains On The Status Line
January 2006 “Balance” Remains on the When the word Balance remains displayed on the front panel for Status Line more than 15 minutes, the instrument has not recovered from a PACER cycle. Check that the sensor and sensor cable are connected. If necessary, connect them, and the unit will complete the PACER cycle after a short time (5 to 15 minutes). - Page 109 Appendix A...
- Page 110 Specifications Performance ........... A-1 Functionality .
-
Page 111: Performance
January 2006 Performance Accuracy [complete system at 25°C (77°F)] Dew/Frost Point: ± 0.2°C (± 0.36°F) Temperature (optional): ± 0.15°C (± .27°F) Pressure (optional): ± 0.5% of full scale Relative Humidity (optional): Governed by accuracy of dew point and temperature sensors Other Humidity Parameters: Governed by accuracy of dew point, temperature and pressure sensors (optional) -
Page 112: Functionality
January 2006 Functionality Outputs 4–20mA DC, 500 Ohm maximum load, 0–5 VDC, 5mA maximum Digital Output Serial port Alarms Relay (optional): Form C (SPDT) 5A, 250 VAC (resistive load) Displays 640 X 480 pixel color LCD or 4-line X 40-char LCD Power 100, 115 or 230 VAC (+/-10%), 50-60 Hz Operating ranges... -
Page 113: Optional Accessories
January 2006 Optional Accessories 19" rack mount adapter T-100E Temperature sensor PT-30A Pressure transducer (0 – 30 psia) PT-300A Pressure transducer (0 – 300 psia) Specifications subject to change without notice. Specifications... - Page 114 Appendix B...
-
Page 115: Appendix B: Humidity Equations And Conversion Chart
Humidity Equations and Conversion Chart Introduction........... . B-1 Vapor Pressure . -
Page 116: Introduction
January 2006 Introduction The following symbols appear in the equations below: e = Vapor Pressure, millibars = Vapor Pressure with respect to ice, millibars = Vapor Pressure with respect to water, millibars = Saturation vapor pressure, ice, millibars = Saturation vapor pressure, water, millibars P = Total Pressure, millibars T = Temperature, °C = Ambient temperature, °C... -
Page 117: Humidity
January 2006 Humidity Relative Humidity is defined as the ratio of the water vapor pressure (e) to the saturation vapor pressure (e ) at the prevailing ambient or dry bulb temperature (Ta): ⎛ ⎞ (B-3) ---- - ------------------- - ⎝ ⎠... - Page 118 January 2006 Figure B-1: Graphical Humidity Conversion Chart Humidity Equations and Conversion Chart...
- Page 119 Appendix C...
-
Page 120: Appendix C: Configuring The Serial Interface
Configuring the Serial Interface Wiring to a Personal Computer......C-1... -
Page 121: Wiring To A Personal Computer
2 - Transmitted data (TXD) • 3 - Received data (RXD) • 5 - Signal ground (GND) To send the output of the Optica to a personal computer, use the cable arrangement shown in Figure C-1 below. Optica 9-Pin Male 9-Pin... - Page 122 Appendix D...
- Page 123 Comparing Optica Models ........
-
Page 124: Introduction
Many of these features were pioneered by GE Infrastructure Sensing, and are available only on GE Infrastructure Sensing products. A chilled mirror sensor is generally selected so that its depression capability will allow it to measure the lowest dew/frost point anticipated for the application. -
Page 125: Measurement Range
January 2006 Measurement Range The measurement range of a chilled mirror sensor is defined as the temperature range over which a stable dew or frost layer can be maintained on the mirror. Note that in order to acquire a dew or frost layer on the mirror, the depression capability of a sensor must extend below its measurement range. -
Page 126: Comparing Optica Models
January 2006 Comparing Optica Models Table D-1: Chilled Mirror Sensor Comparison Chart Model Model Model Model Model 111H SIM-12H 1311DR 1311XR System Performance Standard Accuracy* 0.2°C 0.2°C 0.2°C 0.2°C 0.15°C Optical Accuracy* 0.15°C 0.15°C 0.15°C 0.15°C Cooling Stages 95°C, air;... - Page 127 Appendix E...
-
Page 128: Appendix E: Glossary
Glossary... - Page 129 The temperature difference by which the chilled mirror can be lowered from the ambient temperature. Network A Local Area computer Network (LAN) or Wide Area Network (WAN) such as the Internet. The Optica can be operated or programmed remotely over a network. PACER GE Infrastructure Sensing patented Programmable Automatic...
- Page 130 Appendix F...
-
Page 131: Appendix F: Automatic Balance (For Earlier Software Versions)
Automatic Balance (for earlier software versions) Programming Automatic Balance for a VGA Optica...F-1 Programming Automatic Balance for a 4x40 Optica...F-1... -
Page 132: Programming Automatic Balance For A Vga Optica
January 2006 Programming Automatic Note: For Optica Analyzers with software version XXX or later, see Automatic Cleaning and Balance Function on page 4-9. Balance for a VGA Optica Table F-1: Automatic Balance Options Item Function Available Options Enter the interval in minutes Interval Set how often the automatic balance takes place. - Page 133 Appendix G...
-
Page 134: Appendix G: Communicating With The Optica Using Ethernet
Communicating with the OPTICA Using Ethernet Direct Communication ........G-1... -
Page 135: Direct Communication
Optica. Commands that are used to retrieve information from the Optica are preceded with the prefix Get, and those that are used to set parameters at the Optica are preceded with the prefix Set. Only the commands that enable the user to retrieve information from the Optica are detailed in this document. -
Page 136: Determining The Available Commands
Determining the Available The available commands can be determined by entering the line below in the address line of the browser. This command returns a list Commands of API commands supported by the Optica. http://3.112.160.36:28005/OpticaAPI.xml <?xml version="1.0" encoding="UTF-8" standalone="yes" ?> <OpticaAPIInfo>... -
Page 137: Retrieving The Alarm Settings
2 here indicates Outerband Enabled = True (Alarm 1 is enabled.) Unit Offset = 2 (% RH) See the Optica manual or use the GetHTPLabels for the list of available units and the order. Type = 2 ( ignore this value) LowerLimit = 18.000000 (the Lower limit is 18 %RH) -
Page 138: Retrieving The Alarm Types
January 2006 Retrieving the Alarm This command enables the user to retrieve different alarm types that are supported by the Optica, and the order in which they are Types referenced. Command: http://3.112.160.36:28005/OpticaAPI.xml?GetAlarmTypes Function Name: GetAlarmTypes Channel: 0 Response: <?xml version="1.0" encoding="UTF-8" standalone="yes" ?>... -
Page 139: Retrieving Supported Units
January 2006 Retrieving Supported This command enables the user to retrieve different units that are supported by the Optica and the order in which they are referenced. Units Command: http://3.112.160.36:28005/OpticaAPI.xml?GetAllLabels Function Name: GetAlarmTypes Channel: 0 Response: <?xml version="1.0" encoding="UTF-8" standalone="yes" ?>... -
Page 140: Retrieving Labels And Functions
January 2006 Retrieving Labels and This command enables the user to retrieve different units that are supported by the Optica, and the order in which they are referenced. It Functions also indicates which labels are humidity labels, temperature labels and pressure labels. - Page 141 <PressureUnitsBaseIndex>21</PressureUnitsBaseIndex> <UserUnitsBaseIndex>30</UserUnitsBaseIndex> <retval>GEIAPI_SUCCESS</retval> </OpticaAPIReturn> This response indicates how many humidity labels (iHumidityLabels), temperature labels (iTemperatureLabels), pressure labels (iPressureLabels) and UserLabels there are. The iLabels value indicates how many labels there are all together (33). Communicating with the OPTICA Using Ethernet...
-
Page 142: Retrieving Analog Output Information
<OpticaAPIReturn Function="GetCurrentData"> <channel>0</channel> <channelName /> Note: iNumber is the number of data values returned. This number is the same as "iLabels" of GetHTPLabels and those labels coincide with these values. <iNumber>33</iNumber> <fAllData>-4.892536</fAllData> <fAllData>23.193436</fAllData> <fAllData>16.158667</fAllData> <fAllData>9.333572</fAllData> Communicating with the OPTICA Using Ethernet... - Page 143 <fAllData>101426.570313</fAllData> <fAllData>101.426567</fAllData> <fAllData>760.761841</fAllData> <fAllData>29.239281</fAllData> <fAllData>1.034267</fAllData> <fAllData>1014265.687500</fAllData> <fAllData>0.401409</fAllData> <fAllData>0.000000</fAllData> <fAllData>0.000000</fAllData> <iBarGraphMin>0</iBarGraphMin> <iBarGraphMax>10</iBarGraphMax> <iBarGraphValue>6</iBarGraphValue> <bHeatState>false</bHeatState> <bCoolState>false</bCoolState> <bPacerState>false</bPacerState> <sStatus>Control Alarm1</sStatus> <retval>GEIAPI_SUCCESS</retval> </OpticaAPIReturn> bHeatState, bCoolState and bPacerState indicate whether the unit is in MaxHeat, MaxCool, or Pacer, respectively. Communicating with the OPTICA Using Ethernet...
-
Page 144: 4X40 Optica Configuration
It takes time to execute the "SaveNetworkSettings" command. Wait until the display updates to determine when to reset the unit. In order for the settings to take effect, power to the unit must be cycled. G-10 Communicating with the OPTICA Using Ethernet... - Page 145 Wiring......2-10 4x40 Optica ......5-8 Alarms VGA Optica .
- Page 146 General Settings 4x40 Optica......5-11 VGA Optica ..... . . 4-16 Glossary .
- Page 147 Balancing the Sensor Optics ... 7-2 4x40 Optica ......3-3 Calibration .
- Page 148 Dew Point ......1-3 4x40 Optica......5-7 Heat Transfer .
- Page 149 Network Menu .....4-12 VGA Optica ......4-4 Operation.
- Page 150 1100 Technology Park Drive Billerica, MA 01821-4111 Web: www.gesensing.com Ireland Shannon Industrial Estate Shannon, County Clare Ireland...
Need help?
Do you have a question about the Optica and is the answer not in the manual?
Questions and answers