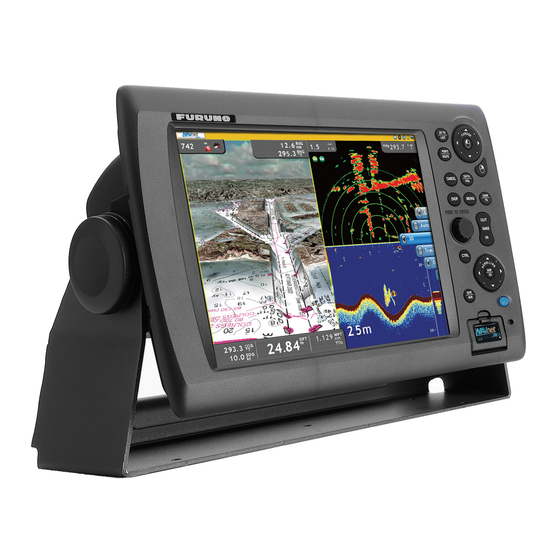
Furuno MFD12 Operator's Manual
Multifunction display
Hide thumbs
Also See for MFD12:
- Installation manual (109 pages) ,
- User handbook manual (20 pages) ,
- Operator's manual (12 pages)
Table of Contents
Advertisement
Quick Links
Download this manual
See also:
Installation Manual
Advertisement
Table of Contents
Troubleshooting

Related Manuals for Furuno MFD12


Summary of Contents for Furuno MFD12
-
Page 2: Important Notices
• Save this manual for future reference. • The wrong use or modification of the equipment (including software) by persons not authorized by FURUNO will cancel the warranty. • All brand and product names are trademarks, registered trademarks or service marks of their respective holders. -
Page 3: Safety Instructions
SAFETY INSTRUCTIONS Read these safety instructions before you operate the equipment. Indicates a condition that can cause death or serious injury if WARNING not avoided. Indicates a condition that can cause minor or moderate injury if CAUTION not avoided. Warning, Caution Mandatory Action Prohibitive Action WARNING... - Page 4 SAFETY INSTRUCTIONS WARNING WARNING Do not depend on one navigation device Keep units other than the radar antenna for the navigation of the vessel. away from the rain and water. Always check your position against all Fire or electrical shock can occur if water available aids to navigation, for the safety gets inside the equipment.
-
Page 5: Table Of Contents
TABLE OF CONTENTS Introduction........................xi System Configuration ....................xiii System Introduction .....................1-1 1.1 The NavNet 3D System ..................... 1-1 1.1.1 How to sleep the equipment................1-2 1.2 Controls........................1-2 1.2.1 Control Description..................1-3 1.3 Power ON and OFF ....................1-5 1.4 Panel Dimmer, Display Brilliance ................1-5 1.5 How to Select a Display ..................... - Page 6 TABLE OF CONTENTS 2.10.11Internal/External Alarm .................2-15 2.10.12Alarm Audio Options ..................2-15 2.10.13Alarm Log .....................2-16 2.11 Track.........................2-17 2.11.1 How to Show or Hide the Track Display ............2-17 2.11.2 Track Recording Method, Interval ..............2-17 2.11.3 Track Thickness ...................2-18 2.11.4 Track Color ....................2-19 2.11.5 How to Clear the Active Track ..............2-21 2.11.6 How to Save Active Track ................2-21 2.11.7 How to Replay a Saved Track ..............2-22 2.11.8 How to Remove a Replayed Track...............2-22...
- Page 7 TABLE OF CONTENTS 4.12.1 Restart Navigation..................4-16 4.12.2 How to Cancel Navigation to a Point............4-16 Routes........................5-1 5.1 What is a Route?......................5-1 5.2 How to Create a Route....................5-2 5.2.1 How to Create a New Route ................5-2 5.2.2 How to Insert a Point on a Route ..............
- Page 8 TABLE OF CONTENTS 6.11 How to Reduce Radar Interference ................6-14 6.12 Guard Alarm ......................6-15 6.12.1 How to Set a Guard Zone................6-15 6.12.2 How to Activate or Deactivate a Guard Zone ..........6-16 6.12.3 How to Erase a Guard Zone.................6-16 6.13 Watchman ........................6-16 6.14 Echo Trails........................6-17 6.14.1 How to Hide or Show Echo Trails..............6-17 6.14.2 How to Clear Echo Trails to Start New Trails ..........6-17...
- Page 9 TABLE OF CONTENTS 7.6 How to Reduce Interference ..................7-11 7.7 How to Measure Depth, Time Between Locations ........... 7-12 7.8 How to Erase Weak Echoes ..................7-13 7.9 How to Balance Echo Strength ................7-14 7.10 White Marker......................7-15 7.11 Fish Finder Alarms ....................
- Page 10 TABLE OF CONTENTS 11.4.2 Marine Warning ..................11-13 11.4.3 Tropical Weather Statement...............11-13 11.4.4 Marine WatchBox ..................11-14 11.5 Sirius Satellite Radio ....................11-15 12. Automatic Identification System (AIS) .............12-1 12.1 AIS Introduction ......................12-1 12.2 How to Show or Hide the AIS Display ..............12-1 12.3 AIS Target Symbols....................12-2 12.4 Proximity AIS Target Alarm ..................12-2 12.5 How to Ignore AIS Targets ..................12-4...
- Page 11 TABLE OF CONTENTS APPENDIX 1 Menu Tree...................AP-1 SPECIFICATIONS .....................SP-1 INDEX.......................... IN-1...
-
Page 12: Introduction
A Word to the Owner of the MFD8, MFD12 Congratulations on your choice of the MFD8, MFD12 Multi Function Display, an integral part of our new NavNet 3D series of multi-function displays. We are confident you will see why the FU- RUNO name has become synonymous with quality and reliability. - Page 13 Introduction Fish finder (option) • Measures the depth to the bottom and displays underwater conditions in multi-colors according to echo strength. A monochrome presentation shows the echoes in shades of gray. (*Number of colors depends on network sounder.) • The zoom mode enlarges the targets. •...
-
Page 14: System Configuration
System Configuration MFD8 RADAR SENSOR RADAR SENSOR DRS2D/DRS4D DRS4A/DRS6A/DRS12A/DRS25A POWER SUPPLY UNIT* PSU-012 or PSU-013 12-24 VDC* MONITOR MU-155C/170C, etc. AIS RECEIVER, HEADING SENSOR or VIDEO IN(CCD EXTERNAL BUZZER CAMERA, MAX. 2) LINE OUT GPS NAVIGATOR (SPKR, ETC.) GP-320B/330B LINE IN(MIC, USB DEVICE FUTURE USE) (MOUSE, KYBD) - Page 15 FUTURE USE) (MOUSE, KYBD) FAX-30 NMEA 2000 HUB-101 FA-50 (GP-330B, ETC.) MULTI FUNCTION DISPLAY MFD12 PSU-012: w/DRS12A FISH FINDER PSU-013: w/DRS25A 12-24 VDC* (DFF series, ETR-6/10N, ETR-30N, FCV-1150) : Standard Supply See the table and figure below for rectifiers used in the system.
-
Page 16: System Introduction
System Introduction This chapter provides the information necessary to get you started using your system. Some of the topics are how to turn on the equipment and an introduction to the main displays. Standards used in this manual • The keys and controls on the control panel are shown in bold face, for example the DISP key. -
Page 17: How To Sleep The Equipment
Controls The controller for this system is either the MFD8 or MFD12. A key that has two text labels separated by a line has two functions. The top label is the main function and the bottom label, the secondary function. Short-push to access the main function and long-push (approximately three seconds) to access the second- ary function. -
Page 18: Control Description
1. System Introduction 1.2.1 Control Description The controls of your system are in the figure shown below. Controls are illuminated for nighttime use. MFD8 MFD12 Control description Mouse Label Function operation Short-push: Turn ON the power. Adjust the panel dimmer. - Page 19 1. System Introduction Mouse Label Function operation RotoKey • Rotate to display soft controls, the quantity Scrollwheel. (basic, standard, full or custom) of which you Turn to dis- select from the menu, or select the menu item. play soft con- •...
-
Page 20: Power On And Off
1. System Introduction Power ON and OFF Press to turn the power ON. To turn the power OFF, press and hold the same key BRILL until the screen is black. When you turn on the power, two or three beeps sound and the lamp near the power switch lights. -
Page 21: How To Select A Display
1. System Introduction How to Select a Display Use the DISP key and the RotoKey to select a display, from the display selection win- dow. The displays available depend on your system configuration and the HotPage settings on the [My NavNet] menu. (You can change the display selection window ac- cording to your needs and system configuration.)) 1) Press the DISP key to show the display selection window. -
Page 22: Sd Cards
1. System Introduction SD Cards The SD card stores the tracks, routes, points, settings, etc. Set and remove SD cards as shown below. The recommended capacity for the cards is 128 MB to 2 GB. The Secure Digital High Capacity (SDHC) SD cards cannot be used. How to format a SD card You do not normally need to format a SD card for use with the system. -
Page 23: Chart Plotter Introduction
1. System Introduction Chart Plotter Introduction The chart plotter provides a small world map in raster format. A vector chart for the US coastline (with Alaska and Hawaii) is provided also. The plotter section has functions to enter waypoints, and create and plan routes. The chart plotter receives position information supplied from the position-fixing equip- ment like GPS or DGPS. -
Page 24: Radar Introduction
1. System Introduction Radar Introduction A radar system operates in the microwave part of the radio-frequency (RF) range. The radar detects the position and movement of objects. Objects are shown on the radar display at their measured distances and bearings in intensities according to echo strength. -
Page 25: Fish Finder Introduction
1. System Introduction Fish Finder Introduction The fish finder screen provides a “picture” of the echoes found by the fish finder. Ech- oes are scrolled across the screen from the right position to the left position. The num- ber of minutes an echo is displayed on the screen is controlled by the picture advance speed. -
Page 26: The Cursor
1. System Introduction 1.10 The Cursor The cursor is always displayed on the radar, chart plotter and fish finder displays and has the functions shown below. • Find the position, range and bearing to an object on the chart plotter and radar dis- plays •... -
Page 27: Status Bar
1. System Introduction 1.11 Status Bar The status bar is the horizontal bar at the top of any display. This bar shows operation information with messages, and sensor state with the icons. The color of the bar changes according to the types of messages as shown below. Bar color Type of message Alarm messages... -
Page 28: Rotokey And Soft Controls
The icon at the end of a soft control indicates soft control category: Pictured: MFD12 • A left arrow within an icon indicates a multi-function soft control. Push the RotoKey to access the functions. • An icon without an arrow indicates the ON/OFF status of the item shown on the soft control. -
Page 29: Pop-Up Menus
1. System Introduction 1.13 Pop-up Menus The pop-up menus let you quickly access the commands according to the selected ob- ject or active display. To display a pop-up menu, select an object and hit the right- click button. A pop-up can also be shown if you push the same button in any position on the active display. -
Page 30: Data Boxes
1. System Introduction 1.14 Data Boxes The data boxes show the navigation data. You can select the data to display in the boxes, and show or hide the boxes as necessary. A box can show one or more data. Multiple data are scrolled according to the scrolling time set on the [DataBox] menu. The data that you can show depends on your system configuration. -
Page 31: Menu Introduction
1. System Introduction 1.15 Menu Introduction The menu system has a maximum of 15 main menus and related sub menus. The number of menus depends on equipment connected. To show the menu, press the MENU key. How to use the menu 1. - Page 32 1. System Introduction Menu description Menu icon Function Menu icon Function Select the shape for the Set the ARPA and AIS boat icon, and control the targets. track of your vessel. Targets Ship & Track Set points. Set the weather display. Points Weather Set routes.
- Page 33 1. System Introduction ground color of the selector is blue, which indicates the menu is selected, but not active. 3. Do one of the following according to menu type: • Single sub menu, push the RotoKey to start the menu operation. •...
-
Page 34: Language
1. System Introduction Menu item type Procedure Status icon Items which you can activate or deacti- vate have a status icon. Push the Status icon RotoKey to show the icon in green to activate the item, or gray to deactivate. Alphanumeric data input box Rotate the RotoKey to select alphanu- meric character (A-Z, 0-9) then push... -
Page 35: Boat Icon
1. System Introduction 1.17 Boat Icon The boat icon marks current position, and the default shape is "simplified icon." If your vessel is different, you can change the shape of the boat icon to match your vessel. Simplified icon (default boat icon) 1. -
Page 36: Man Overboard (Mob)
1. System Introduction 1.18 Man Overboard (MOB) Use the MOB function if a person or object falls overboard. You need either position data from a navigation device, or heading and speed data to calculate position by dead reckoning. You activate the MOB from the chart plotter display and MOB position is marked on both the chart plotter and radar displays. - Page 37 1. System Introduction MOB information There are two types of MOB information, simple and detailed. Simple information in- cludes point name (MOB), and range and bearing to the MOB position. Detailed infor- mation includes simple information plus the information shown below. •...
-
Page 38: Facsimile Receiver Fax-30
1.19 Facsimile Receiver FAX-30 The FURUNO Facsimile Receiver FAX-30 installs in the NavNet network and can be controlled from a NavNet display. Below are the steps to start fax operation. 1. At installation of this equipment, connect the FAX-30 to the NavNet and check that the equipment identifies the FAX-30, through the Installation Wizard. -
Page 39: Ais Transponder Fa-30, Fa-50
1. System Introduction 1.20 AIS Transponder FA-30, FA-50 The FURUNO AIS Transponder FA-30 (FA-50) installs in the NavNet network and can be controlled from a NavNet display. To access the main menu of the transponder, do the following: 1. Open the main menu and select the [System] menu. -
Page 40: Chart Plotter
Chart Plotter This chapter shows you how to do the following: • Use and prepare the chart plotter • Set chart plotter related alarms • Control the track Charts 2.1.1 Chart Description A world map in raster chart format is included in your unit. A vector chart for the US coastline (Alaska and Hawaii included) is provided also. - Page 41 2. Chart Plotter Raster chart Vector chart...
-
Page 42: Fishing Chart
2. Chart Plotter Cooper City Dania Beach Aventura Carol City Doral Miami Beach Coral Gables Kendale Lakes Cutler Ridge Fishing chart... -
Page 43: Chart Scale
2. Chart Plotter Chart Scale You can change the chart scale to change the amount of information shown, or zoom in or out at the location you select. The selected chart scale appears at the top left- hand position on the screen. In the full screen display, the value shown is 1/2 the dis- tance from the top of the screen to the bottom of the screen. -
Page 44: Orientation Mode
2. Chart Plotter Orientation Mode The chart can be shown in head-up, course-up or north-up orientation. To select an orientation mode, use the RotoKey to select the [Head Up], [North Up] or [Course Up] soft control. Another method is to put the cursor on the orientation mode icon at the top-left position then push the left-click button. -
Page 45: The Boat Icon
2. Chart Plotter The Boat Icon The boat icon appears at current position. The default shape is “simplified icon”. Other shapes are available, from the menu, like yacht and sailboat. The boat icon has the functions indicated below also. • The Heading line is a straight line that runs from your position and this line shows the current heading. -
Page 46: How To Find The Range And Bearing To A Location
2. Chart Plotter How to Find the Range and Bearing to a Location The "ruler" feature measures the range and bearing between any two points on your chart. Range and bearing between the two points are digitally indicated on the screen. 1. -
Page 47: Multiple Chart Plotter Displays
2. Chart Plotter Multiple Chart Plotter Displays A maximum of two chart plotter displays can be shown on one screen. The multiple chart plotter display lets you see the conditions around your vessel on both short and long ranges. Also, you can see how your vessel moves toward your destination from more than one angle. -
Page 48: Cartographic Text And Objects On Vector Charts
2. Chart Plotter Cartographic Text and Objects on Vector Charts This section shows you how to show or hide the cartographic objects and text infor- mation that appear on vector charts. 2.9.1 Control Visibility of Text and Object Information The [Chart-Vector] menu controls the visibility of text and object information, for exam- ple, buoy names and light description. -
Page 49: Control Visibility Of Cartographic Objects
2. Chart Plotter Name: Show or hide geographic names. Shallow Contour: Show shallow depth contours in dark blue. Safety Contour: Show safety depth contours in medium blue. Deep Contour: Show deep depth contours in light blue. Depths greater than 1800 feet are shown in white. - Page 50 2. Chart Plotter Chart-config menu description S-52 Vector Chart Display Mode: Set the level of information to show on the chart. The selections are [Basic], [Standard], [Other], [Fishing], [Custom], and [Default]. The chart features are turned on or off according to setting. Unknown Object: Unknown objects that appear on the chart.
-
Page 51: Alarms
2. Chart Plotter 2.10 Alarms This section describes the alarms available with the chart plotter: • XTE alarm • Anchor watch alarm • Proximity alarm • Depth alarm • Sea surface temperature alarm • Sea surface temperature shear • Speed alarm •... -
Page 52: Proximity Alarm
2. Chart Plotter 2.10.3 Proximity Alarm The proximity alarm tells you when your vessel is near a point for which an avoidance circle, set on the [Points] list, is active. When your vessel is within the set value, audio and visual alarms are released. 2.10.4 Depth Alarm The depth alarm tells you when the depth to the bottom is over or under the value you... -
Page 53: 10How To Set An Alarm
2. Chart Plotter 2.10.10 How to Set an Alarm 1. Press the MENU key to open the menu. 2. Open the [Alarms-General] menu. 3. Use the RotoKey to select an alarm item then do one of the following: a) For the alarms which have a status icon, push the RotoKey to activate or deactivate the alarm. -
Page 54: 11Internal/External Alarm
2. Chart Plotter 5. Use the RotoKey to set a value. Rotate the key to select a value then push the key to validate the setting. 6. Press the MENU key to close the menu. 2.10.11 Internal/External Alarm The audio alarm is output from this equipment in the default setting. The alarm can be output from this equipment, from external equipment or from both this equipment and external equipment. -
Page 55: Alarm Log
2. Chart Plotter 2.10.13 Alarm Log The [Alarm-Log] menu shows the names, date and time that current and past alarms were broken. Active alarm Past alarms 2-16... -
Page 56: Track
2. Chart Plotter 2.11 Track The track (or movement) of your vessel is plotted on the screen with position data. Your track lets you see how your vessel has moved. The track is saved to the hard disk if the track is active. A line runs between each track point. -
Page 57: Track Thickness
2. Chart Plotter 2.11.3 Track Thickness You can set the thickness of the track to thin, medium or thick. If you are following the same track many times, you can show the track in the thinnest width to keep the screen clear. -
Page 58: Track Color
2. Chart Plotter 2.11.4 Track Color Track can be displayed in a single color or multiple colors. For multiple colors, you can display the track according to the conditions shown below. • Depth range • Depth difference • Sea surface temperature range •... - Page 59 2. Chart Plotter 6. Use the RotoKey to set values. Refer to the description below and on the next page. 999 ft Depth range Sea surface temperature range Speed Depth variation Fixed color Date Sea surface temperature variation Fixed color: Single-color track in white, blue, purple, cyan, green, yellow and red. Depth range: Change the color of the track with depth.
-
Page 60: How To Clear The Active Track
2. Chart Plotter Sea surface temperature range: Change the color of the track with change in sea surface temperature. Set a limit for each color. For example, if the default set- ting for white is 41.0°F, the track is white for temperatures up to 41.0°F. Sea surface temperature variation: Paint the track in a different color when the sea surface temperature changes by the figure set here. -
Page 61: How To Replay A Saved Track
2. Chart Plotter 4. Use the RotoKey to enter name. Rotate the key to select a character then push the key to validate your selection. You can use a maximum of eight characters for the name. (To save the track under the name shown in the [Rename] box, push the RotoKey continuously until the box closes. -
Page 62: How To Find Information About A Track
2. Chart Plotter 2.11.9 How to Find Information About a Track Simple track information provides the depth and temperature for the location selected on a track. (Depth and temperature sensors are required.) Put the cursor on any part of a track to get this information. Detailed track information includes simple track information plus the information shown below. - Page 63 2. Chart Plotter • Arrows on the track point in the direction to follow the route. Activate Trackback Course to follow Track (red dashed line) First destination Arrows point in Route direction to point follow route Trackback route following options When you are following a route, you can do the following from the Route pop-up menu.
-
Page 64: D Display, Overlays
3D Display, Overlays 3D Display The 3D display has native 3D chart design that allows full time 3D presentation. This true 3D environment gives you all of the information you require with no restrictions on the information you can see. You can plan your routes, enter points, etc. like on the 2D chart. - Page 65 3. 3D Display, Overlays How to activate and deactivate the aerial view by the SHIP/3D button Before you do this procedure, open the [Chart-General] menu and activate [3D Pan/ Tilt Mode]. This sequence allows you to adjust the pitch and orientation. 1.
-
Page 66: Underwater Display
3. 3D Display, Overlays 3.1.2 Underwater Display The underwater display provides a look into the water from above the water. This dis- play is available between 7 yards and 1.003 nm. To activate the underwater display, use the RotoKey to select the [3D] and [Under- water] soft controls. -
Page 67: How To Make The 3D View Clearer
3. 3D Display, Overlays 3.1.3 How to Make the 3D View Clearer In the 3D display, some topographical features are easier to see if you use the “3D Exaggeration” feature. This feature expands both objects on the chart and the under- water vertically so that you can easily see the shape of the objects and position. -
Page 68: Overlays
3. 3D Display, Overlays Overlays Four chart overlays are available on the chart plotter display. These overlays are depth shading, weather, satellite photo, and animation. 3.2.1 Depth Shading Overlay The depth shading overlay shows the depths in red (shallow), yellow (medium) and green (deep). -
Page 69: Weather Overlays
3. 3D Display, Overlays 3.2.2 Weather Overlays The weather overlays put weather information on the 2D and 3D displays. These dis- plays are available only in North America and with connection of a Sirius weather re- ceiver. Four types are available: Wx Radar, Wx Data, and Adv Wx Data, and Marine Zone. - Page 70 3. 3D Display, Overlays Weather data overlay The weather data overlay provides forecast data that includes weather radar, sea sur- face temperature, storm tracks, pop-up weather alerts, etc.
- Page 71 3. 3D Display, Overlays Advanced weather overlay The advanced weather overlay provides the weather data not included in the standard weather data overlay, like buoys,...
- Page 72 3. 3D Display, Overlays Marine zone overlay The coastal waters are divided into zones for forecasts. These zones can be displayed on the screen with lines, like in the illustration shown below Marine zone...
-
Page 73: Satellite Photo Overlay
3. 3D Display, Overlays 3.2.3 Satellite Photo Overlay You can put the satellite photo for your area on the 2D and 3D displays. Use the Ro- toKey to select [Overlay] and [Sat Photo] then push the RotoKey to show or hide the satellite photo High-resolution satellite images for the USA coastline are not provided standard, but are available at no cost (except shipping and handling). -
Page 74: Radar Overlay
3. 3D Display, Overlays 3.2.5 Radar Overlay The radar overlay display puts the radar picture on the top of the navigation chart. To display the radar overlay, use the RotoKey to select [Overlay] followed by [Radar]. Push the RotoKey to show or hide the radar overlay. How to set the level of the radar echo transparency Open the [Radar] menu and use the RotoKey to select [Echo Transparency for Over- lay]. -
Page 75: Tidal Information Overlay
3. 3D Display, Overlays 3.2.6 Tidal Information Overlay The NavNet 3D has worldwide tidal and tidal current information. You can overlay this information on the chart plotter display. The tidal information symbol ( ) appears at the locations of tidal recording stations. When you select a symbol, you get a graph of predicted maximum and minimum tide heights, and times for sunrise and sunset. - Page 76 3. 3D Display, Overlays How to show simple tidal information You can display simple information (name, local time and tide height) about a tide by when you put the cursor on a tide icon. How to display the tide graph The NavNet 3D has worldwide tide and current information.
-
Page 77: Tidal Current Overlay
3. 3D Display, Overlays How to understand the tide graph display • The information is mostly accurate under moderate weather conditions. However, storms and weather fronts can influence forecasted tide times and heights. • The dotted vertical line on the graph functions to select a time for which the tide height is displayed. -
Page 78: Points
Points About Points In navigation terminology, a point is any location you mark on the chart plotter display. A point can be a fishing spot, reference point and other important locations. You can use a point you have entered to set a destination. This unit has 2,000 points into which you can enter position information. -
Page 79: How To Mark A Point
4. Points How to Mark a Point You can mark a point • At current position • At cursor position • From the Points list 4.2.1 How to Mark a Point at Current Position Press the SAVE/MOB key to mark a point at current position. The following occurs. •... -
Page 80: How To Mark A Point From The Points List
4. Points 4.2.3 How to Mark a Point from the Points List A point marked from the Points list is put at the current position. To put the point at a different location, edit the point data (position, symbol, etc.) before marking a point. 1. -
Page 81: How To Find Information About An On-Screen Point
4. Points 3. The cursor is selecting [Total]. Push the RotoKey twice then the right side of the display shows the point information like in the illustration shown below. Total no. of points Point settings Point name, range and bearing to point and point group name appear here. -
Page 82: Default Point Settings
4. Points Default Point Settings When you save a point, the equipment saves the point according to the shape, color and group name set on the [Points-General] menu. If those settings do not meet your requirements, you can the settings as shown below. 1. -
Page 83: How To Move A Point
4. Points How to Move a Point You can move a point by two methods: • Move the symbol to a new location. • Enter new position manually on the [Points] list. 4.5.1 How to Move an On-screen Point 1. Set the cursor on the point to move. The point becomes larger if the point is se- lected correctly. -
Page 84: How To Delete A Point
4. Points How to Delete a Point You can delete points by two methods, on the screen and from a Points list. 4.6.1 How to Delete a Point on the Screen Method 1: CANCEL key Put the cursor on the point to delete and press the CANCEL key. Method 2: Pop-up menu 1. -
Page 85: How To Edit A Point From The Points List
4. Points How to Edit a Point from the Points List You can edit the points you have entered from the [Points] menu. You can select the point to edit on-screen, or from a Points list. 1. On the screen, use the CursorPad to select the point to edit, push the right-click button and select [Edit] from the pop-up menu. - Page 86 4. Points 5. Select [Point Color] to change the color of the square part of the point symbol. Seven colors are available: red, yellow, green, cyan, purple, blue, and white. 6. Select [Group] to put the point in a point group. [Fishing], [Navigation], [Danger] and [Entertainment] are the default groups.
-
Page 87: How To Find A Point
4. Points How to Find a Point 4.8.1 How to Show a Point at the Center of the Screen You can easily move a point to the center of the screen if you select it on the [Points] menu. 1. In the chart plotter mode, long-push the GO TO/LIST key to open the [Points] menu then open a Points list. -
Page 88: How To Show Or Hide All Points
4. Points • Add new. Add new group. The default group name is GROUP XXX (XXX=next three-digit group number). • Delete. Delete selected group name. Points in the group are not deleted. • Visible. Control visibility of points in a group. 6. -
Page 89: How To Go To A Point
4. Points 4.11 How to Go to a Point Select the point to go to from the three methods shown below. • Select the point on the screen • Select the point from a Points list • Select the point with the cursor After you have selected a point, you can do the following. -
Page 90: How To Go To Cursor Position
4. Points 4.11.2 How to go to Cursor Position The benefit of using the cursor position is you do not have to use a saved point. The point is erased when the navigation is cancelled. GO TO/LIST key Put the cursor on the location then push the GO TO/LIST key. Pop-up menu Put the cursor on the location then push the right-click button to show the Cursor Po- sition pop-up menu. - Page 91 4. Points A red dashed line runs between current position and the point. This line is the course to follow to get to the point. The point arrival area is indicated with a circle, or both cir- cle and line. You can select the arrival area indication method with [Waypoint Switch- ing Mode] in the [Routes-General] menu.
-
Page 92: How To Go To A Point Selected From The Points List
4. Points 4.11.3 How to go to a Point Selected from the Points List 1. Long-push the GO TO/LIST key to open the [Points] menu then open the Alpha list. 2. Use the RotoKey to select a point. 3. Push the RotoKey to show the [Points] Menu pop-up. The cursor selects [Go To]. Push the RotoKey. -
Page 93: How To Restart And Cancel Navigation To A Point
4. Points 4.12 How to Restart and Cancel Navigation to a Point 4.12.1 Restart Navigation When you go to a point, you can restart the navigation to the point from current Line 2 location. When you steer to keep away from an obstruction or the vessel drifts, you go off course as shown in Line 1 in the fig- ure. -
Page 94: Routes
Routes What is a Route? A route is a series of points entered in the order to use for navigation. A route can con- tain up to a maximum of 100 points, and this equipment stores 200 routes. You create a route by pointing and clicking geographical positions on the screen. These positions are marked with blue solid circles. -
Page 95: How To Create A Route
5. Routes How to Create a Route 5.2.1 How to Create a New Route The route points of an inactive route are marked on the display with a blue square and a blue line runs between points. 1. Put the cursor on the 1st point for the route. 2. -
Page 96: How To Insert A Point On A Route
5. Routes 5.2.2 How to Insert a Point on a Route You can put a point between route legs when you need an additional point along a route. 1. Put the cursor on a leg of the route. 2. Push the right-click button to show the Routes pop-up menu. 3. -
Page 97: How To Extend A Route
5. Routes 5.2.4 How to Extend a Route You can extend a route from the last point on the route. 1. Place the cursor on a leg of the route. 2. Push the right-click button to show the pop-up menu. 3. -
Page 98: How To Join Two Routes
5. Routes 5.2.6 How to Join Two Routes You can join two routes to create a new route. The new route takes the name of the 1st route selected and the 2nd route selected is deleted. All route data is updated. How the routes are joined depends on route selection order. -
Page 99: Routes List
5. Routes Routes List The saved routes are stored in the Routes list. The list stores the following route data for each route: • Name of route • Length of route • Number of route points • Distance between legs and total distance •... -
Page 100: How To Find Information About A Route On The Screen
5. Routes How to Find Information About a Route on the Screen Put the cursor on a route to get simple route information (name and length of route). Push the left-click button to get detailed information. This information includes name of route, length of route, no. -
Page 101: How To Change The Name Of A Route
5. Routes How to Change the Name of a Route The default route name is “RTE” plus the number of the youngest empty route number (RTE-001 - RTE-200). To change the name, follow the procedure shown below. 1. Press the MENU key to open the menu then select the [Routes] tab in the [Routes] menu. -
Page 102: How To Show Or Hide All Routes
5. Routes How to Show or Hide All Routes All routes can be shown or hidden. An active route cannot be removed from the screen unless route following is stopped. 1. Long-push the RotoKey to show the soft controls. 2. Use the RotoKey to select [Routes]. 3. -
Page 103: How To Follow A Route Selected From The Routes List
5. Routes 5.9.2 How to Follow a Route Selected from the Routes List 1. Press the MENU key to open the menu. 2. Open the [Routes-Routes] menu. 3. Use the RotoKey to select a route then push the key to show the Routes pop-up menu. -
Page 104: How To Show Information About A Route
5. Routes 5.9.4 How to Show Information About a Route 1. Put the cursor on a route leg of the active route then push the right-click button to show the Routes pop-up menu. 2. Use the RotoKey to select [Route Info]. The display shows route information for the route selected. -
Page 105: Operations When You Follow A Route
5. Routes 5.10 Operations When You Follow a Route 5.10.1 Restart Navigation When you follow a route, you can restart the navigation to the next point on the Line 2 route from current location. When you steer to keep away from an obstruction or the vessel drifts, you go off course as shown in Line 1 in the fig- ure. -
Page 106: Stop Following A Route
5. Routes 5.10.3 Stop Following a Route 1. Use the CursorPad to put the cursor on the dashed line of the route. 2. Push the right-click button to show the Route Follow pop-up menu. Restart Reverse Extend Route Route Info 3. -
Page 107: Waypoint Switching Mode
5. Routes 5.10.5 Waypoint Switching Mode When you reach a route point, your unit automatically changes to the next route point according to the waypoint switching mode selected on the menu. Cross Line: Change the waypoint when the vessel moves through an imaginary cross line (vertical line) that moves through the center of the destination point. -
Page 108: Route Auto Zoom
5. Routes 5.10.6 Route Auto Zoom You can get automatic range change after you have moved past a route point. Use this feature to find the next point in a route when the point is not within the current dis- play range. -
Page 109: Waypoint Arrival Notification
5. Routes 5.10.8 Waypoint Arrival Notification The waypoint notification feature releases audio and visual alarms when you are near a route point by some distance. You set the distance with [Switching Mode Circle Ra- dius] on the [Routes] menu. Activate or deactivate this feature as follows. 1. -
Page 110: Radar
Radar This chapter provides the information necessary for radar operation. The topics in- clude how to do the following. • Adjust the gain • Reduce sea and rain clutter • Measure the range and bearing to a target • Reduce radar interference •... -
Page 111: How To Adjust The Gain
6. Radar How to Adjust the Gain The GAIN/TX key adjusts the gain (sensitivity) of the radar receiver. This key operates like the volume control of a broadcast receiver, which amplifies received signals. The correct setting shows some background noise on the screen. If you do not use enough gain, weak echoes are erased. -
Page 112: How To Reduce Sea Clutter
6. Radar How to Reduce Sea Clutter The reflected echoes from waves appear at the central part of the display and have the name "sea clutter". The sea clutter increases in width as the height of waves and the height of the antenna above the water increase. If the sea clutter is strong, targets can be hidden inside the clutter, like in the left-hand figure shown below. -
Page 113: How To Reduce Rain Clutter
6. Radar Manual sea clutter adjustment 1. Press the GAIN/TX key to show the Gain-Sea-Rain adjustment window. (You can also show the window if you put the cursor near the site of the window.) 2. Press the GAIN/TX key again to select [Sea]. 3. -
Page 114: Range Scale
6. Radar Manual rain clutter adjustment 1. Press the GAIN/TX key to show the Gain-Sea-Rain adjustment window. (You can also show the window if you put the cursor near the site of the window.) 2. Press the GAIN/TX key again to select [Rain]. 3. -
Page 115: Orientation Mode
6. Radar Orientation Mode The orientation mode controls the relationship between your vessel and all the other targets. The heading data is required in modes except the head-up mode. When the heading data is lost, the orientation mode automatically goes to head-up. A red “X” is also put on the compass icon on the status bar. - Page 116 6. Radar North-up North Targets are shown at their measured distances marker Heading line and their true (compass) directions from your vessel. North is at the top of the screen. The heading line changes its direction according to your heading. True motion display North marker...
-
Page 117: How To Measure The Range To A Target
6. Radar How to Measure the Range to a Target You can measure the range to a target three methods: • By the range rings • By the cursor (see section 1.10) • By the Variable Range Marker (VRM) Use the fixed range rings to get a rough estimate of the range to a target. These rings are the concentric solid circles about your vessel. -
Page 118: How To Deactivate A Vrm
6. Radar 4. Push the RotoKey to finish. The VRM is then fixed at the range selected. Target VRM1 VRM2 VRM box 6.7.3 How to Deactivate a VRM 1. Push the RotoKey to show the soft controls. (In the default arrangement, a short- push activates VRM1 and a long-push activates VRM1 and VRM2.) 2. -
Page 119: How To Measure The Bearing To A Target
6. Radar How to Measure the Bearing to a Target The Electronic Bearing Line (EBL) measures the bearing to targets. 6.8.1 How to Measure the Bearing with an EBL There are two EBLs, No. 1 and No. 2. Each EBL is a straight dashed line from the cen- ter of the screen to the edge. -
Page 120: How To Erase An Ebl
6. Radar 6.8.2 How to Erase an EBL 1. Push the RotoKey to show the soft controls. (In the default arrangement, a short- push activates EBL1 and a long-push activates EBL1 and EBL2.) 2. Select [EBL] and [Clear1] or [Clear2]. The selected EBL and the related EBL indication are erased. -
Page 121: How To Off-Center The Picture
6. Radar How to Off-center the Picture You can off-center your position to expand the view field without selecting a larger range scale. The position can be off-centered in the bow, stern, port or starboard di- rection, but not more than 75% of the range in use. To off-center the radar picture, operate the ScrollingPad. -
Page 122: Heading Line
6. Radar 6.10 Heading Line The heading line indicates your heading in all orientation modes. This line connects between your position to the outer edge of the radar display. The line is at zero de- grees on the bearing scale in the head-up mode. The orientation of the line changes in the north-up, course-up and true motion modes with the movement of your vessel. -
Page 123: How To Reduce Radar Interference
6. Radar 6.11 How to Reduce Radar Interference Radar interference can occur when your vessel is near the radar of another vessel that operates on the same frequency band with your radar. The interference shows on the screen in many bright dots. The dots can be random or in the shape of dotted lines that run from the center to the edge of the display. -
Page 124: Guard Alarm
6. Radar 6.12 Guard Alarm The purpose of the guard alarm is to provide audio and visual warnings against targets (vessels, islands, landmasses, etc.) when a radar target enters the area you select. 6.12.1 How to Set a Guard Zone You can set a guard zone by two methods. -
Page 125: How To Activate Or Deactivate A Guard Zone
6. Radar 6.12.2 How to Activate or Deactivate a Guard Zone Put the cursor on a line of the guard zone. Push the right- click button to show the Guard Alarm pop-up menu. Use the RotoKey to activate or deactivate the alarm. If a target enters the zone, the buzzer sounds and the message "Target enters Guard Zone 1 (or 2), Press Menu Button."... -
Page 126: Echo Trails
6. Radar 6.14 Echo Trails Echo trails show the movements of radar targets relative or true to your vessel in imi- tation afterglow. This function helps alert you to possible collision conditions. (a) True target trails (b) Relative target trails (No smearing of Targets moving relative stationary targets) -
Page 127: Echo Trail Reference
6. Radar 6.14.4 Echo Trail Reference Trail movement can be set for relative or true. The relative trails show the relative movements between targets and your vessel. True motion trails show the movements of targets according to the targets over-the-ground speeds and courses. True trails re- quire position and heading information. -
Page 128: Echo Stretch
6. Radar 6.15 Echo Stretch The radar adjusts the reflected echoes from long-range targets, but the echoes are normally displayed weak and small. If you have a weak, long-range target that re- quires closer inspection, use the echo stretch to magnify the target. This function magnifies the targets and sea clutter and radar interference. -
Page 129: Automatic Shift
6. Radar 6.17 Automatic Shift The position of your vessel, or sweep origin, can be automatically moved to expand the view field without selecting a larger scale. The amount of automatic shift is calculated according to the speed of your vessel. The and the amount of shift is limited to 50% of the range in use. -
Page 130: How To Show, Hide, Cancel An Active Route
6. Radar 6.19 How to Show, Hide, Cancel an Active Route You can show, hide or cancel the active route from the radar display. To hide or show the active route, long-push the RotoKey, then select [Active Rte]. Push the RotoKey to show or hide the active route. -
Page 131: Echo Color
6. Radar 6.21 Echo Color Echo color is available in single colors of yellow or green or “True.” True paints echoes in colors from red, green and yellow in the order of increasing echo strength. 1. Press the MENU key to open the menu. 2. -
Page 132: Dual-Range Display
6. Radar 6.24 Dual-Range Display The dual-range display scans and displays two different radar ranges at the same time, with a single antenna. There is no time delay between the two pictures and you have separate control of each picture. This feature lets you keep a close watch on close-range targets and far targets. -
Page 133: Far-2107 Radar Series And Navnet 3D
6. Radar 6.25 FAR-2107 Radar Series and NavNet 3D The FAR-2107 radar series (program no. 02.50 and after, C specification) can be con- nected to your NavNet 3D, and some functions can be controlled from the NavNet 3D. The table shown below shows which features can be controlled from the NavNet 3D. Note that you should turn off Guard Polygon at the radar to control the radar from the NavNet 3D. -
Page 134: How To Understand The Radar Display
6. Radar 6.26 How to Understand the Radar Display 6.26.1 False Echoes Echo signals can appear on the screen at positions where there is no target or disap- pear where there are targets. You can identify false targets when you understand why the false echoes appear. - Page 135 6. Radar Shadow sector Funnels, stacks, masts, or derricks in the path of the antenna stop the radar beam. If the angle opposite the antenna is more than one or two degrees, a sector or shadow sector appears on the screen. Targets are not displayed within the sector. Radar antenna Radar...
-
Page 136: Search And Rescue Transponder (Sart)
6. Radar 6.26.2 Search and Rescue Transponder (SART) A vessel in distress uses a radar-SART to show a series of dots on the radar display of nearby vessels to indicate distress. A SART transmits when it receives a radar pulse from any X-Band (3 cm) radar within a range of approximately 8 nm. When a SART receives a radar pulse, the SART transmits a response across all the radar fre- quency band. - Page 137 6. Radar Racon (Radar Beacon) A racon is a radar transponder that sends a characteristic signal when the racon re- ceives a radar pulse (normally only the three-centimeter band). If the racon signal is sent on the same frequency as that of the radar, the signal appears on the radar dis- play.
-
Page 138: Arpa Operation
6. Radar 6.27 ARPA Operation The ARPA (Automatic Radar Plotting Aid) shows the movement of a maximum of 30 radar targets. The targets can be acquired manually or automatically. All 30 targets can be acquired manually when the ARPA acquisition area is not active. If the ARPA acquisition area is active, that total is equally divided between manual and auto acqui- sition. -
Page 139: How To Manually Acquire A Target
6. Radar 6.27.2 How to Manually Acquire a Target 1. On the radar display, use the CursorPad to put the cursor on a target. 2. Press the right-click button to show the Radar pop-up menu, shown in the illustration at right. 3. -
Page 140: How To Display Target Data
6. Radar 6.27.3 How to Display Target Data You can find the course, speed, range, bearing, etc. of an ARPA target. For simple data, put the cursor on the ARPA target. For detailed data, put the cursor on the target then push the left-click button. -
Page 141: How To Set An Arpa Acquisition Area
6. Radar How to set the CPA/TCPA Alarm 1. Press the MENU key to open the menu. 2. Open the [Alarm-Target] menu, shown right. 3. Use the RotoKey to select [CPA/TCPA Alarm] then push the key to activate the alarm on (status icon in green). 4. - Page 142 6. Radar 5. Use the CursorPad to move the cursor to the bottom right corner (Point B below) for the guard zone then push the left-click button. Drag cursor to Point B Point A Point B ARPA Acquistion Zone Note 1: To set a 360-degree guard zone, set the same bearing for both the position A and position B.
-
Page 143: Track History Display
6. Radar 6.27.8 Track History Display The track of ARPA targets can be shown on the display with a line from the rear of the targets. How to show or hide the track history display On the radar display or the chart plotter display, long-push the RotoKey to show the soft controls. -
Page 144: Fish Finder
Fish Finder This chapter describes the functions of the fish finder (requires a network sounder or Color LCD Sounder FCV-1150). A fish finder shows the images of underwater objects, like fish and the seabed on the display. Topics include • Display selection •... -
Page 145: How To Select A Display
7. Fish Finder How to Select a Display Your fish finder has six display modes. These modes are single frequency, dual fre- quency, marker zoom, bottom zoom, bottom lock, and A-scope. 7.2.1 Single Frequency Display The single frequency display shows either the low-frequency or high-frequency picture on all the screen. -
Page 146: Dual Frequency Display
7. Fish Finder 7.2.2 Dual Frequency Display The dual frequency display provides both low- and high-frequency pictures. Use the dual frequency display to compare the same picture with two different sounding fre- quencies. The low-frequency picture is on the left, and the high-frequency is on the right. -
Page 147: Zoom Displays
7. Fish Finder 7.2.3 Zoom Displays How to activate a zoom display Push the RotoKey to show the soft controls. Select [Zoom], [Btm Lock], [Btm Zoom] or [Mkr Zoom] as necessary. Select [Off] to quit the zoom display and go to the single frequency display. - Page 148 7. Fish Finder Bottom-zoom display The bottom-zoom display expands the bottom and the fish near the bottom according to the zoom range selected on the [Fish Finder] menu. This display helps you find the density of the bottom. A bottom displayed with a short echo tail normally indicates the bottom is soft (sand bottom, etc.).
-
Page 149: A-Scope Display (Display Only)
7. Fish Finder 7.2.4 A-scope Display (display only) The A-scope display appears at the right 1/16 of the screen and is available in any fish finder mode. This display shows the echoes at each transmission with the amplitudes and tone in balance with their intensities. This display helps you identify possible fish species and bottom structure. -
Page 150: Automatic Fish Finder Operation
7. Fish Finder Automatic Fish Finder Operation Your fish finder can be adjusted automatically to let you do other tasks. 7.3.1 How the Automatic Fish Finder Operates The automatic fish finder function automatically adjusts the gain, clutter, TVG and echo offset and range (ETR series only). The main features of the automatic mode are as shown below. -
Page 151: Manual Fish Finder Operation
7. Fish Finder Manual Fish Finder Operation Use the manual operation to see schools of fish and the bottom echo with a fixed gain setting. The gain, range and range shift functions let you select the depth you can see on the screen. -
Page 152: How To Adjust The Gain
7. Fish Finder 7.4.4 How to Adjust the Gain The gain controls how echoes of different strengths are displayed. Set the gain to show a slight amount of noise on the screen. Increase the gain for greater depths and lower then gain for shallow waters. Gain too high Gain proper Gain too low... -
Page 153: Picture Advance Speed
7. Fish Finder Picture Advance Speed The picture advance speed controls how quickly the vertical scan lines move across the screen. A fast advance speed expands the size of a school of fish horizontally on the screen. A slow advance speed shortens the school of fish. Use a fast advance speed to see the hard bottom. -
Page 154: How To Reduce Interference
7. Fish Finder How to Reduce Interference Interference from other fish finders and electrical equipment appears on the screen as shown in the illustration. When these types of interference appear on the screen, use the interference rejector to reduce the interference. Three or four levels are available according to type of network sounder. -
Page 155: How To Measure Depth, Time Between Locations
7. Fish Finder How to Measure Depth, Time Between Locations You can measure the depth to an object with the VRM. Also, you can measure the time from the right edge to a location. For example, you can measure how many minutes ago an echo appeared. -
Page 156: How To Erase Weak Echoes
7. Fish Finder How to Erase Weak Echoes Sediment in the water and reflections from plankton appear on the display in low-intensity colors. You can erase these weak echoes with [Color Erase] from the [Fish Finder] menu. Weak echoes 1. Press the MENU key to open the menu. 2. -
Page 157: How To Balance Echo Strength
7. Fish Finder How to Balance Echo Strength A school of fish at a depth deeper than a school of equal strength in shallow water ap- pears in weaker colors. This condition is caused by the movement attenuation of the ultrasonic wave. -
Page 158: White Marker
7. Fish Finder 7.10 White Marker The white marker displays the selected echo color in white. Use this feature to help you separate fish near the bottom from the bottom echo. 1. Press the MENU key to open the menu. 2. -
Page 159: How To Activate Or Deactivate An Alarm
7. Fish Finder 5. Use the RotoKey to set the start depth. Rotate the knob to set numeric then push the key to validate the setting. End depth Start depth (from sea surface) (from bottom) Alarm range Alarm range marker End depth (from sea surface) Start depth (from bottom) -
Page 160: Accu-Fish
7. Fish Finder 7.12 ACCU-FISH The ACCU-FISH feature estimates the length of each fish and shows a fish symbol and depth value or fish length. The information given by this feature is for only refer- ence purposes. ACCU-FISH uses the high- and low-frequency echoes that return at the center of the transducer beam to calculate the length of a fish. -
Page 161: How To Set Accu-Fish
7. Fish Finder 7.12.1 How to Set ACCU-FISH 1. Press the MENU key to open the menu. 2. Open the [Fish Finder-DFF/FCV] menu. 3. Use the RotoKey to select [Measurement]. Use the RotoKey to select [Accu Fish] to activate (Accu Fish) or deactivate (Off) ACCU-FISH. -
Page 162: Fish Size Correction
7. Fish Finder 7.12.2 Fish Size Correction The fish size shown on the display can be different from the true fish. If the size is wrong, add an offset to the measured value to get accurate indication on the screen. Use the RotoKey to select [Fish Size Correction] on the [Fish Finder-DFF/FCV] menu. -
Page 163: Fish Finder Menu Operation
7. Fish Finder 7.14 Fish Finder Menu Operation This section describes the fish finder functions not described in previous sections. 7.14.1 Fish Finder-General Menu Fish Finder Source: Select the name of the network fish finder connected to the net- work. Day Background Color: Select the background color for use during daylight hours. -
Page 164: Fish Finder-Dff1, Dff3/Fcv, -Etr-6/10N And -Etr-30N Menus
7. Fish Finder 7.14.2 Fish Finder-DFF1, DFF3/FCV, -ETR-6/10N and -ETR-30N Menus Range Setup ETR-6/10N, ETR-30N sub menu Note: The section belows provides only descriptions not previously mentioned. DFF1, DFF3/FCV sub menu DFF1, DFF3/FCV, ETR-6/10N, ETR-30N Picture Advance: See "7.5 Picture Advance Speed" on page 7-10. Bottom Range Shift Area: Select the area where to show the bottom echo, when Auto Range is active. - Page 165 To remove this problem, the satellite compass sends pitch and roll data to the fish finder to adjust the Tx and Rx beams. This function requires a FURUNO satellite compass and a DFF series net- work fish finder.
-
Page 166: Navnet 3D And Lcd Color Sounder Fcv-1150
7. Fish Finder 7.15 NavNet 3D and LCD Color Sounder FCV-1150 The FCV-1150 can be connected to your NavNet, and some functions can be con- trolled from the NavNet. The table shown below shows those features that can be con- trolled from the NavNet. - Page 167 7. Fish Finder Controllable from Function Remarks NavNet RX band Shift Speed of sound Set at FCV-1150 Split range Tx line display, Tx line area TX power On/Off only TX pulse length TX rate Water temp. graph White marker Zoom marker Zoom mode Zoom range 7-24...
-
Page 168: Interpreting The Display
7. Fish Finder 7.16 Interpreting the Display Color bar The color bar at the left edge of the display shows the range of colors used to display different echo strengths. The top color (reddish-brown) is the strongest color and the lower colors the weaker colors. - Page 169 7. Fish Finder Rugged Color difference bottom Second bottom echo Bottom characteristic The characteristic of the bottom is known from the intensity and length of the bottom tail. To find the bottom characteristic, use a long pulse length and normal gain. For the hard and rough bottom, the bottom echo is reddish-brown with a long tail.
- Page 170 7. Fish Finder Density of a school of fish If two schools appear with the same color at different depths, the one in deeper water is denser because the ultrasonic wave attenuates as it propagates and the school of fish in deep water tends to be displayed in a weaker color. Less Reddish Strong (Sparse echo)
- Page 171 7. Fish Finder Surface noise When the sea is rough or the vessel moves over a wake, surface noise can appear at the top of the screen. Surface noise Air bubbles in the water When the sea is rough or the vessel makes a quick turn, there can be blank spots in the bottom echo.
-
Page 172: File Operations
Note 1: The Power LED flashes when the SD drive is being accessed. DO NOT re- move the card while the LED is flashing, to prevent loss of data or damage to the card. Note 2: User setup items cannot be imported or exported between MFD8, MFD12 and MFDBB (and vice versa). -
Page 173: Files Menu Description
8. File Operations 8.2.1 Files Menu Description Import Points & Routes Import points and routes from an SD card. When you import points and routes from an SD card, all points and routes currently stored in the MFD are replaced with those on the SD card. -
Page 174: How To Export Tracks, Points And Routes, User Setup
8. File Operations How to Export Tracks, Points and Routes, User Setup When the capacity for track is reached, the oldest track is erased to clear space for new track. Points and routes cannot be entered when their related memories are full. If you need to save track, points and routes permanently, save them to a SD card. -
Page 175: How To Import Tracks, Points And Routes, User Setup
8. File Operations How to Import Tracks, Points and Routes, User Setup You can import tracks, points, routes and user setup to the hard disk of a NavNet unit. Use this feature to use the same data across the NavNet network. 1. - Page 176 8. File Operations 5. Use the RotoKey to select the file to delete then push the RotoKey. 6. Rotate the RotoKey to select [Yes] then push the key to delete the selected file. 7. Press the MENU key to close the menu.
-
Page 177: How To Update The System Software
2. Open the [Files-General] menu and select [Request Update File]. The SD card confirmation screen appears after you push the RotoKey. 3. Select Yes then push the RotoKey. The card is formatted, the file FURUNO Sys- tem Diagram.sys is created and saved to the SD card. This may take several min- utes. - Page 178 8. File Operations 5. The data in the SD card is copied to the hard disk of the NavNet 3D. When the copy is completed. the software uploader is automatically updated. The message “Now Initializing” appears. It may take several minutes before you move to the next step.
- Page 179 8. File Operations...
-
Page 180: Camera/Video
Camera/Video The camera/video function allows you to use your unit to play back images from a vid- eo player, on-board camera, network camera or DVD player. Network camera images can be seen across the NavNet 3D network. A video signal can be seen only on the MFD that receives the video signal. -
Page 181: How To Set The Video Display
9. Camera/Video How to Set the Video Display 9.2.1 How to Select the Input Source You can select the input source from the menu or with the RotoKey. Below is the pro- cedure with the RotoKey. 1. Activate the camera mode then push the RotoKey. 2. -
Page 182: How To Set The Cycle Period
9. Camera/Video 9.2.3 How to Set the Cycle Period The default cycle period is five seconds. The cycle times of 10 and 30 seconds are available also. 1. Press the MENU key. 2. Open the [Camera] menu. 3. Use the RotoKey to select [Time Interval]. 4. -
Page 183: How To Adjust The Video Image
9. Camera/Video How to Adjust the Video Image 1. Long-push the RotoKey to show the soft controls that adjust the video signal. Soft controls for adjustment of video (Brightness, Colors, Contrast) 2. Rotate the RotoKey to select [Brightness], [Colors] or [Controls] then push the key. -
Page 184: 10. Instrument Display
10. Instrument Display The instrument display gives you a maximum of five navigation and environment dis- plays: • Engine • Steering • True wind • Apparent wind • True wind and weather In the default arrangement, the instrument display is available when the number of hot pages (display selections) is nine or ten. -
Page 185: How To Prepare The Hot Page
10. Instrument Display 10.1 How to Prepare the Hot Page The instrument display is available when the number of hot pages in the display selection window is nine or ten. Select the number of hot pages to display as in the procedure shown below. -
Page 186: How To Select An Instrument Display
10. Instrument Display 10.3 How to Select an Instrument Display You can show engine, steering, wind or wind/weather data in the instrument display if you have the related sen- sors. Select the data to display as follows: 1. Activate the instrument display then push the CTRL key to select the instrument display with the yellow cursor. -
Page 187: Engine Display
10. Instrument Display 10.4.2 Engine Display The engine display shows the information listed below. The engine must output engine data in NMEA 2000 format to show the engine data. • Abnormal engine temperature and engine trouble lamps • Tachometer • Oil pressure •... -
Page 188: Wind And Weather Display
10. Instrument Display 10.4.3 Wind and Weather Display The wind and weather display shows • Wind direction • Air temperature • Wind chill temperature • Dew point temperature • Barometric pressure • Relative humidity • Wind speed and direction Analog true wind direction 64.40 temperature Wind chill... -
Page 189: True Wind Display
10. Instrument Display 10.4.4 True Wind Display The true wind display provides digital and analog indications of true wind speed and angle, and heading. Analog true wind angle Analog and digital true wind speed Heading Digital true wind angle Angle (S: Starboard, P: Port) 10.4.5 Apparent Wind Display The apparent wind display provides digital and analog indications of apparent wind... -
Page 190: 11. Sirius Weather Receiver
U.S. Information provided by the Sirius Marine Weather service is advisory in nature only. You, the customer, agree to release FURUNO ELECTRIC CO., LTD., Sirius Satellite Radio Inc., Navcast Inc. and WSI Corporation from any problems that occur from this service. -
Page 191: Weather Icons
11. Sirius Weather Receiver 11.2 Weather Icons The table below shows the weather icons that appear on the Sirius Satellite Weather display. You can show or hide these icons from the [Weather] menu. Color Icon Meaning Pink Storm cast Dark yellow (recorded in last 0-5 min.) Medium yellow (recorded in last 5-10 min.) Lightning Light yellow (recorded in last 10-15 min.) -
Page 192: Weather Menu
11. Sirius Weather Receiver 11.3 Weather Menu The [Weather] menu adjusts the following weather-related items: • Overlay transparency • Color scale • Weather radar (US or Canada) • Standard weather data • Advanced weather data 11.3.1 How to Display the Weather Menu 1. -
Page 193: Weather Menu Description
11. Sirius Weather Receiver 11.3.2 Weather Menu Description You can show sea surface temperature (SST), wave forecast and wind forecast to- gether on the full screen display. In the split window configuration, only one can be displayed on either screen. Only one of the three can be shown in “plain color” when all three are displayed, and SST has priority. - Page 194 11. Sirius Weather Receiver Precipitation indication on CANRAD Weather radar color Level (mm per hour) Transparent (low precipitation) 0.00 to 0.20 mm/hr Light green 0.21 to 1.00 mm/hr Medium green 1.01 to 4.00 mm/hr Dark green 4.01 to 12.00 mm/hr Yellow 12.01 to 24.00 mm/hr Orange...
- Page 195 11. Sirius Weather Receiver Sea Surface Temperature This data layer shows the temperature of the sea surface in shades of red and blue. Lower temperatures are in blue. Surface Features/Pressure Activate this feature to get surface pressure with meteorological symbols. Put the cur- sor on a surface pressure icon to show the name of the surface pressure.
- Page 196 11. Sirius Weather Receiver Advanced Weather Data Storm Tracks The storm track icons show major storms in your area. These storms include tropical disturbances, depressions, storms and cyclones, hurricanes, typhoons and super ty- phoons. These symbols are displayed in three different colors: Grey, historical; Red- current, and Orange, forecast.
- Page 197 11. Sirius Weather Receiver Storm Cell Cast You can find the direction and speed of a storm when you put the cursor on the icon. For additional information, press the left-click button. Simple storm cell cast information Detailed storm cell cast information 11-8...
- Page 198 11. Sirius Weather Receiver Lightning The lightning icons show where lightning has hit, within the last 5, 10 and 15 minutes. The fill color of the icon indicates when the lightning hit occurred. See the table below for color and period. The number of lightning bolt markers indicates the number of times lightning has hit.
- Page 199 11. Sirius Weather Receiver City Forecasts The city weather forecasts are available where city icons are shown. For simple infor- mation, put the cursor on the city icon ( ). For additional information, push the left- click button. Simple city information Detailed city information 11-10...
- Page 200 11. Sirius Weather Receiver Buoys You can check the historical or current weather information at buoys. For simple infor- mation, put the cursor on the buoy icon ( ). For additional information, press the left-click button. Simple buoy information Scroll for more data Detailed buoy data 11-11...
-
Page 201: Weather Reports
11. Sirius Weather Receiver 11.4 Weather Reports Marine zone forecasts, marine warnings, tropical information and weather alerts are sent to your MFD. You can see those items on the [Weather] menu when you open the related sub menu. Sirius sends warning messages to tell you about bad weather. You can see these messages when you open the [Weather-Alert] Box menu. -
Page 202: Marine Warning
11. Sirius Weather Receiver 11.4.2 Marine Warning Display the marine warnings (US coastal or near shore). NO REPORT AVAILABLE FOR THIS MARINE ZONE. 11.4.3 Tropical Weather Statement Below is an example of a tropical weather statement. 11-13... -
Page 203: Marine Watchbox
11. Sirius Weather Receiver 11.4.4 Marine WatchBox The message "Weather Alarm, Press Menu Button." appears on the status bar when a tornado or thunderstorm warning is received. To see the information about the warn- ing, press the MENU key to open the [Alert Box] in the [Weather] menu. The message is opened in the [Alert Box]. -
Page 204: Sirius Satellite Radio
11. Sirius Weather Receiver 11.5 Sirius Satellite Radio The Sirius satellite radio provides round-the-clock, 100% commercial-free music from every genre plus sports, news, talk and comedy. To show the Sirius satellite radio screen, long-push the DATA/VOL key. • Use the ScrollingPad to select a channel as shown below. •... - Page 205 11. Sirius Weather Receiver 11-16...
-
Page 206: Automatic Identification System (Ais)
12. Automatic Identification System (AIS) 12.1 AIS Introduction AIS is a system that continuously transmits the identification and position of your ves- sel to other nearby vessels. All such vessels also receive data from other AIS equipped vessels and display their positions and other relevant information. The AIS broadcasts this information over a VHF transceiver. -
Page 207: Ais Target Symbols
12. Automatic Identification System (AIS) 12.3 AIS Target Symbols Symbol Target type Color Description AIS target Light- COG is marked on the symbol with a solid blue or line and arrow. Green* Dangerous AIS The CPA and TCPA of a target put the tar- target get on a collision course. - Page 208 12. Automatic Identification System (AIS) 4. Use the RotoKey to set the alarm value at [Proximity AIS Target Alarm Value]. 5. Press the MENU key to close the menu. 12-3...
-
Page 209: How To Ignore Ais Targets
12. Automatic Identification System (AIS) 12.5 How to Ignore AIS Targets In the default setting, all AIS targets within 12 nm from your vessel are shown on the display. When the screen becomes full of AIS targets, you can remove some of the targets if you indicate a different display range. -
Page 210: How To Display Target Data
12. Automatic Identification System (AIS) 12.6 How to Display Target Data The name, course, speed, range, bearing, etc. of an AIS target can be shown on the display. For simple data, put the cursor on an AIS target. For detailed data, put the cursor on the target then push the left-click button. - Page 211 12. Automatic Identification System (AIS) 12-6...
-
Page 212: 13. How To Adjust Settings
13. How to Adjust Settings After you understand the basic operating procedures of your equipment, you can set the equipment according to your needs. • Set the equipment according to your system configuration. • Change how the equipment operates and displays information. All the adjustments are done from the menu. -
Page 213: Rotokey
13. How to Adjust Settings 13.1 RotoKey The user can select how many soft controls to make available with the RotoKey in the chart plotter, radar, fish finder and camera modes. The three quantities are basic, standard and full. If those quantities do not meet your requirements, a “custom” set of keys is available also. - Page 214 13. How to Adjust Settings Control label Level 1 Function Basic Standard Full Skip WPT Skip waypoint on a route Cancel Nav Stop following a route. Reverse Reverse route following direction. Show Show or hide routes now dis- played. Animate Animate Animate weather or tidal current forecast.
- Page 215 13. How to Adjust Settings Control label Level 1 Basic Standard Full Targets Control ARPA and AIS targets. ARPA Show or hide ARPA display. Show or hide AIS display. History Show or hide history display. Cancel All Stop tracking on all ARPA targets. Clear Lost Clear lost ARPA target.
-
Page 216: How To Select The Rotokey Set To Use
13. How to Adjust Settings Control label Level1 Basic Standard Full IP camera 1 IP camera 2 IP camera 3 IP camera 4 Vid Cycle Select video switching cycle. Cycle 1 Select video switching cycle 1. Cycle 2 Select video switching cycle 2. Video ID Show or hide video ID. -
Page 217: How To Set The Rotokey
13. How to Adjust Settings 13.1.2 How to Set the RotoKey If the Basic, Standard or Full sets of soft controls are not acceptable, you can select the soft controls to use on the [My NavNet] menu. To use your selections, set RotoKey in the [My NavNet-General] menu to [Custom]. -
Page 218: Data Boxes
13. How to Adjust Settings 13.2 Data Boxes Section 1.14 shows how to select the data to show in the data boxes. This section shows you set the boxes from the [DataBox] menu. 13.2.1 How to Set the Data Boxes 1. - Page 219 13. How to Adjust Settings 4. Select how to show the data in the data box. Off: Turn off the data. Single: Display data individually. Split: Display two items per box. For example, SOG and COG show both of those data in one box.
-
Page 220: How To Show Or Hide All Data Boxes
13. How to Adjust Settings 13.2.2 How to Show or Hide all Data Boxes You can show or hide all data boxes. Select [DataBox Display] at the bottom of the [DataBox-General] menu then push the RotoKey to show or hide all data boxes. You can also hide or show the data boxes with the DATA/VOL key. -
Page 221: How To Set A Hotpage
13. How to Adjust Settings 13.3.2 How to Set a Hotpage This section shows how to set a hotpage. The procedure shown below describes how to put the radar, chart plotter and fish finder displays in a three-way split screen. 1. - Page 222 13. How to Adjust Settings 6. The yellow rectangle moves to the bottom-right 1/4 screen. Rotate the RotoKey to select a display (for example, the fish finder display) then push the key. Your arrangement of displays appears on the screen and the display selection window is updated according to your arrangement.
-
Page 223: Global Menu
13. How to Adjust Settings 13.4 Global Menu The [Global] menu has two sub menus for general setting of the equipment. The [Glo- bal-General] menu includes font size, brilliance settings, position format, etc. The [Global-Units] menu sets units of measurement for range, depth, height, speed, etc. 13.4.1 Global-General Menu The [Global-General] menu is where you can turn off the key beep, and select position... - Page 224 13. How to Adjust Settings Global-General menu description Menu item Function Options Key Beep Activate or deactivate the key beep which sounds ON, OFF when a key (incl. RotoKey) is operated. Font Size Select the font for all indications, menus and the Medium, Large like.
-
Page 225: Global-Units Menu
13. How to Adjust Settings 13.4.2 Global-Units Menu The [Global-Units] menu lets you select units of measurement for range, length, depth, height, sea surface temperature, speed, wind speed, air pressure, oil /boost pressure, and volume. Description of Global-Units menu Menu item Options Range (Long) Nautical mile, kilometer, mile... -
Page 226: System Menu
|_ [COM1]Port1 |_ [COM2]Port2 |_ [COM3]Port3 DRS-RADOME NavNet 3D MFD12 GPS Status: Show the status of GPS satellites. See “14.5 GPS Status Display.” Installation Wizard: Start the Installation Wizard to install the system. See the Instal- lation Manual. Reset Default Settings: Restore all default settings for your system. -
Page 227: System-Calibration Menu
13. How to Adjust Settings 13.5.2 System-Calibration Menu The [System-Calibration] menu lets you enter the offsets for external sensors (speed, wind, temperature) to show true values on the display. Draft: In the default setting, the fish finder shows the depth from the transducer. For depth from the surface, set the draft of your vessel here. -
Page 228: System-Radar Menu
13. How to Adjust Settings 13.5.3 System-Radar Menu The [System-Radar] menu provides the radar functions like manual tuning, tx sector area (area of no transmission) and pulse length. Manual Tuning: If you require manual tuning, do the following: 1. Use the RANGE key to select the 24-mile range. 2. -
Page 229: System-Dff/Fcv Menu
13. How to Adjust Settings 13.5.4 System-DFF/FCV Menu Transmission: Turn the transmission on or off. Leave on normally. Transmission Power: Interference can appear on the screen when the fish finder on your vessel and another vessel have the same TX frequency. To prevent this interfer- ence, lower your TX power and ask the other vessel to lower their TX power. -
Page 230: System-Etr-6/10N Menu
13. How to Adjust Settings echo in the bottom lock display, lower the bottom level to erase the vertical lines. If you can not identify the fish near the bottom from the bottom echo, increase the bottom level. For the DFF1, set both of these items to “-20”. External KP: Turn on to sync with external keying pulse. -
Page 231: System-Etr-30N Menu
13. How to Adjust Settings 13.5.6 System-ETR-30N Menu Stc HF (LF): Delete unnecessary echoes (plankton, air bubbles, etc.) near the sur- face. Use this feature to clear the surface of unnecessary echoes to look for surface fish. The setting range is 0-10, and 0 is Off. “10” deletes unnecessary echoes from the surface to approximately 16 ft. -
Page 232: My Navnet-General Menu
13. How to Adjust Settings 13.6 My NavNet-General Menu This section provides the information for the items in the [My NavNet] menu that are not described in other chapters. 1950055-XX.XX My NavNet Reminder The [My NavNet Reminder] tells you to check your [My NavNet] settings every 10 times you turn on the power. - Page 233 13. How to Adjust Settings To control the demo mode from the chart plotter display: 1. Right-click the chart plotter display to show the pop-up menu. 2. Use the RotoKey to select [Manual Mode] then push the key to activate or deac- tivate the demo mode.
-
Page 234: How To Control Charts
13. How to Adjust Settings 13.7 How to Control Charts This section shows you how to control your chart catalog, from the [Chart-Data Cata- log] menu. From this menu you can see, update, add and delete charts. 13.7.1 How to View Your Charts 1. -
Page 235: How To Update Charts
13. How to Adjust Settings 13.7.2 How to Update Charts You can update the charts that you have on your hard disk from the NavNet web site www.navnet.com. Follow "How to copy system information to a SD card" on page 8-6 then do the following. -
Page 236: How To Add A Chart
13. How to Adjust Settings 13.7.3 How to Add a Chart You can purchase the charts for your area from the NavNet web site www.nav- net.com. Download a chart to a SD card then follow the instructions in the procedure on this page. - Page 237 13. How to Adjust Settings This page is intentionally left blank. 13-26...
-
Page 238: 14. Maintenance, Troubleshooting
14. Maintenance, Troubleshooting This chapter has information about maintenance and troubleshooting that the user can follow to care for the equipment. NOTICE WARNING Do not apply paint, anti-corrosive ELECTRICAL SHOCK HAZARD Do not open the equipment. sealant or contact spray to plastic parts or equipment coating. -
Page 239: Fuses
The Magnetron When the life of the magnetron is reached, the targets do not appear on the radar dis- play. If long-range performance appears to have decreased, contact a FURUNO agent or dealer about replacement of the magnetron. Magnetron information... -
Page 240: Troubleshooting
14. Maintenance, Troubleshooting 14.4 Troubleshooting This section provides simple troubleshooting procedures which the user can follow to restore normal operation. If you cannot restore normal operation, do not check inside the unit. Have a qualified technician check the equipment. 14.4.1 General Troubleshooting Problem Remedy... -
Page 241: Chart Plotter Troubleshooting
14. Maintenance, Troubleshooting 14.4.3 Chart Plotter Troubleshooting Problem Remedy Position is not fixed. Check that antenna connector is fastened and navigator is cor- rectly connected. The track of your vessel is not Check that the track is turned on. (Put the cursor on the boat icon plotted. -
Page 242: Gps Status Display
14. Maintenance, Troubleshooting 14.5 GPS Status Display The GPS status display shows the signal strength and location in the sky for each GPS satellite received. 1. Open the [System-General] menu. 2. Click the [GPS Status] button to show the GPS status display. 3. - Page 243 14. Maintenance, Troubleshooting This page is intentionally left blank. 14-6...
-
Page 244: Appendix 1 Menu Tree
APPENDIX 1 Menu Tree Ship & MENU General COG/SOG Predictor (On, Off) Track COG/SOG Predictor Time (0m10s, 0m30s, 1m00s, 2m00s, 5m00s, 10m00s, 15m00s, 30m00s) Heading Line (On, Off) Track Interval (Distance, Time) Distance Interval (00.01 - 99.99 (nm)) Time Interval (00m5s - 99m59s) Track Thickness (Thin, Medium, Thick) Define Track Fixed Color (White, Blue, Purple, Cyan, Green, Yellow, Red) - Page 245 APPENDIX 1 Menu Tree Chart Photo Transparency on Water (0 - 80%) General Popup Information (On, Off) Aerial View Bathymetry (On, Off) Depth Color Transparency (0 - 80%) Auto Depth Color Scale (On, Off) Depth Color Scale Style (Classic Hue, Blue Hue) Manual Depth Color Range (0 - 9000 ft) 3D Exaggeration (Very Low, Low, Medium, High, Very High) 3D Pan/Tilt Mode (On, Off)
- Page 246 APPENDIX 1 Menu Tree Radar General Radar Source Echo Color (True, Green, Yellow) Echo Transparency for Overlay (0% - 80%) Day Background Color (Black, Dark Blue, White) Night Background Color (Black, Dark Blue, White) Own Ship Icon (On, Off) EBL Reference (Relative, True) Sweep Fade (On, Off) Watchman (Off, 5 m, 10 m, 20 m) Echo Trails (True, Relative)
- Page 247 APPENDIX 1 Menu Tree Camera Camera Scrolling Cycle 1 (PINP1, PINP2, IP1, IP2, IP3, IP4) Scrolling Cycle 2 (Same choices as Scrolling Cycle 1.) Time Interval (0m5s, 0m10s, 0m30s) Reset Default Settings Exit Menu Data General Data Box 1 (Off, Single, Split) Data Box 1 Value (Pos, SOG, COG, Depth, SST, Speed Thru Water, Heading, True Wind Speed, True Wind Angle, True Wind Direction, Apparent Wind Speed, Apparent Wind Angle, Velocity Made Good,...
- Page 248 APPENDIX 1 Menu Tree Alarm General Alarm (Off, Internal, External, Internal & External) Speaker Alarm Output (On, Off) Speed-Based Output (On, Off) Speed-Based Output Value (00.0 - 99.9 kt) External Alarm Input (Off, MOB, Save Point) XTE Alarm (On, Off) XTE Alarm Value (000 yd - 999 yd) Anchor Watch Alarm (On, Off) Anchor Watch Alarm Value...
- Page 249 APPENDIX 1 Menu Tree General Global Key Beep (On, Off) Font Size (Medium, Large) Day/Night Mode (Day, Dusk, Night, Sunlight) Day Brilliance (Low, Medium, High) Dusk Brilliance (Low, Medium, High) Night Brilliance (Low, Medium, High) View Angle (Most Upward, Upward, Normal, Downward, Most Upward) Great Circle Navigation (On, Off) Bearing Display (True, Magnetic) Position Format (DDD.dddddd, DD°MM.mmmm, Loran-C, MGRS)
- Page 250 APPENDIX 1 Menu Tree System General Language (English and others) Message Window Dwell Time (0m05s - 1m59s) Connection Diagram GPS Status Installation Wizard Reset Default Settings Exit Menu Calibration Draft (-15.0 ft - +99.9 ft) Speed Through Water (-50% - +50%) Sea Surface Temperature (SST) (-99.9°F - +99.9°F) Wind Damping Time (00 - 99s) Wind Speed Calibration (-50% - +50%)
- Page 251 APPENDIX 1 Menu Tree Memory Display Set Factory Default Radar Select Antenna Set Factory Default Fish Select Fish Finder Finder Set Factory Default Exit Menu My Navnet Reminder (On, Off) General Roto Key (Basic, Standard, Full, Custom) Navnet Hotpage Number (Five, Six, Seven, Eight, Nine, Ten) Boat Icon (Simplified Icon, Commercial Fishing, Sail Boat, Sport Fishing) Demo Mode (Off, External)
- Page 252 APPENDIX 1 Menu Tree Animate (On, Off) Countdown (On, Off) Ruler (On, Off) Tide Graph (On, Off) Sleep Radar Auto Sea Advanced Coastal North Up (On, Off) Head Up Course Up (On, Off) Head Up (On, Off) True Motion (On, Off) Auto Shift (On, Off) Filters Int Reject (On, Off)
- Page 253 APPENDIX 1 Menu Tree Mode HF (On, Off) Fish LF (On, Off) Finder Dual (On, Off) Fishing (On, Off) Auto Cruising (On, Off) Zoom Btm Lock (On, Off) Btm Zoom (On, Off) Mkr Zoom (On, Off) A-Scope (On, Off) * DFF1, DFF3, FCV-1150 only Auto Range* (Off, On) Split Range* HF (On, Off)
- Page 254 FURUNO MFD8 SPECIFICATIONS OF MULTI FUNCTION DISPLAY MFD8 GENERAL Display 8.4-inch color LCD, 170.2 x 128.2mm Resolution 640 x 480 dots (VGA) Indication system Raster-scan, non-interlace, Horizontal: 31.5kHz, Vertical: 60Hz Brightness 700 cd/m typical Display colors 65,536 colors (plotter), 64 colors (echo), 32 colors (radar)
- Page 255 FURUNO MFD8 MDA, MTW, MWV, RMA, RMC, ROT, VDM, VHW, VTG, VWR, VWT, ZDA Output AAM, APB, BOD, BWC/BWR, DBT, DPT, DTM, GGA, GLL, GNS, GTD, HDG, HDT, MTW, MWV, RMA, RMB, RMC, ROT, VHW, VTG, WPL, XTE, ZDA, ZTG...
- Page 256 FURUNO MFD12 SPECIFICATIONS OF MULTI FUNCTION DISPLAY MFD12 GENERAL Display 12.1-inch color LCD, 246 x 184.5 mm Resolution 800 x 600 dots (SVGA) Indication system Raster-scan, non-interlace, Horizontal: 35.1kHz, Vertical: 60Hz Brightness 1,100 cd/m typical Display colors 65,536 colors (plotter), 64 colors (echo), 32 colors (radar)
- Page 257 FURUNO MFD12 MDA, MTW, MWV, RMA, RMC, ROT, VDM, VHW, VTG, VWR, VWT, ZDA Output AAM, APB, BOD, BWC/BWR, DBT, DPT, DTM, GGA, GLL, GNS, GTD, HDG, HDT, MTW, MWV, RMA, RMB, RMC, ROT, VHW, VTG, WPL, XTE, ZDA, ZTG...
-
Page 258: Index
INDEX Numerics Auto shift (radar) ........6-20 Avoidance circle ........4-9 3D display description ..........3-1 exaggeration ........... 3-4 Background color fish finder..........7-20 radar ............6-22 ACCU-FISH Bearing display........13-13 considerations ........7-17 Bearing measurement setting up..........7-18 chart plotter ..........2-7 Adv Wx Data soft control...... - Page 259 INDEX Chart-Vector menu........2-9 Files menu..........8-1 City forecasts ........11-10 Filters soft control........6-19 Clutter (fish finder)........7-9 Fish alarm COG/SOG predictor ........2-6 activate, deactivate ....... 7-16 Color bar ..........7-25 sensitivity..........7-16 Color erase (fish finder)......7-13 setting............
- Page 260 INDEX Light sectors..........2-9 deleting, at points list........4-7 Lightning ..........11-9 deleting, on screen........4-7 Lights ............2-11 depth at time of entry .......4-9 Loran C station........13-13 editing............4-8 Lost target ..........6-31 finding location from Points menu ..4-10 finding on chart........4-10 going to, cursor position ......4-13 Magnetron replacement ......14-2 going to, on-screen point......4-12 Maintenance ..........14-1...
- Page 261 INDEX Routes offset ........... 13-17 active route on radar ......6-21 Stand-by............ 6-1 auto zoom at arrival at point ....5-15 Status bar..........1-12 canceling navigation on from radar ..6-20 STC (fish finder) ........13-21 creating new ..........5-2 Steering display........
- Page 262 INDEX pressure ..........11-6 SST color range ........11-4 Vector chart SST color scale ........11-4 bottom features ........2-11 buoy names..........2-9 SST description........11-6 storm cell cast ........11-8 buoys and beacons ........2-11 storm tracks..........11-7 cautionary areas........2-11 surface features ........11-6 chart color palette........2-9 tropical statement.........11-13 chart data coverage .......2-11 waves forecast ........11-5 chart information ........2-9...
Need help?
Do you have a question about the MFD12 and is the answer not in the manual?
Questions and answers