
Related Manuals for OPHIR vega


Summary of Contents for OPHIR vega
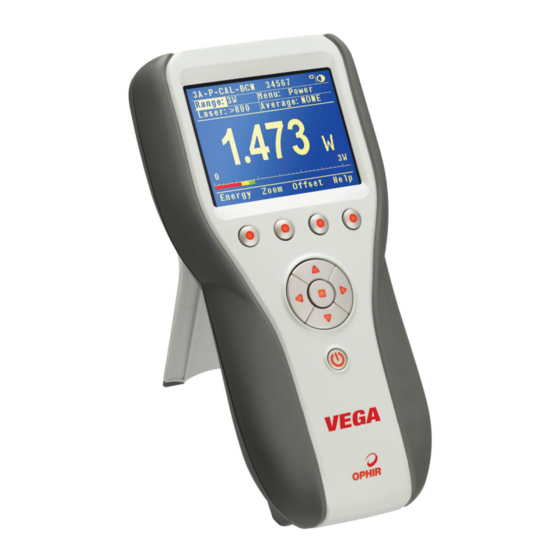
- Page 1 VEGA VEGA LASER POWER/ENERGY METER USER MANUAL OPHIR OPTRONICS www.ophiropt.com/photonics...
-
Page 2: Table Of Contents
Chapter 4. Operation with Thermopile Absorber Sensors ............36 4.1 Thermopile Absorber Sensors ........36 4.2 Selecting Settings from the Vega Screen ....37 4.3 Startup and Configuration of Defaults ....38 4.4 Power Measurement ..........40 4.5 Energy Measurement ..........49... - Page 3 5.2 Setting up the PD300 to display the user's chosen wavelengths ............ 60 5.3 Startup Defaults ............61 5.4 Selecting Settings from the Vega Screen ....62 Chapter 6. Operation with Pyroelectric Sensors . 68 6.1 Pyroelectric & Photodiode Energy Sensors ... 68 6.2 Selecting Settings from the Vega Screen ....
- Page 4 9.2 Calibration of Photodiode type Sensors ....96 9.3 Calibration of Pyroelectric type Sensors ....98 9.4 Error Messages ............101 9.5 Troubleshooting ............102 9.6 Maintenance ............. 104 Chapter 10. Vega Specifications ..... 105 10.1 System/Meter Specifications ....... 105 10.2 Sensor Specifications ..........106...
-
Page 5: Chapter 1. Introduction: How To Use This Manual
This manual tells you what you need to know to make full use of the Vega for all your laser measurement needs. It includes a "Quick Reference", (Chapter 2) to allow you to perform basic measurements immediately, without reading the whole manual. -
Page 6: Chapter 2. Qruick Reference
To connect sensor to the Vega Display Insert the 15 pin D type connector of the measuring sensor cable into the socket marked "Head Input" on the rear panel of the Vega display. (See Figure 2.1) 12VDC AN OUT HEAD INPUT USB/RS232 OUTPUT Figure 2.1... -
Page 7: Functions With No Sensor Connected
Figure 2.2 2.2 Functions with no Sensor Connected 2.2.1. Turning on and off. To switch the Vega on: Briefly press the on/off switch. (Figure 2.2). The unit will switch on, and the display will appear. Note: To work with a sensor, the sensor must be plugged in... - Page 8 To toggle the state of the backlights on and off: The backlight for the Vega’s LCD can be configured to toggle between full and partial illumination. Similarly, the keypad lighting can be configured to toggle between on and off. This toggling will be performed by briefly pressing the on/off switch after the Vega has been switched on.
- Page 9 Vega startup language, the way to switch back to English is: a. Disconnect the sensor from the Vega. b. Turn the Vega off and on again. You will reach the instrument setup screen (titled “head disconnected” in Japanese).
-
Page 10: Thermal Sensors
3. Connect the USB communication cable to the Vega and the PC. 4. Using the StarLab software press "select device". 5. Select Vega. The device name will be highlighted in blue. 6. Select "upgrade Vega". 7. Browse and select the file N2AXXX.BIN, where XXX is the latest firmware version of the Vega. - Page 11 To set type of laser being used With sensors with fixed wavelengths: 1. While the Vega is off, plug in the sensor then switch it on again. 2. Press the navigation keys until "Laser" is highlighted. Press the Enter key and select the appropriate laser wavelength.
- Page 12 2. To go from the energy measurement screen to power measurement, press “Power”. 2.3.2. Setting and Saving the Startup Configuration 1. Turn on the Vega with the sensor connected, select “Menu” and enter. Select “Configure” and enter. 2. With the navigation keys select “Startup mode”.
- Page 13 Table 5. and Table 6. in Chapter 10. Otherwise, there is a risk of damaging the absorber. To simulate an analog needle display on the Vega: 1. Select “Menu” and enter. Select “Needle” and enter. The display will now show a simulated analog needle type display.
- Page 14 Note that the range will be displayed in the lower right corner of the main display. 4. When the Vega screen flashes "READY," on and off, fire the laser. See Section 4.5 for full details. To save configuration: 1.
-
Page 15: Photodiode Sensors
2.4 Photodiode Sensors 2.4.1. Selecting Wavelengths 1. While the Vega is off, plug in the sensor then switch it on again. 2. From the main measurement screen, press "Laser" to select the correct laser wavelength. If you want to save this new wavelength as the startup default, press “Save”... - Page 16 Enter key. (This choice is saved in the instrument and not the sensor so the Vega will start up from the screen selected for all sensors). 4. Select “Power Range” and choose the manual power range you wish to be the default or choose autorange or dBm.
-
Page 17: Pyroelectric Sensors
If you have zeroed it against a different type of meter, then a different value has been saved and when used with a Vega again you should zero it again. - Page 18 “Save” before exiting. 2.5.4. Setting Startup Configuration 1. Turn on the Vega with the sensor connected, select “Menu” and enter. Select “Configure”. 2. With the navigation keys select “Startup Mode”, press the Enter key and select “Power”...
- Page 19 Set the threshold to a high enough value that false triggering does not occur. Ophir also offers a shock absorbing mounting post...
- Page 20 "Power". 2. To go from the main power measurement screen to energy measurement, press "Energy". 2.5.5.2. To use the Vega to measure Laser Energy and Frequency 1. In measurement mode, verify that the units are mJ, µJ etc.
- Page 21 3. To reset the reading to zero before another reading, press "Reset". 4. To return to the main screen and press “Energy”.
-
Page 22: Chapter 3. The Vega Display Unit
The Vega can graph power or energy vs. time. It displays power measurements in both digital and analog form at the same time and also has a needle type display. It will also autorange, so you do not have to set scales;... -
Page 23: Smart Connectors
See section 3.6.5 for details When no sensor is plugged in and the Vega is turned on, the display indicates "Head Disconnected" and gives the user the opportunity to change the baud rate, re-zero the instrument, and set the real time clock or other features. - Page 24 Key Functions The Vega has certain conventions as to the meaning of standard key strokes and these are as follows: Highlighted item: The highlighted item is the item that is presently active. Navigation Keys: These buttons move to the next active item leftwards, rightwards.
-
Page 25: Power Up And Shut Down
3.4 Power Up and Shut Down Figure 3.1... -
Page 26: Vega Functions, Which Are Independent Of Sensor Type
3.5 Vega Functions, which are Independent of Sensor Type When no sensor is connected to the Vega and it is turned on, the message "Head Disconnected" appears. In this mode, the user can adjust the startup screen, either the standard power/energy screens or other specialized screens. - Page 27 Figure 3.1.1 Needle Screen 3.5.2. RS232 Baud Rate If you are using the Vega for RS232 communication with a PC, the baud rate can be set by selecting "RS232 baud" and selecting the appropriate rate then pressing enter save. Unless...
- Page 28 10 times per second with the latest pulse energy. 3.5.4. Clock Settings The Vega is equipped with a real time clock which will show the date and time. This clock will also allow the Vega to query the sensor attached and notify you if the sensor is due for calibration.
-
Page 29: Hardware Functions
3.6.1.1. LCD Backlight The LCD backlight is actually a set of LED’s that illuminate the display from behind. Because the Vega uses a color display, the backlight must be constantly on. It can be operated at full or half intensity (to conserve power consumption). - Page 30 3.6.1.2. Keypad Backlight A set of LED’s is arranged on the Vega’s keypad panel in order to illuminate them when necessary. Additionally, the Vega can be configured to toggle the keypad lighting on/off.
- Page 31 PC. The Unit is supplied with two cables, each with a 7 pin DIN plug on one end mating with the Vega and either a USB or 9 pin D RS232 connector on the other side. When you wish to operate...
- Page 32 4.4.2.6.1 for details of communication with PC. 3.6.5. Head Disconnect / Connect Recognition As of ROM version 1.96, the Vega display will recognize if a sensor had been connected or disconnected while the device is powered on. If such an event happens, a warning screen will be displayed for 3 seconds, after which the Vega will restart itself in its new configuration.
-
Page 33: Gui And Keypad Settings
Enter. 5. Repeat until all settings are adjusted. Press Exit when finished 3.7.1. Keypad Lighting The Vega’s keypad lighting can be set to one of the following settings: On: Keypad illumination constantly on. Off: Keypad illumination constantly off. - Page 34 Choose one of the monochrome schemes for use with protective goggles that filter out visible wavelengths. Screen captures of the Vega in this manual are shown in the various color schemes. 3.7.3.1. Full Color The main measurement displays can be set to one of ...
- Page 35 These color schemes apply to all of the screens. All color-enhanced features of the Vega will not be functional in any of the monochrome screens The schemes that can be selected are as follows: ...
- Page 36 “Changing”, then the color of the bargraph and the digital readout changes as a function of percentage of full scale. For example, if the reading is less than 30% of full scale, it will be displayed green. Between 30% and 60% it will be displayed black or white.
-
Page 37: Chapter 4. Operation With Thermopile Absorber Sensors
The display unit amplifies this signal and indicates the power level received by the sensor. At the same time, signal processing software causes the display unit to respond faster than the thermal rise time of the detector disc, thus reducing the response time of the Vega. -
Page 38: Selecting Settings From The Vega Screen
This provides overlap (hysteresis) to keep the Vega from flipping back and forth when reading close to the end of the scale. To choose auto range, select “Range”, enter, choose “AUTO” then enter again. If you wish the Vega to be in... -
Page 39: Startup And Configuration Of Defaults
4.3 Startup and Configuration of Defaults If you are planning to do measurements of the same type most of the time, you can set up the Vega so that it automatically starts up in the measurement mode desired. Since these settings are saved in the sensor’s "smart connector", you can save different settings for... - Page 40 “Exit” without save and the changes will be saved until the Vega is switched off only. 9. Switch the Vega off then on by means of the on/off switch. (See Figure 3.1). The Vega will enter the mode of operation last saved with the "Configure" operation.
-
Page 41: Power Measurement
4.4.1. Power Measurement, Basic Operation 1. Switch the Vega on by means of the on/off switch that is found beneath the navigation keypad (See Figure 3.1). The Vega will enter the mode of operation last saved with the "Configure"... - Page 42 The first press will cancel the old value, and the second will activate a new value. If you suspect that the Vega has a permanent zero offset, then disconnect the sensor while it is in the power measurement mode. If the Vega still shows a similar offset even when the sensor is not connected, the instrument’s...
- Page 43 Vega settings. 4.4.2.3.1. To use the Vega to fine tune laser power 1. From the main measurement screen, select “Menu” and enter. Select “Tune” and press the Enter key.
- Page 44 When a laser output is fluctuating or unstable, it is useful to measure the average power over a certain period. The Vega gives you this exclusive feature, allowing averaging over periods varying from 1 second to 1 hour. The average mode works as follows: As soon as the main power measurement screen (See Figure 4.2) is entered and the instrument is set to average...
- Page 45 2/1.5 = 1.33. The screen will also show in small digits the power at which the normalization was done and the present power. To use the Vega to normalize the power: 1. From the main power screen, select “Menu” and enter. Select “Normalize” and enter.
- Page 46 25,000 data points in each file. While measurements are being taken, the Vega will record data until the screen is full or until the reset button is pressed. With the RS232 or USB adapter the data can be read out to PC in real time or later after storage.
- Page 47 For data logging, the instrument has to be in a manual power range. If the sensor is configured for autoranging the, Vega will re-configure it to be in the manual range that is closest to the last set of measurements that were taken.
- Page 48 Figure 4.4 Laser Power vs Time Graph 4.4.2.6.1. Data Storage and Transmission When using thermal and photodiode sensors the data logging period is anywhere from 20 seconds to 600 hours. The number of points stored in the data register is up to 27000 points unless less data is available or a lower Sample Rate has been selected.
- Page 49 1.96 or higher. Data Transmission to PC The data stored in the Vega file system can be transmitted to a PC via RS232 using the Starcom PC package supplied with the Vega (or via USB using the StarLab PC or application).
-
Page 50: Energy Measurement
4.5 Energy Measurement 4.5.1. Setup Switch the Vega on. If it is in power mode, press the left soft key “Energy” to put it into energy mode. The energy mode is manual ranging: enter “Range” and then use the navigation keys to get to the proper range then enter again. - Page 51 4.5.3. Minimum Energy Threshold If the Vega is used in a noisy environment or where there is a high level of background thermal radiation, the instrument may trigger spuriously on the noise or background radiation.
- Page 52 measurements of pulses below about 4 times the threshold level. The factory setting of energy threshold is "Med" for medium. If the unit triggers on noise, set the threshold to "High." If you are measuring small energies and the unit does not trigger, set the threshold to "Low." To set the energy threshold: 1.
- Page 53 Average Energy per Pulse = Average Power / Pulse Repetition Rate For rapidly repeating pulses, you can use one of the Ophir pyroelectric sensors, as long as the pulse energies do not exceed the ratings of the pyroelectric absorbers. The pyroelectric sensors are compatible with the Vega and just have to be plugged in to be used.
- Page 54 “FULL” will be displayed. If you wish to see finer variations in the graph, press the “Zoom” button. 3. When “Reset” is pressed, the Vega is ready to begin a new measurement. If you want to store the data before making a new measurement, see section 4.4.2.6.1 on data storage.
-
Page 55: Advanced Display Screens
Figure 4.7 Energy Log Screen replace 4.6 Advanced Display Screens 4.6.1. Power and Energy Beam Splitter/Attenuator Screens If you have a measurement setup with a beam splitter or attenuator and wish to display the laser power or energy before the splitter or attenuator and not the actual value impinging on the measurement sensor the beam splitter function allows you to do this. - Page 56 Note 2: The attenuation value is stored in the Vega and not the sensor so if it is set, any sensor connected will come up with the value chosen.
- Page 57 4.6.2. Power and Energy Density Screens The Vega gives you the option to measure in units of power and energy density instead of power and energy. You input the beam size and the display then calculates and displays the power or energy density in units of W/cm²...
- Page 58 It is possible to expand this needle to cover the full screen of the Vega by pressing the “Expand” button. When in one of the full color modes, the expanded needle will display the minimum and maximum readings.
- Page 59 To enter the needle screen do as follows: 1. From the main power or energy screen press “Menu”, select “Needle” and enter. 2. To use the expanded needle feature, press “Expand”. 3. To reset the minimum, maximum, and needle tracking, press “Reset”. 4.
-
Page 60: Photodiode Sensors
The Vega display unit amplifies this signal and indicates the power level received by the sensor. Due to the superior circuitry of the Vega, the noise level is very low, and the PD300 /3A-IS series sensors with the Vega display have a large dynamic range from nanowatts to hundreds of milliwatts. -
Page 61: Setting Up The Pd300 To Display The User's Chosen Wavelengths
measure to 30mW or more without saturation. When the additional filter is installed, the maximum power is on the order of 300mW (or 3W with model PD300-3W). The PD300 saturates when the output current exceeds 1.3mA so the exact maximum power depends on the sensitivity of the detector at the wavelength used. -
Page 62: Startup Defaults
"smart connector", you can save different settings for different sensors. The following section describes how to set up the Vega with the PD300 sensor so that it will start up in the desired configuration. Setting up the startup defaults: (See section 5.4 for further details) 1. -
Page 63: Selecting Settings From The Vega Screen
The Vega will now be in the range selected when switched on with the sensor in question. 5. Select “Average” to choose the averaging period for power measurement. If you do not want averaging, choose the value “NONE” See section 4.4.2.4 for details about averaging. - Page 64 To configure the Vega to be in manual mode when switched on, see Section 5.3. dBm - The Vega allows the measurement to be made in units of dBm that is a logarithmic scale. dBm units are defined as:...
- Page 65 Depending on what powers you wish to measure, choose whether to work with the removable filter installed or not. For this purpose, the Vega has a "filter" setting and uses the proper correction curve depending on whether the filter is installed or not.
- Page 66 In this case, the true power is 20.5 - 0.1 = 20.4 To subtract the background, press "Offset" while the laser is blocked. The Vega will now read zero (0.0), and the 0.1 mW background will be subtracted from all subsequent readings.
- Page 67 5.4.7. Average and Measuring Very Low Power Measurement If the laser power is fluctuating, the Vega can display the average power readings with averaging periods varying from 1s to 1 hour. When measuring very low powers,...
- Page 68 This allows you to see at a glance if you have reached maximum power. The Vega also has the option of graphing the laser power vs. time. While measurements are being taken, the Vega will record data until the screen is full, or "Reset"...
-
Page 69: Chapter 6. Operation With Pyroelectric Sensors
They can also measure at higher repetition rates than was possible before. The Vega meter amplifies this signal and indicates the energy received by the sensor as well as the frequency at which the laser is pulsing. Using the energy and... -
Page 70: Selecting Settings From The Vega Screen
Vega is also able to display average power. The photodiode based PD10 & PD10-PJ sensors also use the same circuitry but can measure much lower energies due to the sensitivity of the photodiode. 6.1.2. Photodiode energy sensors – method of operation The PD10 &... - Page 71 PE05 10235 Range: 20mJ Menu: Energy Laser: 532 Average: 1 sec Threshold: 3% 12.34 142.37Hz TRIG 20mJ Power Help 50s Figure 6.1 Pyroelectric Energy Screen 6.2.1. Setting up the sensor to display the user's chosen wavelengths. The absorption of the detector coating varies somewhat with wavelength.
- Page 72 “save”. 6.2.2.2. Setup for the Time Period to Average Over The Vega has the ability to measure a number of pulses and display the average value of the energy of the pulses. This function is useful if the laser energy is not stable.
- Page 73 (See section 4.4.2.6.1). However, the display can only display at rates up to 10Hz. At higher rates, if the user has chosen “NONE”, the Vega will display individual pulses sampled at a rate of 5Hz. If the user has chosen to...
-
Page 74: Startup And Configuration Of Defaults
6.3 Startup and Configuration of Defaults If you are planning to do repetitive measurements most of the time, you can set up the Vega so that it automatically goes into the measurement mode you want upon startup. Since these desired settings are saved in the sensor "smart connector", you can save different settings for... - Page 75 8. Now press “Save” if you want this to be the startup default and press “Exit”. 9. Switch the Vega off then on by means of the on/off switch. (See Figure 3.1). The Vega will enter the mode of operation last saved with the "Configure" operation.
-
Page 76: Energy, Power Or Exposure Measurement
Therefore, for the most accuracy in pyroelectric energy measurements, it is necessary to zero the pyroelectric sensor against the Vega display it will be used with. After this is done, the sensor is “conditioned” to work with the particular Vega the zeroing was done... - Page 77 It is not necessary to do this procedure again unless the Vega is used with a different sensor. If the procedure is not done, errors of 2% or so can occur. To zero the sensor against the Vega, proceed as follows: Make sure the sensor is in a quiet environment and not subject to pulsed radiation.
- Page 78 (P/N 7Z08268) that helps reduce vibration on the sensor. Note 2: The Vega is able to record each pulse at up to 4000Hz even though it is displaying at a much lower rate. This data can be stored in a data file and recovered and transmitted later.
- Page 79 Enter key. 6.4.2. Measuring Total Energy Exposure. The Vega has the ability to sum the total energy of a number of pulses over a given time period or number of pulses. This gives the total energy "exposure" over that time period.
- Page 80 Figure 6.2. Exposure Screen set to stop after summing 500 pulses 3. Press “Start”. The Vega will start summing laser energy exposure. When you wish to stop measuring, press "Stop" or wait for measurement to reach the timeout or the pulses selected. The Vega will now...
- Page 81 The screen will also show in small digits the energy at which the normalization was done and the present energy reading. To use the Vega to normalize the energy: 1. From the main measurement screen, enter “Menu” and select “Normalize”.
-
Page 82: Measuring Repeating Pulses Of High Energy
(Section 4.6.1) to display the actual laser power or energy. 3. Ophir has three sensors specifically designed for high energy density pulses. They are the PE50HD sensors with high damage threshold, the PE50-DIF model pyroelectric sensors with a diffuser and the RP thermal/photodiode sensors. - Page 83 In order to log data or transmit it to PC at rates >1000Hz, you must be in turbo mode. This will put you into a special mode where the Vega can handle data at high speed while curtailing other functions. To log in turbo...
-
Page 84: Pyro Scope Adapter
Activate the scope adapter as follows: 1. Plug the adapter into the Vega meter and then plug the sensor plug into the adapter. Plug the BNC connector into a standard 1M scope input. -
Page 85: Pe-Dif Diffuser Sensors
6.8 PE-DIF Diffuser Sensors Setting up PE-DIF diffuser sensors to diffuser IN or OUT setting: 1. In the “Configure” screen set “Diffuser” to be “IN” or “OUT” according to the startup mode you prefer. 2. Go to the main power / energy screen. 3. -
Page 86: Chapter 7. Beamtrack Features
This chapter describes the Vega’s position and size measurement functionality. For a full description of Thermopile functionality see... -
Page 87: Menu Screen
7.2 Menu Screen To access the various other BeamTrack features, go to the Menu screen from the main Track Screen. Figure 7.2 BeamTrack Menu Screen 7.3 Stability Screen This screen tracks the position of the laser beam over time. This is useful for users that want to measure the pointing stability of their laser. -
Page 88: Statistics Screen
Press the “Rate” softkey to change the sampling rate. Press the “Reset” softkey to clear the statistics. 7.5 Optimizing Measurements 7.5.1. Zeroing. When a BeamTrack sensor is attached, the zeroing function of the Vega will zero the BeamTrack’s measurement circuitry as well. - Page 89 7.5.2. Line Frequency. In order to filter out noise that may be introduced to the measurements from the local power supply, in the Configuration Screen, set Line Frequency to 50Hz or 60Hz, depending on the country you’re in. Figure 7.5 Configuration Screen...
-
Page 90: Chapter 8. Circuit Description
Chapter 8. Circuit Description The Vega has two circuit boards: the lower board with analog circuit, digital processor and its support circuit, and power supplies; and the upper board with LCD and its driver. Analog Circuit: The signal from the detector sensor enters the analog circuit and passes through EMI protection components to a differential trans-impedance preamplifier. - Page 91 EMI Protection: The digital processor circuit and the whole Vega instrument are protected by EMI protection component on all signals that pass in and out of the box. In addition,...
-
Page 92: Chapter 9. Calibration, Maintenance And Troubleshooting
9.1 Calibration of Thermopile or RP Sensors 9.1.1. Absorber types and Method of Calibration of Ophir Power Meters 9.1.1.1. Types of Ophir Laser Absorbers Two types of absorber surface are used in Ophir thermal measuring sensors. 1. Surface Absorbers: BB (broadband) absorber... - Page 93 2. Volume absorbers: P (pulse) type absorber The models with the P suffix, for use with pulsed lasers, have a special absorbing glass with an absorbance of 95 ±2% over the operating range. Since the surface is a glass, its reflectivity does not change even if damaged or melted locally.
- Page 94 The linearity of most Ophir thermal detectors is specified to be 1% over the specified power range of each particular instrument and is tested by Ophir from time to time. The linearity is generally tested against another sensor that has been NIST tested for linearity. For those...
- Page 95 Absorption vs. Wavelength of Various Pyroelectric Sensor Absorbers 9.1.2.2. Method of Calibration The absorption of the various Ophir thermal absorbers can vary from disc to disc. Therefore, all Ophir absorbers are individually calibrated against NIST traceable standards. 9.1.2.3. Total Accuracy of Calibration...
- Page 96 4. Select “Factor” and enter the “Modify” screen. Adjust the factor until the power/energy reading on the screen equals the known power/energy. Press “Save” and the power/energy calibration factor under “Updated” will change accordingly. See Note Note 1: For units which have different calibration factors, e.g. CO2, YAG, or VIS, press "Laser"...
-
Page 97: Calibration Of Photodiode Type Sensors
These filters also have a transmission that depends on wavelength. Therefore, when the PD300 is being used with Vega, the Vega has a built in calibration adjustment for wavelength which is described in the next paragraph. - Page 98 Maximum Error as a Function of Wavelength and Filter Note: More exact specifications will be found in the latest Ophir Laser Measurement Instruments Catalog. 9.2.3. Recalibration at a specific wavelength from a Known Source of Laser Power 1. From the main measurement screen select “Menu”...
-
Page 99: Calibration Of Pyroelectric Type Sensors
The filter detector combinations are calibrated over the entire wavelength range similarly to the PD300 power sensors and therefore the sensors have a high accuracy at any wavelength in the range. This is an exclusive feature with Ophir energy sensors. - Page 100 Metallic Coating Graph 3. Absorption of Ophir Pyroelectric Absorbers 9.3.2. Calibration The sensitivity of the various Ophir pyroelectric sensors can vary from one to another as well as with wavelengths. Therefore, Ophir pyroelectric detectors are individually calibrated against NIST traceable standards.
- Page 101 The maximum error in measurement will be less than the sum of the above errors and in general will be considerably less. The exact accuracy of each type of sensor is specified in the latest edition of the Ophir catalog. For more details on calibration accuracy, see the Ophir website http://www.ophiropt.com/laser-...
-
Page 102: Error Messages
Low Battery: When the battery is almost discharged, the Battery icon will have only 1 segment left. This means the battery is ¾ empty. At this stage, the Vega should be connected to the charger. It will operate normally and... -
Page 103: Troubleshooting
Instrument operates with Battery is low. Recharge charger but not with battery overnight with the Vega turned alone. off for 7-8 hours. If the Vega still doesn't work with battery, then the NiMH battery is probably dead. Replace battery (see section 9.6.1.4). - Page 104 9.5.3. Thermal Sensors, Power Problem Cause/Remedy Instrument shows zero Check connections between the sensor reading in both power and the instrument. (See section and energy modes. 9.6.1.1). Check that the sensor disc is operative. Resistance between the pins 1 and 9 of the sensor connector should be about 11k.
-
Page 105: Maintenance
BLK (black) symbols on the circuit board indicate the correct direction to insert the connector into its terminal. It can only be inserted in one direction. 4. Replace the bottom panel of the Vega and close the 4 screws. 5. Switch on the Vega with NO SENSOR DETECTOR attached and set the date and time of the instrument correctly. -
Page 106: Chapter 10. Vega Specifications
Chapter 10. Vega Specifications 10.1 System/Meter Specifications Input Specifications Thermal, Photodiode Input Ranges 15nA - 1.5mA full scale in 16 ranges A to D Sampling rate 15Hz A to D resolution and linearity Resolution: 23 bits plus sign. (0.00001%); Linearity: better than 17 bits (0.0009%) Electrical accuracy ±0.25% ±... -
Page 107: Sensor Specifications
10.2 Sensor Specifications Sensor Max Avg. Absorber Power Power Type (WATTS) Density at Max Power PD300/UV/IR 300mW 50W/cm² PD300-3W 100W/cm² 3A-IS 200W/cm² Int Sph PD 1000W/cm² 3A-P 50W/cm² 3A-FS 200W/cm² 28KW/cm² 25KW/cm² 12A-P 50W/cm² 20C-SH 4(20)W 23KW/cm² 30A-BB-18 20KW/cm² 30A-P-17 50W/cm²... - Page 108 BF - very high damage threshold, long pulses FS - Fused silica window close to detector for divergent beams Note: For more detailed and exact specifications, see the latest Ophir Laser Measurement Instruments Catalog. Absorber Max Energy Density J/cm² Type...
- Page 109 Rev 2.37-1/09.1.14/ykp+bae BeamTrack Statistics Screen and Analog Hold/Release. Also corrected chapter 9 (Calibration, Maintenance and Troubleshooting), charging info, power table and PD300 table, updated tables 1,2 & 3.Rev 2.19-2/25.03.12/be New Ophir-Newport logo Rev 2.19-1/07.06.11/yp+be Added Chapter 7 BeamTrack Features. Renumbered chapters that follow. Put in link to Chapter 7 from end of Chapter 4 Operation with Thermopile Absorber Sensors.
Need help?
Do you have a question about the vega and is the answer not in the manual?
Questions and answers