Table of Contents
Advertisement
Quick Links
Advertisement
Table of Contents

Subscribe to Our Youtube Channel
Summary of Contents for Net research NetProbe 2000
- Page 1 NetProbe 2000 User Manual Ver 5.06.02 June 2016...
-
Page 2: Table Of Contents
TABLE OF CONTENTS TABLE OF CONTENTS ..................................2 WARRANTY AND SOFTWARE ..............................13 IMPORTANT SAFETY INFORMATION ............................15 INTRODUCTION ..................................16 DESCRIPTION ..................................17 .................................. 17 XTERNAL NTERFACES 4.1.1 Top Control Panel ................................17 4.1.2 Test Interface Signal Panel ..............................18 4.1.3 Front Control Panel ................................ - Page 3 ....................................31 ...................................... 32 5.2.1 General Configuration Tab ..............................32 5.2.2 Automonitor Configuration Tab ............................38 ..................................43 ONITOR (BERT) ................................51 RROR ESTING 5.4.1 ALARM menu ..................................55 5.4.2 G.821 ERROR menu ................................56 5.4.3 Live Traffic menu ................................57 (PDL) ...........................
- Page 4 DS0 T ..................................... 90 ESTING T3 ANALYZER OPTION ................................91 ....................................91 ...................................... 92 (BERT) ................................96 RROR ESTING 7.3.1 ALARM menu ..................................100 7.3.2 G.821 ERROR menu ................................101 7.3.3 Line menu ..................................102 E3 ANALYZER OPTION ................................103 ....................................
- Page 5 DATACOM ANALYZER OPTION ............................126 10.1 SETUP ....................................127 10.2 (BERT) ............................... 132 RROR ESTING 10.2.1 G.821 ERROR menu ..............................136 10.2.2 Frequency Measurement menu ........................... 137 10.3 (PDL) ..........................138 ROPAGATION ELAY EASUREMENT IEEE C37.94 ANALYZER OPTION ............................140 11.1 IEEE C37.94 T ..............................
- Page 6 12.2 ..................................... 161 ETUP 12.2.1 SFP Identity ..................................161 12.2.2 PORT SETUP and PORT STATUS ........................... 162 12.2.3 Network Parameters ..............................162 12.3 ....................................163 IREMAP 12.3.1 Fundamentals ................................163 12.3.2 Accuracy ..................................164 Cable Termination ......................................164 Coupling Between Cable Pairs..................................164 12.4 ....................................
- Page 7 ............................. 190 ONFORMANCE ESTING 12.7.1 Fundamentals ................................190 12.7.2 Single NetProbe 2000 or Dual NetProbe 2000 Test Scenario ..................192 12.7.3 RFC 2544 Setup ................................194 PROFILE Tab ........................................194 GENERAL Tab........................................195 THROUGHput Tab ......................................199 LATENCY Tab ........................................199 FRAME LOSS Tab ......................................
- Page 8 13.3.2 Traffic Generator Setup ............................... 219 PROFILE Tab ........................................219 GENERAL Tab........................................220 TRAFFIC Tab ........................................221 13.3.3 Running the Traffic Generator ............................. 223 13.3.4 Traffic Generator Results ............................. 224 SUMMARY Tab ....................................... 224 THROUGH Tab ........................................ 225 SEQUENCE Tab ....................................... 226 LATENCY Tab ........................................
- Page 9 13.5 IEEE 1588 ....................................243 13.5.1 Introduction ................................. 243 13.5.2 Setup .................................... 245 PROFILE Tab ........................................245 PTP Tab .......................................... 246 Master/Slave Tab ......................................248 Peer Tab ......................................... 249 13.5.3 Results ..................................250 Status ..........................................250 Messages statistics ......................................251 Errors ..........................................
- Page 10 15.4.1 Detailed Results ................................272 15.5 STB E ..................................277 MULATION 15.5.1 Build or Import Channel List ............................278 15.5.2 Running STB Emulation ..............................282 15.5.3 Detailed Results ................................284 15.6 CHANNELS SCAN ................................... 289 15.7 D ....................................... 290 15.7.1 Build or Import Channel List ............................
- Page 11 17.3.2 WiFi - Trace Route ................................ 321 17.3.3 WiFi - Discover ................................322 17.3.4 WiFi - FTP ..................................323 17.3.5 WiFi - HTTP .................................. 325 IP TOOLS ................................... 326 18.1 IP A ................................. 327 CQUIRING AN DDRESS 18.2 PING ...................................... 328 18.3 ...................................
- Page 12 21.9 T3(DS3) A : ..............................344 NALYZER PTION 21.10 : ............................346 IGABIT ASIC NALZER PTION 21.11 ADV A : ............................347 IGABIT NALYZER PTION 21.12 IPTV A : ............................... 348 NALYZER PTION 21.13 GENERAL: ..................................349...
-
Page 13: Warranty And Software
(30) days of the customer’s request. • Additionally, during the warranty period, Net Research will provide, without charge to the customer, all fixes, patches and enhancements to the purchased software, firmware and software options. Net Research does not warrant that all software or firmware defects will be corrected. - Page 14 Revoking the warranty: Net Research offers no guarantee or warrant that the operation of the hardware, software or firmware will be uninterrupted or error-free. The warranty will not apply in any of the following cases: • Improper or inadequate maintenance by the customer •...
-
Page 15: Important Safety Information
2. Important Safety Information... -
Page 16: Introduction
CO-DIR, Wi-Fi, VoIP, IPTV, and IEEE C37.94 telecom services. Depending on the actual configuration ordered, some of these interfaces will not be available in the tester. This user manual describes the NETPROBE 2000 and provides instruction on how to set it up and perform tests. -
Page 17: Description
4. DESCRIPTION External Interfaces 4.1.1 Top Control Panel The diagram to the right shows a fully equipped NetProbe 2000 with optional Gigabit and IEEE C37.94 ports. The standard features include the USB port and Audio micro connector. The optional datacom connector supports RS-232, RS-530, RS-449, V-35 and X.21 interfaces with an... -
Page 18: Test Interface Signal Panel
4.1.2 Test Interface Signal Panel The Signal Panel is used for the PDH (T1, E1, T3, and E3) interface connectors. There are many possible configurations available to accommodate these interfaces. The NetProbe image below is configured with a RJ-45 connector for T1/E1 and COAX connectors for T3/E3. Both RJ-45 (balanced 100/120 Ohm) and BNC (75 Ohm) or Bantam ( unbalanced 100/120 Ohm) connectors carry E1/T1 signal or when equipped, the G.703 64kbps Co-Dir. -
Page 19: Front Control Panel
4.1.3 Front Control Panel The front Control Panel accommodates a 3.5” LCD touchscreen and the 5- way navigation switch assembly. The 4 arrows of navigation switch allow an alternate way to control the cursor position and the OK button selects the item pointed by the cursor on the LCD display. -
Page 20: Graphical User Interface (Gui)
Graphical User Interface (GUI) The LCD display is organized into sections: • Application tree that shows the current test location in the application • Signal Status LED’s • Signal Status history LED’s • Measurement Results window that may show the measurement results or a summary status of the submenu •... - Page 21 Clock &Calendar setup Screenshot tool allows taking a screen picture and saving it in a file. This feature is useful when a temporary event displays on the screen Battery status Set Brightness, calibrate the touch screen, erase all tester data and change languages LAN, WiFi and VNC configurations Software version info and update tool Soft Power OFF button...
-
Page 22: Operators Reference
Operators reference OPERATOR’S NAME SYMBOL DESCRIPTION START Toggles between . Activates test and storing test results in STOP Toggles between . Stops test and storing results in RESTART Restarts test and clear current data without stopping transmission PAUSE Pauses the current test until pressed again (where available) TEST RESULT Enters test log with Results HOME... -
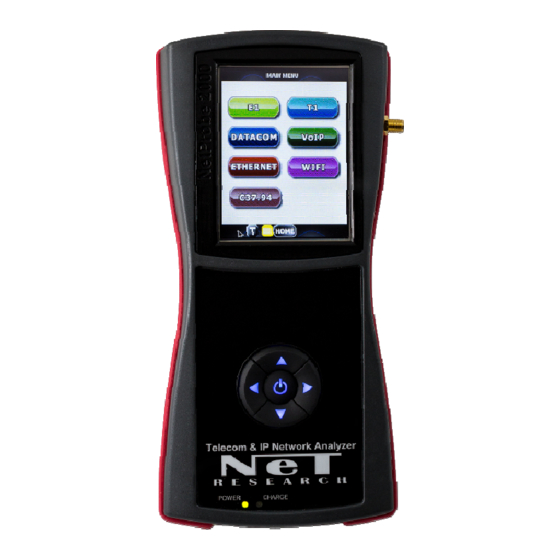
Page 23: Main Menu
Main Menu Upon Power Up, the display starts with the main menu. Each available application has a corresponding button and designated color. Only installed applications are accessible and their buttons active. Applications that are Not installed, have their buttons greyed out and are inactive. The E1, T1 and Datacom Interfaces are powered up only when they are activated from the main menu. -
Page 24: Test Results
Test Results The Test Results menu shows a log of all results for the application currently in use. To view details, highlight the desired test record and press to display various metric views including histograms. The actual display varies with the test application that was applied. - Page 25 To export the desired test record press from the Test Results screen. Click on the appropriate tab to export by USB, FTP or email. You can select to export the total results report in PDF or ASCII format by checking the TotalResults (RAW) and/or TotalResults(PDF) checkboxes.
- Page 26 Export by FTP To export by FTP, connect a CAT5/6 Ethernet cable to the connector labled 10/100 LAN at the top of the unit. Click on the FTP tab, enter the FTP login information and press the button.
- Page 27 Export by Email To export by FTP, connect a CAT5/6 Ethernet network cable to the connector labeled 10/100 LAN at the top of the unit. Click on the Email tab then click on the icon to configure your email parameters. Finish by entering the send-to email address and subject and press the button,...
- Page 28 To view a log of time-stamps and quantity of Errors and Alarms, choose the record of interest from the Test Results screen, press and then press the Log button.
-
Page 29: Standard Accessories
Standard Accessories The NetProbe 2000 is provided with the following standard accessories: • Carrying case with a shoulder strap and a pocket for cables • Universal AC adapter, 100—240VAC, 12VDC, 1.5A, 50/60Hz, UL, CE, LPS with IEC connector power cord •... -
Page 31: E1 Analyzer Option
5. E1 ANALYZER OPTION Top Menu The E1 Analyzer option starts up with the top menu shown to the right with buttons for the following test functions: AUTO MONITOR BERT PULSE SHAPE (analysis) PDL (propagation delay test) SETUP... -
Page 32: Set Up
Set Up Use the Setup menu to configure the E1 transmitter and receiver parameters listed under the General tab. This menu also allows you to define the Auto Monitor thresholds used to determine pass/fail results under the Automonitor tab . 5.2.1 General Configuration Tab E1 Frame Type •... - Page 33 E1 Pattern OFF, 63, 511, 2047, 2-15-1, 2- 21-1, 2-23-1, QRSS, All 0’s, All 1’s, 1:3, 1:7, 1:15, 1:31. The pattern can also be configured in Setup. Test Length (not shown) Unlimited, 30 s, 1 min, 5 min, 10 min, 30 min, 1hr, 3 hr. 6 hr, 12 hr, 1 day, 2 days, 3 days, user-defined.
- Page 34 E1 Transmitter Clock Source • Internal - from TCXO 3ppm • Recovered - from Receive Data Rx • External – from 0-5V TTL clock source E1 Line Termination Type • Termination - 120 Ohm, 100 Ohm, 75 Ohm, Tx and Rx software switchable •...
- Page 35 E1 Line Loopback mode • Local loop • Remote Loop E1 Line Code • AMI Code • HDB3 code...
- Page 36 E1 Line Build Out Transmitter TX(LBO) E1 Transmitter at 0 dB level or OFF E1 Fractional Submenu Enable To setup Fractional testing, click on the checkbox labeled Fraction and press the Edit button. Next, select desired Timeslots for nx64kbps fractional E1 testing (where n =1 …15,17..31 for CAS and n = 1…31 for CCS framing).
- Page 37 Saving the SETUP The buttons labeled Delete Config and Save Config allow you to delete and save any configuration file currently shown in the Config window. If the config is not saved, it will retain the last config used. To save a config, press the Save Config button. You can save as Default or you can enter a new name for the current configuration.
-
Page 38: Automonitor Configuration Tab
5.2.2 Automonitor Configuration Tab Line Tab (Enable and Set Thresholds) • Frequency (Hz) • Signal Level (V) Alarm Tab (Enable) • LOS (Loss of Sync) • OOF (Out of Frame) • AIS (All 1’s Alarm Indicator Signal) • RAI (Remote Alarm Indicator) •... - Page 39 Errors Tab (Enable and Set Thresholds) • Code • Frame • • FEBE...
- Page 40 G.826 Tab (Enable) • ES (Errored Seconds) • SES (Severe ES) • UAVS (Unavailable Seconds) G.826 Tab (Enable and Set Thresholds) • EB (Errored Block) • BBE (Background Block Error) RFC1406 Tab (Enable) • ES (Errored Seconds) • SES (Severed ES) •...
- Page 41 M.2100 Tab (Enable and Set Path Value) M.2110 S1 and S2 Thresholds This M.2100 Path Allocation value has a range • ES (Errored Seconds) from 0.5% to 63.5%, in 0.5% increments. Based • SES (Severed ES) on this value, the S1 and S2 limits of the M.2110 and M.2120 are preset accordingly.
- Page 42 Saving the SETUP The buttons labeled Delete Config and Save Config allow you to delete and save any configuration file currently shown in the Config window. If the config is not saved, it will retain the last config used. To save a config, press the Save Config button. You can save as Default or you can enter a new name for the current configuration.
-
Page 43: Auto Monitor
Auto Monitor Run the AUTO MONITOR application to automatically check the tested E1 signal for the following Parameter categories: Line Errors, Alarms, Errors, G.826 analysis, RFC1406 analysis and M.2100 analysis. For each, the status is displayed along with failure details. The indicators at the top display the current and historical state of SIGNAL/FRAME/ALARM/ERROR events. - Page 44 To run the Auto Monitor test, connect the NetProbe 2000 E1 receiver to either a DSX MON jack or E1OUT for BRIDGE if DSX MON jack is not available. Connect the E1 signal to the appropriate connector (RJ-45, COAX, Bantam) on the...
- Page 45 Next, press button to start the AUTO MONITOR test. Check the AUTO MON main screen and observe the following: • The real-time SIGNAL and FRAME (with Tip: Framed data) indicators at the top of the Click on a history indicator screen are Green.
- Page 46 Each category and its sub-detail metrics are described below. Line measurements • Code Errors • Frequency • Signal Level • Clock Slips • Frame Slips Alarms • LOS (Loss of Sync) • OOF (Out of Frame) • AIS (All 1’s Alarm Indicator Signal) •...
- Page 47 Errors • Code • Frame • • FEBE...
- Page 48 G.826 • ES (Errored Seconds) • SES (Severe ES) • ES Ratio % • SES Ratio % • AVS (Available Seconds) • UAVS (Unavailable G.826 Block • EB (Errored Block) • BBE (Background Block Error) • EBR (EB Ratio %) •...
- Page 49 RFC1406 • Total Seconds • ES (Errored Seconds) • SES (Severed ES) • AVS (Available Seconds) • UAVS (Unavailable Seconds) M.2100 Tab • ES (Errored Seconds) • SES (Severed ES) • UAVS (Unavailable Seconds)
- Page 50 M.2110 Tab Limit 24 Hours • ES (Errored Seconds) • SES (Severed ES) • Status Limit 7 days • ES (Errored Seconds) • SES (Severed ES) • Status M.2120 Tab Limit 15 Minutes • ES (Errored Seconds) • SES (Severed ES) •...
-
Page 51: Bit Error Testing (Bert)
Bit Error Testing (BERT) Run the BERT application to check the integrity of an E1 circuit. It can be run with a loopback or end to end with another test set. The indicators at the top display the current and historical state of SIGNAL/FRAME/ALARM/ERROR/PSYNC events. - Page 52 A typical loop around or point-to-point Bit Error Test setup is shown below. After the bantam, BNC or RJ-45 cable connection is made, press to start the BERT test.
- Page 53 Check the BERT main screen and observe the following: • The real-time SIGNAL, PSYNC and FRAME (with Framed data) indicators at the top of the screen are Green. Red indicates a Tip: problem. If these indicators are red, should Click on any history indicator box check all circuit connections and E1 setup.
- Page 54 Tip: Click in the Errors or Rate columns to display a histogram for the corresponding metric. Click on the thin gray bar to Tip: hide it. To verify that everything is setup properly after Green arrows at the bottom starting BERT, click on can be used to display the LGC button to force additional metrics, alarms and...
-
Page 55: Alarm Menu
5.4.1 ALARM menu To access the Alarms menu, press from the main BERT screen. Use this menu to: • Monitor the current and history alarm status to determine which alarms caused the LED to turn red. • Force an alarm condition onto the E1 line by pressing an Alarm Insertion button. -
Page 56: Error Menu
5.4.2 G.821 ERROR menu To access this menu, press from the ALARM menu. Use this menu to: • Monitor the current and history ERROR status to determine the severity of the errors that generated an ERROR indication. Tip: • Monitor G.821 counters and percentages. -
Page 57: Live Traffic Menu
5.4.3 Live Traffic menu To access this menu, press from the G.821 ERROR menu. Use this menu to view the binary and hexadecimal value in each timeslot. To exit, press... -
Page 58: Propagation Delay Measurement (Pdl)
Propagation Delay Measurement (PDL) Run the Propagation Delay Measurement application to measure the round trip loopback delay around the E1 circuit heck the integrity of an E1 circuit. A typical loop around connection for measuring PDL is shown below. After the bantam, BNC or RJ-45 cable connection is made, press to start the PDL measurement. - Page 59 When the PDL measurement begins, the tester will first reset the displayed results and then calibrate. After a couple seconds, the Current Delay, Minimum Delay and Maximum Delay values will display along with a histogram. The Current Delay, Minimum Delay and Maximum Delay is measured and reported in milli-seconds (ms) and unit intervals (ui’s).
-
Page 60: Pulse Shape Analysis (Psa)
Pulse Shape Analysis (PSA) Run the Pulse Shape Analysis (PSA) application to check if the E1 pulse shape complies with ITU-T G.703 specifications. To plot and analyze the E1 pulse shape, first connect the E1 signal to be tested and select the appropriate Termination from the E1 Setup menu. -
Page 61: Ds0 Testing
DS0 Testing Run the DSO Testing application to measure the frequency and power of any received tones and monitor the ABCD bits of a DSO sub channel. The application also allows you to listen to the audio in a timeslot using the supplied headset. To run a DSO test, connect the E1 signal to be tested, select a timeslot number, select PCM Companding (u-Law/A-Law) and press to start a DSO test. -
Page 62: T1 Analyzer Option
6. T1 ANALYZER OPTION Top Menu The T1 analyzer option starts up with the top menu shown to the right with buttons for the following test functions: AUTO MONITOR BERT PULSE SHAPE (analysis) PDL (propagation delay test) SETUP... -
Page 63: Set Up
Set Up Use the Setup menu to configure the T1 transmitter and receiver parameters listed under the General configuration tab. This menu also allows you to define the Auto Monitor thresholds used to determine pass/fail results under the Automonitor tab . 6.2.1 General Configuration Tab T1 Frame Type •... - Page 64 T1 Pattern OFF, 63, 511, 2047, 2-15-1, 2- 21-1, 2-23-1, QRSS, All 0’s, All 1’s, 1:3, 1:7, 1:15, 1:31. The pattern can also be configured in Setup. Test Length (not shown) Unlimited, 30 s, 1 min, 5 min, 10 min, 30 min, 1hr, 3 hr. 6 hr, 12 hr, 1 day, 2 days, 3 days, user-defined.
- Page 65 T1 Transmitter Clock Source • Internal - from TCXO 3ppm • Recovered - from Receive Data Rx • External – from 0-5V TTL clock source T1 Line Termination Type • Termination - 120 Ohm, 100 Ohm, 75 Ohm, Tx and Rx software switchable •...
- Page 66 T1 Line Loopback Mode • Local loop • Remote Loop T1 Line Code • AMI Code • HDB3 code...
- Page 67 T1 Line Build Out Transmitter TX(LBO) E1 Transmitter at 0 dB level or OFF T1 Fractional Submenu Enable To setup Fractional testing, click on the checkbox labeled Fraction and press the Edit button. Next, select desired Timeslots for nx64kbps fractional T1 testing (where n =1 …24).
- Page 68 Saving the SETUP The buttons labeled Delete Config and Save Config allow you to delete and save any configuration file currently shown in the Config window. If the config is not saved, it will retain the last config used. To save a config, press the Save Config button. You can save as Default or you can enter a new name for the current configuration.
-
Page 69: Automonitor Configuration Tab
6.2.2 Automonitor Configuration Tab Line Tab (Enable and Set Thresholds) • Frequency (Hz) • Signal Level (V) Alarm Tab (Enable) • LOS (Loss of Sync) • OOF (Out of Frame) • AIS (All 1’s Alarm Indicator Signal) • Yellow... - Page 70 Errors Tab (Enable and Set Thresholds) • Code • Frame •...
- Page 71 G.826 Tab (Enable) • ES (Errored Seconds) • SES (Severe ES) • UAVS (Unavailable Seconds) G.826 Tab (Enable and Set Thresholds) • EB (Errored Block) • BBE (Background Block Error) RFC1406 Tab (Enable) • ES (Errored Seconds) • SES (Severed ES) •...
- Page 72 Saving the SETUP The buttons labeled Delete Config and Save Config allow you to delete and save any configuration file currently shown in the Config window. If the config is not saved, it will retain the last config used. To save a config, press the Save Config button. You can save as Default or you can enter a new name for the current configuration.
-
Page 73: Auto Monitor
Auto Monitor Run the AUTO MONITOR application to automatically check the tested T1 signal for the following Parameter categories: Line Errors, Alarms, Errors, G.826 analysis and RFC1406 analysis.. For each, the status is displayed along with failure details. The indicators at the top display the current and historical state of SIGNAL/FRAME/ALARM/ERROR events. You can display additional sub-detail metrics for each category by clicking on a Parameter category name button. - Page 74 To run the Auto Monitor test, connect the NetProbe 2000 T1 receiver to either a DSX MON jack or E1OUT for BRIDGE if DSX MON jack is not available. Connect the T1 signal to the appropriate connector (RJ-45, COAX, Bantam) on the...
- Page 75 Next, press button to start the AUTO MONITOR test. Check the AUTO MON main screen and observe the following: • The real-time SIGNAL and FRAME (with Tip: Framed data) indicators at the top of the Click on a history indicator screen are Green.
- Page 76 Each category and its sub-detail metrics are described below. Line measurements • Code Errors • Frequency • Signal Level • Clock Slips • Frame Slips Alarms • LOS (Loss of Sync) • OOF (Out of Frame) • AIS (All 1’s Alarm Indicator Signal) •...
- Page 77 Errors • Code • Frame •...
- Page 78 G.826 • ES (Errored Seconds) • SES (Severe ES) • ES Ratio % • SES Ratio % • AVS (Available Seconds) • UAVS (Unavailable G.826 Block • EB (Errored Block) • BBE (Background Block Error) • EBR (EB Ratio %) •...
- Page 79 RFC1406 • Total Seconds • ES (Errored Seconds) • SES (Severed ES) • AVS (Available Seconds) • UAVS (Unavailable Seconds)
-
Page 80: Bit Error Testing (Bert)
Bit Error Testing (BERT) Run the BERT application to check the integrity of an E1 circuit. It can be run with a loopback or end to end with another test set. The indicators at the top display the current and historical state of SIGNAL/FRAME/ALARM/ERROR/PSYNC events. - Page 81 A typical loop around or point-to-point Bit Error Test setup is shown below. After the bantam, BNC or RJ-45 cable connection is made; press to start the BERT test.
- Page 82 Check the BERT main screen and observe the following: • The real-time SIGNAL, PSYNC and FRAME (with Framed data) indicators at the top of the screen are Green. Red indicates a Tip: problem. If these indicators are red, should Click on any history indicator box check all circuit connections and T1 setup.
- Page 83 Tip: Click in the Errors or Rate columns to display a histogram for the corresponding metric. Click on the thin gray bar to Tip: hide it. To verify that everything is setup properly after Green arrows at the bottom starting BERT, click on can be used to display the LGC button to force additional metrics, alarms and...
-
Page 84: Alarm Menu
6.4.1 ALARM menu To access the Alarms menu, press from the main BERT screen. Use this menu to: • Monitor the current and history alarm status to determine which alarms caused the LED to turn red. • Force an alarm condition onto the E1 line by pressing an Alarm Insertion button. -
Page 85: Error Menu
6.4.2 G.821 ERROR menu To access this menu, press from the ALARM menu. Use this menu to: • Monitor the current and history ERROR status to determine the severity of the errors that generated an ERROR indication. • Monitor G.821 counters and percentages. -
Page 86: Live Traffic Menu
6.4.3 Live Traffic menu To access this menu, press from the G.821 ERROR menu. Use this menu to view the binary and hexadecimal value in each channel. To exit, press... -
Page 87: Propagation Delay Measurement (Pdl)
Propagation Delay Measurement (PDL) Run the Propagation Delay Measurement application to measure the round trip loopback delay around the T1 circuit heck the integrity of a T1 circuit. A typical loop around connection for measuring PDL is shown below. After the bantam, BNC or RJ-45 cable connection is made;... - Page 88 When the PDL measurement begins, the tester will first reset the displayed results and then calibrate. After a couple seconds, the Current Delay, Minimum Delay and Maximum Delay values will display along with a histogram. The Current Delay, Minimum Delay and Maximum Delay is measured and reported in milli-seconds (ms) and unit intervals (ui’s).
-
Page 89: Pulse Shape Analysis (Psa)
Pulse Shape Analysis (PSA) Run the Pulse Shape Analysis (PSA) application to check if the T1 pulse shape complies with ITU-T G.703 specifications. To plot and analyze the T1 pulse shape, first connect the T1 signal to be tested and select the appropriate Termination from the T1 Setup menu. -
Page 90: Ds0 Testing
DS0 Testing Run the DSO Testing application to measure the frequency and power of any received tones and monitor the ABCD bits of a DSO sub channel. The application also allows you to listen to the audio in a timeslot using the supplied headset. To run a DSO test, connect the T1 signal to be tested, select a timeslot number, select PCM Companding (u-Law/A-Law) and press to start a DSO test. -
Page 91: T3 Analyzer Option
7. T3 ANALYZER OPTION Top Menu The T3 analyzer option starts up with the top menu shown to the right. It Includes the following test functions: BERT SETUP... -
Page 92: Set Up
Set Up Use the Setup menu to configure the T3 transmitter and receiver parameters. Each configuration parameter is described below: Pattern Frame OFF, 63, 511, 2047, 2-15-1, 2- 21-1, 2-23-1, QRSS, All 0’s, All • Unframed – all 1, 1:3, 1:7, 1:15, 1:31. The bits used for pattern can also be data... - Page 93 Clock Tx Termination • • Internal • • Recovered High • • External •...
- Page 94 Rx Termination Loopback • • • • Bridge Local • Remote...
- Page 95 Saving the SETUP The buttons labeled Delete Config and Save Config allow you to delete and save any configuration file currently shown in the Config window. If the config is not saved, it will retain the last config used. To save a config, press the Save Config button. You can save as Default or you can enter a new name for the current configuration.
-
Page 96: Bit Error Testing (Bert)
Bit Error Testing (BERT) Run the BERT application to check the integrity of a T3 (DS3) circuit. It can be run with a loopback or end to end with another test set. The indicators at the top display the current and historical state of SIGNAL/FRAME/ALARM/ERROR/PSYNC events. - Page 97 A typical loop around or point-to-point Bit Error Test setup is shown below. After the COAX connection is made, press button.
- Page 98 Check the BERT main screen and observe the following: • The real-time SIGNAL, PSYNC and FRAME (with Framed data) indicators at the top of the screen are Green. Red indicates a Tip: problem. If these indicators are red, should Click on any history indicator box check all circuit connections and T3 setup.
- Page 99 Tip: Click in the Errors or Rate columns to display a histogram for the corresponding metric. Click on the thin gray bar to Tip: hide it. To verify that everything is setup properly after Green arrows at the bottom starting BERT, click on can be used to display the LGC button to force additional metrics, alarms and...
-
Page 100: Alarm Menu
7.3.1 ALARM menu To access the Alarms menu, press from the main BERT screen. Use this menu to: • Monitor the current and history alarm status to determine which alarms caused the LED to turn red. • Force an alarm condition onto the T3 line by pressing an Alarm Insertion button. -
Page 101: Error Menu
7.3.2 G.821 ERROR menu To access this menu, press from the ALARM menu. Use this menu to: • Monitor the current and history ERROR status to determine the severity of the errors that generated an ERROR indication. • Tip: Monitor G.821 counters and percentages. Click in the Details or o EFS (Error Free Seconds) % columns to display a... -
Page 102: Line Menu
7.3.3 Line menu To access this menu, press from the G.821 Error menu. Use this menu to: Tip: • Monitor line parameters. Click in the Details o Frequency (Hz) column to display a • Display a histogram histogram for the frequency. -
Page 103: E3 Analyzer Option
8. E3 ANALYZER OPTION Top Menu The E3 analyzer option starts up with the top menu shown to the right. It Includes the following test functions: BERT SETUP... -
Page 104: Set Up
Set Up Use the Setup menu to configure the E3 transmitter and receiver parameters. Each configuration parameter is described below: Pattern Frame OFF, 63, 511, 2047, 2-15-1, 2- 21-1, 2-23-1, QRSS, All 0’s, All • Unframed – all 1’s, 1:3, 1:7, 1:15, 1:31. The bits used for pattern can also be data... - Page 105 Clock Tx Termination • • Internal • • Recovered High • • External •...
- Page 106 Rx Termination Loopback • • • • Bridge Local • Remote...
- Page 107 Saving the SETUP The buttons labeled Delete Config and Save Config allow you to delete and save any configuration file currently shown in the Config window. If the config is not saved, it will retain the last config used. To save a config, press the Save Config button. You can save as Default or you can enter a new name for the current configuration.
-
Page 108: Bit Error Testing (Bert)
Bit Error Testing (BERT) Run the BERT application to check the integrity of an E3 circuit. It can be run with a loopback or end to end with another test set. The indicators at the top display the current and historical state of SIGNAL/FRAME/ALARM/ERROR/PSYNC events. - Page 109 A typical loop around or point-to-point Bit Error Test setup is shown below. After the COAX connection is made, press button.
- Page 110 Check the BERT main screen and observe the following: • The real-time SIGNAL, PSYNC and FRAME (with Framed data) indicators at the top of the screen are Green. Red indicates a Tip: problem. If these indicators are red, should Click on any history indicator box check all circuit connections and E3 setup.
- Page 111 Tip: Click in the Errors or Rate columns to display a histogram for the corresponding metric. Click on the thin gray bar to Tip: hide it. To verify that everything is setup properly after Green arrows at the bottom starting BERT, click on can be used to display the LGC button to force additional metrics, alarms and...
-
Page 112: Alarm Menu
8.3.1 ALARM menu To access the Alarms menu, press from the main BERT screen. Use this menu to: • Monitor the current and history alarm status to determine which alarms caused the LED to turn red. • Force an alarm condition onto the T3 line by pressing an Alarm Insertion button. -
Page 113: Error Menu
8.3.2 G.821 ERROR menu To access this menu, press from the ALARM menu. Use this menu to: • Monitor the current and history ERROR status to determine the severity of the errors that generated an ERROR indication. • Tip: Monitor G.821 counters and percentages. Click in the Details or o EFS (Error Free Seconds) % columns to display a... -
Page 114: Line Menu
8.3.3 Line menu To access this menu, press from the G.821 Error menu. Use this menu to: Tip: • Monitor line parameters. Click in the Details o Frequency (Hz) column to display a • Display a histogram histogram for frequency. To exit, press... -
Page 115: Co-Dir Analyzer Option
9. Co-Dir ANALYZER OPTION Top Menu The CO-DIR analyzer option uses the NetProbe’s G.703 64kbps data interface to run Bit Error and Propagation Delay tests. To access this option press the DATACOM button on the main menu. The Co-Dir application starts with the top menu shown to the right with buttons for the following test functions: BERT PDL (propagation delay test) -
Page 116: Set Up
Set Up Pull down the Interface drop down and select “Codir” as shown below. Use the Setup menu to configure the Co-Dir Loopback parameter. All other are fixed. Loopback • • Local • Remote... - Page 117 Saving the SETUP The buttons labeled Delete Config and Save Config allow you to delete and save any configuration file currently shown in the Config window. If the config is not saved, it will retain the last config used. To save a config, press the Save Config button. You can save as Default or you can enter a new name for the current configuration.
-
Page 118: Bit Error Testing (Bert)
Bit Error Testing (BERT) Run the BERT application to check the integrity of a G.703 64kbps Co-Dir circuit. It can be run with a loopback or end to end with another test set. The indicator at the top displays the current and historical state of the patter sync. The test results are reported as errors and error rates. - Page 119 A typical loop around or point-to-point Bit Error Test setup is shown below. After the bantam or datacom adaptor cable connection is made, press to start the BERT test. Pattern Sync LED turns Green when When errors are detected, the the transmitted pattern matches the LOGIC (LGC) ERROR counter will received pattern.
- Page 120 Check the BERT main screen and observe the following: • The real-time PAT SYNC is green. Red indicates a problem. If these indicators are red, you should check all circuit connections Tip: and Co-Dir setup. Click on the history indicator box to reset the history indicator.
- Page 121 Tip: Click in the Errors or Rate columns to display a histogram for the corresponding metric. Click on the thin gray bar to Tip: hide it. To verify that everything is setup properly after Green arrows at the bottom starting BERT, click on can be used to display the LGC button to force additional G.821 metrics and...
-
Page 122: G.821 Error Menu
9.3.1 G.821 ERROR menu To access this menu, press from the main BERT screen. Use this menu to: • Monitor the current and history PAT SYNC status to determine the severity of the errors that generated an ERROR indication. • Monitor G.821 counters and percentages. -
Page 123: Frequency Measurement Menu
9.3.2 Frequency Measurement menu To access this menu, press from the G.821 ERROR menu. Use this menu to view the real-time Tx and Rx Frequency and to display a histogram. Example shown has internal clock so no frequency values are displayed. To exit, press... -
Page 124: Propagation Delay Measurement (Pdl)
Propagation Delay Measurement (PDL) Run the Propagation Delay Measurement application to measure the round trip loopback delay around the Co-Dir circuit. A typical loop around connection for measuring PDL is shown below. After the bantam or datacom adaptor cable connection is made, press to start the PDL measurement. - Page 125 When the PDL measurement begins, the tester will first reset the displayed results and then calibrate. After a couple seconds, the Current Delay, Minimum Delay and Maximum Delay values will display along with a histogram. The Current Delay, Minimum Delay and Maximum Delay is measured and reported in milli-seconds (ms) and unit intervals (ui’s).
-
Page 126: Datacom Analyzer Option
10. DATACOM ANALYZER OPTION The DATACOM analyzer option provides DTE and DCE testing on RS-232 (V.24), RS-530, RS-449, V.35 and X.21 circuits using a proprietary datacom adaptor cable. To access this option press the DATACOM button on the main menu. The Datacom application with the top menu shown to the right with buttons for the following test functions: BERT PDL (propagation delay test) -
Page 127: Setup
10.1 SETUP Use the Setup menu to configure the Datacom transmitter and receiver parameters. Each configuration parameter is described below: Pattern Interface OFF, 63, 511, 2047, 2-15-1, 2- 21-1, 2-23-1, QRSS, All 0’s, All • RS-232 1, 1:3, 1:7, 1:15, 1:31. The •... - Page 128 Bit Rate (bps) Synthesizer • • Enter bit rate • • 1200 • 2400 • 4800 • 9600 • 14400 • 19200 • 38400 • 48000 • 64000 • 57600 • 115200 Note: With RS-232 Async interface, • Synthesizer the setup parameter Synthesizer is replaced with Data Bits (Size).
- Page 129 Tx Clock Rx Clock • • Internal (rising edge) Internal (rising edge) • • Internal (falling edge) Internal falling edge) • • Recovered (rising edge) Recovered (rising edge) • • Recovered (falling edge) Recovered (falling edge) Note: With RS-232 Async interface, the setup parameters Tx Clock and Rx Clock are replaced with Parity and Stop Bits.
- Page 130 Loopback Ex Mode • • • • Local • Remote...
- Page 131 Saving the SETUP The buttons labeled Delete Config and Save Config allow you to delete and save any configuration file currently shown in the Config window. If the config is not saved, it will retain the last config used. To save a config, press the Save Config button. You can save as Default or you can enter a new name for the current configuration.
-
Page 132: Bit Error Testing (Bert)
10.2 Bit Error Testing (BERT) Run the BERT application to check the integrity of a datacom circuit. It can be run with a loopback or end to end with another test set. The indicator at the top displays the current and historical state of the patter sync. The test results are reported as errors and error rates. - Page 133 A typical loop around or point-to-point Bit Error Test setup is shown below. If the tested device is a DCE device, set EX Mode to DTE and use the DTE datacom cable. If the tested device is a DTE device, set EX Mode to DCE and use the DCE datacom cable. After the datacom cable connection is made, press to start the BERT test.
- Page 134 Check the BERT main screen and observe the following: • The real-time PAT SYNC is green. Red indicates a problem. If these indicators are red, you should check all circuit connections, Datacom Tip: setup and Handshake signals (see below). Click on the history indicator box •...
- Page 135 Tip: Click in the Errors or Rate columns to display a histogram for the corresponding metric. Click on the thin gray bar to Tip: hide it. To verify that everything is setup properly after Green arrows at the bottom starting BERT, click on can be used to display the LGC button to force additional G.821 metrics and...
-
Page 136: Error Menu
10.2.1 G.821 ERROR menu To access this menu, press from the main BERT screen. Use this menu to: • Monitor the current and history PAT SYNC status to determine the severity of the errors that generated an ERROR indication. • Monitor G.821 counters and percentages. -
Page 137: Frequency Measurement Menu
10.2.2 Frequency Measurement menu To access this menu, press from the G.821 ERROR menu. Use this menu to view the real-time Tx and Rx Frequency and to display a histogram. Example shown has internal clock so no frequency values are displayed. To exit, press... -
Page 138: Propagation Delay Measurement (Pdl)
10.3 Propagation Delay Measurement (PDL) Run the Propagation Delay Measurement application to measure the round trip loopback delay around the Datacom circuit. A typical loop around connection for measuring PDL is shown below. After the datacom adaptor cable connection is made, press to start the PDL measurement. - Page 139 When the PDL measurement begins, the tester will first reset the displayed results and then calibrate. After a couple seconds, the Current Delay, Minimum Delay and Maximum Delay values will display along with a histogram. The Current Delay, Minimum Delay and Maximum Delay is measured and reported in milli-seconds (ms) and unit intervals (ui’s).
-
Page 140: Ieee C37.94 Analyzer Option
11. IEEE C37.94 ANALYZER OPTION 11.1 IEEE C37.94 Tele-protection Power Lines have redundancy. Relays switching the redundant lines are controlled by multiplexers and tele-protection circuits. Fiber optic lines are preferred over copper lines to connect this equipment due to their immunity to electrical noise. In a typical tele-protection telecom network using IEEE C37.94 optical links, error free operation is of extreme importance to assure positive Power Relay closure/opening and reporting of this... -
Page 141: Introduction
11.2 Introduction The C37.94 option installed in the NetProbe 2000 is intended for monitoring, testing and troubleshooting of IEEE C37.94 optical link. The option includes a SFP 850nm multimode optical transceiver. The SFP specification is shown in the section Technical Specification of this manual. -
Page 142: Setup
11.4 SETUP Configuring setup typically requires a few simple steps: 1. Choose setup configuration from the list of previously saved configs or leave the default. Choose a test of Unlimited, 30 s, 1 min, 5 min, 10 min, 30 min, 1hr, 3 hr. 6 hr, 12 hr, 1 day, 2 days, 3 days or user-defined. - Page 143 Saving the SETUP The buttons labeled Delete Config and Save Config allow you to delete and save any configuration file currently shown in the Config window. If the config is not saved, it will retain the last config used. To save a config, press the Save Config button. You can save as Default or you can enter a new name for the current configuration.
-
Page 144: Bit Error Testing (Bert)
11.5 Bit Error Testing (BERT) Run the BERT application to check the integrity of an IEEE C37.94 datacom circuit. It can be run with a loopback or end to end with another test set. The indicator at the top displays the current and historical state of the patter sync. The test results are reported as errors and error rates. - Page 145 There are three IEEE C37.94 testing connections: 1. End to end testing between two NetProbe 2000 testers. 2. Terminating teleprotection equipment that is looped. 3. Terminating the multiplexer equipment that is looped. Each is illustrated below End-to-End testing between two NetProbe 2000 test sets,...
- Page 146 NetProbe is terminating the teleprotection equipment which is looped, via the optical link. NetProbe is terminating the multiplexer equipment which is looped, via the optical link.
- Page 147 After the fiber optic connection is made, press to start the BERT test. Pattern Sync LED turns Green when When errors are detected, the the transmitted pattern matches the LOGIC (LGC) ERROR counter will received pattern. increment.
- Page 148 Check the BERT main screen and observe the following: • The real-time PSYNC LED is green. Red indicates a problem. If these indicators are red, you should check all circuit connections Tip: and C7.94 setup. Click on the history indicator box •...
- Page 149 Tip: Click in the Errors or Rate columns to display a histogram for the Tip: corresponding metric. To verify that everything is setup properly after Green arrows at the starting BERT, click on bottom can be used to the LGC button to force display additional G.821 and detect a single bit metrics, Alarms and...
-
Page 150: G.821 Error Menu
11.5.1 G.821 ERROR menu To access this menu, press from the main BERT screen. Use this menu to: • Monitor the current and history PSYNC status to determine the severity of the errors that generated an ERROR indication. • Monitor G.821 counters and percentages. o EFS (Error Free Seconds) Tip: o ES (Errored Seconds) -
Page 151: Alarm Menu
11.5.2 ALARM menu To access the Alarms menu, press from the main BERT screen. Use this menu to: • Monitor Loss Of Signal and Yellow Alarm occurrences. • Force an alarm condition onto the C37.94 circuit by pressing an Alarm Injection button. -
Page 152: Live Traffic Menu
11.5.3 Live Traffic menu To access this menu, press from the Alarm menu. Framing Use this menu to view the binary and hexadecimal 2 bytes value in each timeslot(channel). Each C37.94 frame has 32 bytes ( timeslots), numbered on the Live Traffic screen from 0 to 31. Overhead6 bytes Bytes 0-1 is Header... -
Page 153: Optical Power
11.6 Optical Power After the fiber optic connection is made, press to start measuring optical power. This application provide two types of information: Optical Power and SFP Details. Tip: Click in the Details columns to 11.6.1 Optical Power display a histogram for the corresponding metric. -
Page 154: Sfp Info
11.6.2 SFP Info To access this menu, press from the Optical Power menu. Use this menu to display the SFP Details listed below: • Vendor name • Part # • Serial # • Wavelength • LOS (Loss of Sync • SFP presence •... -
Page 155: Propagation Delay Test (Pdl)
11.7 Propagation Delay Test (PDL) Run the Propagation Delay Measurement application to measure the round trip loopback delay around the IEEE C37.94 circuit. PDL has two operating modes which differ in precision and refreshing intervals. • Continuous: data is sent continuously, measurement precision is 125 µs. •... - Page 156 NetProbe is terminating the teleprotection equipment multiplexer equipment which is looped, via the which is looped, via the optical link. optical link. End-to-End testing between two NetProbe 2000 test sets, terminating the teleprotection circuit at each end, via the optical link.
- Page 157 When the PDL measurement begins, the tester will first reset the displayed results and then calibrate. After a couple seconds, the Current Delay, Minimum Delay and Maximum Delay values will display along with a histogram. The Current Delay, Minimum Delay and Maximum Delay is measured and reported in milli-seconds (ms) and unit intervals (ui’s).
-
Page 158: C37.94 Test Records
11.8 C37.94 Test Records The Test Results menu shows a log of all tests. To view detailed test results, click on the test result of interest, highlight it and press From the detailed results, press to display a histogram. - Page 159 To export results, follow the brief easy steps below or see Section 4.4 Test Results for more details. 1. Connect a USB drive to the NetProbe 2000 using the supplied USB mini adaptor to export by USB. Connect a CAT 6 Ethernet network cable to the NetProbe 2000 to export by FTP or email.
-
Page 160: Gigabit Basic Analyzer Option
12. Gigabit Basic ANALYZER OPTION 12.1 Introduction The Gigabit Basic analyzer option provides comprehensive performance testing on 10/100 Mbps and 1Gigabit Ethernet networks. To access this option, press the Ethernet button on the main menu. The Gigabit Basic application includes the following test functions: BERT RFC2544 Loopback... -
Page 161: Setup
12.2 Setup Press the SETUP button configure the Test Port, Network Setting and display SFP information. 12.2.1 SFP Identity To identify the SFP device plugged into the tester SFP socket, press on the SFP tab. The module information includes: • SFP EXISTence •... -
Page 162: Port Setup And Port Status
12.2.2 PORT SETUP and PORT STATUS Select PORT to setup: • Transceiver Mode: optical or electrical • Auto-Negotiations: enabled or disabled • Speed: 10Mbps, 100Mbps, 1Gbps or Auto • Duplex: Full, Half, Auto PORT STATUS shows: • Link Status - Up or DOWN •... -
Page 163: Wiremap
12.3 Wiremap While not required by IEEE 802.3-2004, Ethernet cable diagnostics are commonly used nowadays. This feature is considered very important by the majority of the PHY vendors. The feature provides extensive network and cable operating and status information: • Cable length of properly terminated cable •... -
Page 164: Accuracy
12.3.2 Accuracy When properly terminated, the WIREMAP reports the approximate cable length (in meters) for each of the four cable pairs A, B, C, and D, the operation range being between 7 and 140 meters with 5-meter accuracy. Cable Termination Proper termination of the CAT 5/6 cable requires 100-ohm differential impedance between the positive and negative cable terminals. -
Page 166: Loopback
12.4 Loopback The Loopback is a feature of NP2000 GigE-BAS option that allows looping Ethernet traffic back to the sender, on Layer 1, Layer 2 and Layer 3 to run various round trip tests. Loopback supports following modes: • Layer 1 – equivalent of a hardwire cable loop. 100% of the Ethernet signal is looped. -
Page 167: Filter
12.4.1 Filter You may set filter for L2 by tapping the FILTER button. On displayed screen activate particular rule by checking it. Filter is applicable for Layer 2 loop mode or higher and is bypassed after selecting Layer 1 loop mode. •... -
Page 168: Statistics
12.4.2 Statistics Statistics tab reports information about inbound and outbound traffic. Screen provides following parameters: • Frames – total number of received and transmitted frames. • Short Frames – total number of frames received with an Ethernet frames size smaller than 64B. •... -
Page 169: Running Loopback
12.4.3 Running loopback To run loopback function, follow the steps below: • Make cable connection. Typical loop connection is shown below. • Depending on the traffic type that you want to loop back, configure suitable Loop Mode (Layer 1, Layer 2, Layer •... -
Page 170: Monitor
12.5 Monitor The Monitor is a useful tool for monitoring devices, services, ports or protocols in local area network. It provides information about network traffic and bandwidth usage. It can monitor all network traffic or just a specific traffic filtered out from network. -
Page 171: Filter
12.5.1 Filter Traffic filter allows to monitor only specific traffic. To setup Rx filter tap button and customize filter rules. The rules can be defined for following layers: MAC, VLAN, MPLS, IP, L4(UDP, TCP). • MAC – define source and destination MAC addresses. •... - Page 172 • Stacked VLAN – available options are: Off, 1 tag, 2 tags. Select at least one tag to enable VLAN filter. • Type – select VLAN protocol identifier. • CFI – set Canonical Format Indicator (1 for Ethernet). • ID – set identifier (0-4095) •...
- Page 173 • IP – define source and destination IP address. • MASK – set bit mask to indicate which parts of IP address are available for examination. A 255 octet means that the equivalent octet in IP address must mach exactly. 0 means that the equivalent octet doesn’t matter. •...
-
Page 174: Statistics
12.5.2 Statistics Statistics tab reports information about network traffic. Screen provides following parameters: • Bandwidth – receive rate in terms of a percentage of line rate. • Line Rate – line bit rate. • L2 Rate – MAC layer receive bit rate. •... -
Page 175: Running Monitor
12.5.3 Running Monitor To run monitor function, follow the steps below: • Make cable connection. Use 10/100/1000 test port or SFP test port with optical transceiver. To monitor network traffic you can just connect to a mirrored switch port, hub or TAP device. •... -
Page 176: Bit Error Testing (Bert)
12.6 Bit Error Testing (BERT) This option supports bit error testing (BERT) over Ethernet Layer 1 Framed, Layer 2, Layer 3 and Layer 4. Test can be performed with fixed, pseudo random or user defined patterns. 12.6.1 Setup The main BERT screen is divided between Setup and Results with a tab for each. When you first enter the BERT application, the Setup tab is active. - Page 177 Patterns 15-1 20-1 23-1 23-1 Patter choices include: All 1’s, All 0’s, 1:1, 1:3, 2:2, 5:32, 2 Test Type The selection for Test Type determines the ISO layer (Layer 1 – Layer 4) that you wish to carry the pattern data. Layer 1 Framed –...
- Page 178 Layer 2 without VLAN Click in the colored bar to configure the MAC...
- Page 179 Layer 2 with VLAN Click in the colored bar to configure the MAC and VLANs...
- Page 180 Layer 3 without MPLS (shown with 1 VLAN tag) Click in the colored bar to configure the MAC VLANs and IP.
- Page 181 Layer 3 with MPLS (shown with 1 VLAN tag) Click in the colored bar to configure the MAC, VLANs, IP and MPLS tags.
- Page 182 Layer 4 (shown with 1 VLAN tag and 1 MPLS tag) Click in the colored bar to configure the MAC, VLANs, IP, MPLS tags and UDP ports.
-
Page 183: Rx Traffic Filtering
Rx traffic filtering Enabling the filters applies the header settings to the received traffic. If the header settings of the incoming traffic match the configured settings on the local unit, the traffic is considered test traffic, otherwise it is considered nontest traffic. The traffic filter parse the headers of incoming packets and then applies all enabled rules to determine if packet is considered as part of test traffic. - Page 184 Layer Filter Filtering rule Rx MAC source address == Tx MAC destination address MAC src. MAC dst. Rx MAC destination address == Tx MAC source address Eth. Type Rx Eth. Type == Tx Eth. Type Type Rx VLAN Type == Tx VLAN Type VLAN Rx ID == Tx ID Priority...
-
Page 185: Traffic Menu
TRAFFIC menu • Select Frame Size. You can enter a value from 64 to 9600 by clicking on an entry box. • Select desired Bandwidth in % or Mbps • Tx FPS shows frame rate (frames per second) value for desired bandwidth. -
Page 186: Error Injection Menu
ERROR INJECTION menu • Select desired error injection type: Code, Bit or • Select Injection Flow type: Single, Count or Rate. If Rate is chosen, select a rate from the pulldown menu Once running BERT, you will tap on the syringe to start error Injection. -
Page 187: Testing Topologies
There are two methods used to run BERT: End-to-End and Loopback. Each is illustrated below. Once the connections are made, press the start button. Loopback BERT Test End-to-End BERT Test This test requires a hard loop or This test is preformed between (2) NetProbe 2000 running loopback or a NetProbes. Each tester must use the Reflector. same pattern. -
Page 188: Bert Results
12.6.3 BERT Results Tip: Click in the Current or Total Error Click on RESULTS to display five tabs SUMMARY, RATES, ERRORS, ALARMS and DELAY. columns to display a histogram for the corresponding metric. - Page 189 Note that DELAY results are available when time-stamping is enabled. For more details see BERT TRAFFIC menu section.
-
Page 190: Rfc 2544 Conformance Testing
12.7 RFC 2544 Conformance Testing 12.7.1 Fundamentals The RFC 2544 conformance testing was introduced as a method to benchmark interconnected network devices. Because of its ability to measure throughput, burstability, frame loss and latency, this methodology is also used to test Ethernet- based networks and is now the de facto standard when benchmarking an Ethernet network. - Page 191 reporting the performance of a network device in an overloaded state, as it can be a useful indication of how a device would perform under pathological network conditions such as broadcast storms. The burstability or back-to-back test refers to the fixed length of frames that are presented at a rate such that there is the minimum legal separation for a given medium between frames (maximum rate) over a short to medium period of time, starting from an idle state.
-
Page 192: Single Netprobe 2000 Or Dual Netprobe 2000 Test Scenario
12.7.2 Single NetProbe 2000 or Dual NetProbe 2000 Test Scenario The simplest RFC 2544 test scenario is to have a NetProbe 2000 send the Framed Layer 1 RFC 2544 traffic to a hard loop. Most likely though, you will want to test ISO layers 2-4 and for that scenario, you will need a remote NetProbe 2000 running loop back at the remote end. - Page 193 downstream direction. In such a case, using a loopback tool will always yield the same results since the measurement will be affected by the lowest throughput, and test results will not show that one direction has higher performance than the other. The same scenario will occur if a network misconfiguration is present in only one direction of the service. Depending on the error, the problem will not be identified with round-trip measurements only.
-
Page 194: Rfc 2544 Setup
12.7.3 RFC 2544 Setup The following settings have to be selected for an RFC 2544 test: PROFILE Tab Profile allows the user to save and load user-defined test configurations. To save the current configuration data, tap the Save button and save or specify a new profile name. -
Page 195: General Tab
GENERAL Tab • Select Test Level as Layer 1 Framed, Layer 2, Layer 3 or Layer 4) • Select Test Frame size to be test as 64, 128, 256, 512, 1024 or 1518 bytes. You can also enter a value from 64 to 9600 by clicking on an entry box. •... - Page 196 Layer 2 Click in the colored bar to configure the MAC.
- Page 197 Layer 3 Click in the colored bar to configure the MAC and IP.
- Page 198 Layer 4 Click in the colored bar to configure the MAC, IP and UDP Port. See Rx traffic filtering paragraph in 12.6.1 section to get details of incoming traffic filtering setup. Now you will need to define RFC 2544 test parameters for the Throughput, Latency, Frame Loss and Burst tests. This done by entering values (defined below) for the tabs labeled THROUGH, LATENCY, FRAME LOSS and BURST.
-
Page 199: Throughput Tab
THROUGHput Tab • Max Rate - Defines the rate so that the throughput test should begin with, in terms of a percentage of line rate or in Mbps. • Accuracy – Defines how precise the result must be. The accuracy is based on line rate (% or Mbps). -
Page 200: Frame Loss Tab
FRAME LOSS Tab • Max Rate – Defines the rate so that the frame loss test should begin with, in terms of a percentage of line rate or in Mbps. • Step Size – Defines frame loss test step size. The step size is based on line rate (% or Mbps). -
Page 201: Running A Test
12.7.4 Running a Test • Press and the screen will switch to the TEST tab and start running each enabled test using the parameters configured in the Setup tab. • Observe that the Status displays “Running” and that “In Progress…” displays next to the active test. - Page 202 Click on the alarm led indicator to get details. Alarm tip: Icon Meaning Time – accumulated number of No alarms are present during the test seconds that the alarm remained raised. At least one alarm was present the test # – total number of times the At least one alarm is present during the test alarm event occurred.
-
Page 203: Rfc 2544 Results
12.7.5 RFC 2544 Results Click on the RESULTS tab and then the appropriate test tab to view a table of results of each iterative test along with its PASS/FAIL status. Each test type THROUGHput, LATENCY, FRAME LOSS and BURST is displayed below. THROUGHput TEST Tip: To see graphical results, click on... - Page 204 LATENCY TEST This tab displays the Latency test results for either Latency or Jitter by using the drop down menu.
- Page 205 FRAME LOSS TEST This tab displays the Frame Loss test results. Use the Rate Step drop down menu to display results for a specific rate.
- Page 206 BURST TEST This tab displays the BURST test results. Use the Rate Step drop down menu to display results for a specific rate.
-
Page 207: Rfc 2544 Test Records
12.7.6 RFC 2544 Test Records The Test Results menu shows a log of all tests. To view detailed test results, click on the test result of interest, highlight it and press From the detailed results, press to display specific results, log and graph. - Page 208 To export results, follow the brief easy steps below or see Section 4.4 Test Results for more details. 1. Connect a USB drive to the NetProbe 2000 using the supplied USB mini adaptor to export by USB. Connect a CAT 6 Ethernet network cable to the NetProbe 2000 to export by FTP or email.
-
Page 209: Ethernet - Ip Tools
12.8 Ethernet - IP TOOLS The Ethernet option includes a set of diagnostic tools. With these tools you'll get an outside view of your network response time and network topology, which allows you to track down network issues more easily. The IP Tools include the following functions: Ping Trace Route... -
Page 210: Ethernet - Ping
12.8.1 Ethernet – PING Ping is a diagnostic function used to test the reachability of a host device on an IP network and to measure the round- trip time (latency) for messages sent from the NetProbe to the host device. SETUP Tab Use this tab to setup the following Ping parameters: •... - Page 211 RESULTS Tab Use this tab to observe the PING results. The table display a list of IP addresses along with their corresponding round-trip time (latency) and Time to Live (TTL) Addional summary metrics include: • Number of packets Sent • Number of Packets Received •...
-
Page 212: Ethernet - Trace Route
12.8.2 Ethernet - Trace Route Trace Route is a diagnostic tool for displaying the routed path and measuring transit delays of packets across an IP network. The history of the route is recorded as the round-trip times (latency) of the packets from the NetProbe to each successive host (remote node) along the routed path. -
Page 213: Ethernet - Discover
12.8.3 Ethernet - Discover Discover scans and detects all network devices within a range of IP addresses. The range specified must be entered in CIDR notation. CIDR notation is constructed from: • IP address • Prefix – number of leading ‘1’ in the routing prefix mask To run DISCOVER, follow the steps below: 1. -
Page 214: Ethernet - Ftp
12.8.4 Ethernet - FTP FTP is used to check the status of an FTP server by measuring the time from to download a host file to the NetProbe or upload file to a server. To run FTP download test, follow the steps below: 1. - Page 215 To run FTP upload test, follow the steps below: 1. Check Upload radio button. 2. Select an FTP remote server directory where test file will be uploaded. 3. Enter User and Password in the entry blocks. If your FTP does not require authentication leave it empty.
-
Page 216: Ethernet - Http
12.8.5 Ethernet - HTTP HTTP is used to test and benchmark the performance of web applications, web servers. The HTTP test allow the NetProbe to measure the time required to download a web page. To run HTTP, follow the steps below: 1. -
Page 217: Gigabit Advanced Analyzer Option
13. Gigabit Advanced ANALYZER OPTION 13.1 Introduction The Gigabit Advanced analyzer option adds to the Gigabit Basic analyzer option to provide comprehensive performance testing on 10/100 Mbps and 1Gigabit Ethernet networks. To access this option, press the Ethernet button on the main menu. -
Page 218: Setup
13.2 Setup Press the SETUP button to configure the Test Port, Network Setting and display SFP information. See 12.2 Setup section. 13.3 Traffic Generator 13.3.1 Overview Traffic Generator test generates up to 8 streams (also known as multi-streams). The stream properties are configured independently for each stream. -
Page 219: Traffic Generator Setup
• Round Trip Latency 13.3.2 Traffic Generator Setup PROFILE Tab Profile allows the user to save and load user-defined test configurations. To save the current configuration data, tap the Save button and save or specify a new profile name. To load a specific profile which was saved previously, select its name from the drop down menu. -
Page 220: General Tab
GENERAL Tab Per stream setup: • Enable Stream: Enables or disables the current stream. Press the to copy the 1 stream to all other streams (2-8). • Stream Layer: Selects the frame structure for the current stream. The choices are: Layer 1 Framed, Layer 2 (MAC), Layer 3 (MAC/IP), Layer 4 (MAC/IP/UDP). •... -
Page 221: Traffic Tab
TRAFFIC Tab Per stream setup: • Frame Size: User defined from 64 bytes to 9600 bytes. For Layer 1 Framed and Layer 2 you are able to set frame size from 48 to 9600 bytes. • Tx Rate: Utilized Line Rate (URL) % •... - Page 222 Traffic shaping types: • Constant: The network traffic is generated in constant mode and the bandwidth of the traffic generation can be set based on specified Tx Rate. • Burst: The network traffic is generated in burst mode. The burst Period and Duty Cycle are configurable.
-
Page 223: Running The Traffic Generator
13.3.3 Running the Traffic Generator • Load a profile. Make sure that at least one stream is enabled • Connect a CAT6 Ethernet cable to the 10/100/1000 test port ensure that the test port Active. • Ensure that test port link Activelink is up. •... -
Page 224: Traffic Generator Results
13.3.4 Traffic Generator Results SUMMARY Tab Click on this tab to display Frame count statistics for all enabled streams. Total transmitted and received frames are reported. • Tx: displays the number of transmitted frames by each stream • Rx: displays the number of received framed by each stream... -
Page 225: Through Tab
THROUGH Tab Click on this tab to display the transmit and receive rates for each stream. You can specify the values to be displayed as line rate (URL – Utilized Line Rate) or in Frames per Second (fps). Use buttons to switch between the Minimum, Maximum, Current and Average latency values. -
Page 226: Sequence Tab
SEQUENCE Tab Click on this tab to display Out of Sequence events. An Out-Of-Sequence is declared when a frame is received with a sequence number smaller than a previously received frame. Per stream Out-Of-Sequence statistics: • Count: displays total number of frames declared as Out-Of-Sequence •... -
Page 227: Latency Tab
LATENCY Tab Click on this tab to display the round trip latency for all enabled streams. Use buttons to switch between Current/Average and Minimum/Maximum latency values. • Current: displays the average latency value of last second • Average: displays the average latency value since the beginning of the test •... -
Page 228: Alarms Tab
ALARMS Tab Click on this tab to display detected Alarms. The alarms are displayed with a green or red background as described below; otherwise, they will be displayed with a gray background. The error count, amount of time in seconds that alarm remained raised during the test and total number of times the alarm event occurred are also displayed. -
Page 229: Overview
13.4 Y.1564 13.4.1 Overview NetProbe 2000 Y.1564 test suite is fully compliant with ITU-T Y.1564 and offers an efficient method of qualifying and troubleshooting Ethernet services. The NetProbe can perform two-way tests (round-trip) with a far-end loop device. Key features of NetProbe 2000 Y.1564 are: •... -
Page 230: Setup
13.4.2 Y.1564 Setup PROFILE Tab Profile allows the user to save and load user-defined test configurations. To save the current configuration data, tap the Save button and save or specify a new profile name. To load a specific profile which was saved previously, select its name from the drop down menu. -
Page 231: Global Tab
GLOBAL Tab Global setup for Y.1564 includes: • Configuration Test: Enables configuration test • Performance Test: Enables performance test. If enabled, set time in HH:MM:SS format for the Service Performance test duration. Default setting is 15 minutes. -
Page 232: General Tab
GENERAL Tab Tab includes per service setup: • Enable Stream: Enables or disable current stream. • Press the button to copy the 1 service setup to other services (2-8). • Stream Layer: Selects the frame structure of current stream. The choices are: Layer 2 (MAC), Layer 3 (MAC/IP), Layer 4 (MAC/IP/UDP). - Page 233 Traffic coloring enables user to tell the network which of the frames should be marked as green frames (high priority level) and which frames should be marked as yellow frames (low priority level). Color mode can be on or off, and set independently for each service.
-
Page 234: Traffic Tab
TRAFFIC Tab Display setup panel that enables user to define frame size and bandwidth profile for each service to be tested. • Frame Size: Enter a value from 64 to 9600 Byte by clicking on the entry box. • CIR (Committed Information Rate): Define CIR value •... -
Page 235: Sac Tab
SAC Tab The Service Acceptance Criteria (SAC) parameters define the pass/fail verdict thresholds for service. The set of values defines minimum requirements to ensure that the service meets witch Service Level Agreement. SAC parameters are only guaranteed for traffic conforming to the CIR. The following values comprise the Service Acceptance Criteria: •... -
Page 236: Ramp Tab
RAMP Tab For each service, a step load test may be used to gradually reach the CIR. The RAMP tab allows the user to create multiple CIR test steps. RAMP configuration includes: • CIR Steps: define number of steps to be tested in configuration CIR test •... -
Page 237: Running A Test
13.4.3 Running a Test • Configure the setup or load a test profile form the PROFILE tab under Setup. • Make sure that at least one service is enabled. • Connect a CAT6 Ethernet cable to the 10/100/1000 test port and ensure that the test port Active. -
Page 238: Results
13.4.4 Y.1564 Results Overview of measurements Use the scroll bar to see the following measurements from the Configuration Test. • ULR: Utilized Line Rate is an average rate of frames including the minimum size interframe gap, the preamble, the start of frame delimiter and the service frame bits starting with the MAC address and ending with the FSC. •... -
Page 239: Configuration Test Tab
Configuration Test Tab Click on this tab to display the Service Configuration test results: • Step Verdict • Tx ULR (Tx Utilization Line Rate) • Rx ULR (Rx Utilization Line Rate) • Tx Frame Count • Rx Frame Count • Frame Loss Count •... - Page 240 The service configuration test is broken down into three steps. The steps are tested individually for all services and evaluated as follows: • CIR Test: The CIR test step is considered to pass if the computed performance metrics (FTD, FDV, FLR) are within acceptable limits.
-
Page 241: Performance Test Results
Performance Test Results Click on this tab to display the Performance test results: • Rx ULR (Rx Utilization Rate) • FTD (Frame Transfer Delay) • FDV (Frame Delay Variation) • Tx ULR • FLR (Frame Loss Rate) • Availability • Unavailability seconds Parameters that are verified against Service Acceptance Criteria (defined on SAC tab) are display with a yellow backlight. -
Page 242: Alarms Tab
ALARMS Tab Click on this tab to display detected Alarms. The alarms are displayed with a green or red background as described below; otherwise, they will be displayed with a gray background. The error count, amount of time in seconds that alarm remained raised during the test and total number of times the alarm event occurred are also displayed. -
Page 243: Ieee 1588
13.5 IEEE 1588 13.5.1 Introduction IEEE 1588 provides a standard protocol for synchronizing clocks connected via a multicast capable network such as Ethernet. It defines a protocol known as the precision time protocol (PTP). The PTP protocol specifies how real-time PTP clocks in the system synchronize with each other. - Page 244 NetProbe 2000 operates as IEEE1588v2 ordinary clock (single port device). It enables a user to verify connectivity and synchronization of PTP networks. A single NetProbe 2000 can emulate a master or slave node. Key features of NetProbe 2000 running IEEE 1588 are: •...
-
Page 245: Setup
13.5.2 Setup PROFILE Tab The Profile Tab allows the user to save and load user-defined test configurations. To save the current configuration data, tap the Save button and save or specify a new profile name. To load a specific profile which was saved previously, select its name from the drop down menu. -
Page 246: Ptp Tab
PTP Tab The PTP Tab allows a user to specify node configuration: • PTP Mode: The following modes are supported: o Master/Slave – device can act as either master or slave. It acts as master unless there is a better master available in the network, in which case the device become a slave. - Page 247 • Delay Mechanism: Specifies the delay measurement mechanism: o End-to-End – slaves determine the delay between them and the master over whole network path (end to end). o Peer-to-Peer – each device (master, slaves, switches) only determine the delay to their nearest neighbor.
-
Page 248: Master/Slave Tab
Master/Slave Tab The Master/Slave tab allows a user to specify the settings for PTP timing messages: • Announce Interval: Defines transmission interval of Announce message in master state. • Sync Interval: Defines transmission interval of Sync message in master state. •... -
Page 249: Peer Tab
Peer Tab Peer-to-peer delay measurement works locally, from every node to each of its neighbors. For each pair of directly connected ports, each end periodically measures the round-trip network delay between sending a Pdelay_Req message and receiving in response a Pdelay_Resp message. Before running IEEE1588 test with Peer-to-Peer mechanism you may configure time interval between Pdelay_Req messages. -
Page 250: Results
13.5.3 Results Status The Status screen displays the local node status and best master clock information. It includes following parameters: • PTP status: Informs about current node status. Node can have one of the following status: Initializing, Faulty, Disabled, Listening, Master, Passive, Uncalibrated, Slave, Unknown. •... -
Page 251: Messages Statistics
Messages statistics There are two types of message in the PTP protocol: event messages and general messages. Event messages are time-critical and an accurate timestamp is generated both at transmission and receipt of the message. Sync, Delay_Req, Pdelay_Req, Pdelay_Resp are event messages. General messages do not require timestamps but may contain timestamps their... -
Page 252: Errors
Errors NetProbe 2000 reports a list of the most common errors that may occur in the network. Information about errors narrows down the troubleshooting steps you need to take. The screen provides the following parameters: • Domain Mismatch: Compares the domain number in the header of received PTP message. If the domain number is different, it increases the number of domain mismatch and received PTP messages are ignored. -
Page 253: Message Capturing
Message capturing The IEEE1588 function can be used to capture and decode PTP messages. To capture a message, select the desired message type from the drop-down list and click Capture. The Busy icon indicates that device is waiting for the specified message. -
Page 254: Statistics
Statistics When NetProbe2000 emulates slave node it provides the following list of metrics: • Offset from master: The difference in time between slave and master. • M to S Delay: The master to slave path delay. • S to M Delay: The slave to master path delay. •... -
Page 255: Graphs
Graphs Each metric can be represented as plot over time or histogram. Plot displays the most recent metric data. Histograms provide comprehensive and accurate view of exact metric distribution, thereby reducing analysis time. Current histogram data can be cleared by pressing button. -
Page 256: Running A Test
13.5.4 Running a test This section will show how to run simple IEEE1588 master/slave emulation test. Connect two NetProbes using Cat 6 Ethernet cable via 10/100/1000 test port (see pictures below). Alternatively, you can use the SFP transceivers and a fiber patch cable. - Page 257 Start by setting the default configuration on both devices. We want the right side device to be a master, so increase Priority 1 (lower value means higher priority). Press the start button to run master/slave emulation. Both devices are now in the Listening state. Best Master Clock Algorithm compares clock quality of all devices capable to be a master.
- Page 258 There are only two devices in this PTP network. The device on the right side has higher priority 1 parameter so it becomes a Master. The device on the left side becomes a slave (it doesn’t have the best clock). It starts synchronizing to the master clock.
-
Page 259: Acquring An Ip Address
14. Acquring an IP ADDRESS 14.1 Enable eth0 Prior to running the IPTV, VoIP, IP Tools (Main screen) or Remote applications, the NetProbe must establish an IP address via the LAN 10/100 LAN port with the network. This port can be found at the top of the unit. The instruction steps to acquire an IP address depend on your application you wish to run. - Page 260 Steps to Acquire an IP Address WiFi and Remote Applications - start here 1. Tap on the Toolbar icon at the bottom of the display. 2. Tap on the Globe toolbar icon. IPTV, VoIP, IP Tools Applications - start here 3.
- Page 261 5. Configure to use a Static or Dynamic setting as described below. If using DHCP you will see a blue progress bar during DHCP processing which will turn green when the settings are successfully leased from the network DHCP server. Click OK twice. Static IP Address: Dynamic IP Address: The DHCP radio...
- Page 262 Success! Failed!
-
Page 263: Enable Eth0 Vlan
14.2 Enable eth0 VLAN Prior to running the IPTV, VoIP, IP Tools (Main screen) or Remote applications over VLAN, go through following steps: 1. Tap on the Toolbar icon at the bottom of the display. 2. Tap on the Globe toolbar icon. 3. -
Page 264: Enable Pppoe
14.3 Enable PPPoE Prior to running the VoIP application over PPP, the NetProbe have to establish PPPoE connection. To establish PPPoE session and acquire an IP address, go though the following steps: 1. Tap on the Toolbar icon at the bottom of the display. 2. - Page 265 Processing Success! Failed!
-
Page 266: Iptv Analyzer Option
15. IPTV ANALYZER OPTION 15.1 Overview The IPTV application has three modes of operation: 1. Monitor – allows you to passively monitor and test IPTV multicast streams. 2. Set Top Box (STB) EMULATION - allows you to emulate a STB with simultaneous IPTV multicast streams (up to 40 Mbit/s bandwidth, typically 5-6 SD streams or 1-2 HD streams). -
Page 267: Acquiring An Ip Address
15.2 Acquiring an IP Address Prior to using the IPTV option, the NetProbe has to establish an IP address via the LAN 10/100 port with the network. Reference Chapter – 14 Acquiring an IP Address. The example below uses DHCP. -
Page 268: Setup
15.3 SETUP Configuring IPTV setup is simple. 1. Config: Choose a setup configuration from the list of previously saved configs or leave the default. 2. Test Length: Select the duration for the test. Choices include 30 s, 1 min, 5 min, 10 min, 30 min, 1 h, 3 h, 6 h, 12 h, 1 day, 2 days, 3 days, User Def. - Page 269 Saving the SETUP The buttons labeled Delete Config and Save Config allow you to delete and save any configuration file currently shown in the Config window. If the config is not saved, it will retain the last config used. To save a config, press the Save Config button. You can save as Default or you can enter a new name for the current configuration.
-
Page 270: Monitor
The Monitor function allows you to passively monitor and analyze IPTV multi-cast channels that are received at the NetProbe 2000 10/100 LAN port. If your network segment transmits IPTV streams on every switch port, you can just connect to a mirrored switch port and monitor. Otherwise, you will need a hub, TAP device or Pass-Thru option to monitor data between the modem/router and STB. - Page 271 The Live tab displays when passive monitoring is started and displays a list of connected streams. This is known as the Live screen. Click on the “+” to expand the tree with information about PID numbers inside the stream such as: •...
-
Page 272: Detailed Results
15.4.1 Detailed Results To see detailed results, the user should click on a specific node of the stream tree on the LIVE screen and then click on the STATISTICS tab. For each PID and also for whole stream, detailed metrics and status information are presented on three tabs labeled Stream Info (Basic, Advanced), QoS, Transport (Packets,TR101290 P1, TR101290 P2). - Page 273 Advanced subtab provides additional details such as: • IP source & destination address • Udp source & destination address • Encapsulation • IGMP Join time • • DSCP •...
- Page 274 QoS Tab Provides Quality of Service parameters such as: • Delay Factor • Media total Loss Rate • Jitter • Max Jitter • Interarrival Time • Transport Quality Index Transport Tab Provides information about the STREAM packet statistics including: Packets subtab •...
- Page 275 TR101290 P1 subtab provides information about the TR101290 Priority 1 stream metrics including: TS Sync Loss, Sync Byte Error, PAT Error, PAT 2 Error, Continuity, Error, PMT Error, PMT 2 Error, PID Error TR101290 P2 subtab provides information about the TR101290 Priority 2 stream metrics including: Transport Error, CRC Error, PCR Error, PCR Repetition Error, PCR Discontinuity Error, PCR Accuracy Error, PTS Error, CAT Error.
- Page 276 Graphs Tab Provides two histograms that display metric values in real time. You can use it to observer correlation between any two metrics.
-
Page 277: Stb Emulation
15.5 STB Emulation In the STB EMULATION mode, the NetProbe connects as the end-device to emulate a Set-Top Box (sending an IGMP join). The application supports UDP/ MPEG-2 TS & UDP/RTP/MPEG-2 TS network protocols stacks. -
Page 278: Build Or Import Channel List
15.5.1 Build or Import Channel List Prior to starting STB emulation, your NetProbe needs a Channel List. This list includes the channel numbers and IP addresses that will be used for testing. The list can be entered manually or imported via the NetProbe’s USB port. Press the Channels tab to display the channel list management menu. - Page 279 To add channels: 1. Click on the Add icon. 2. Enter the Channel Name, Multicast Address and press Add. To edit channels: 1. Select a channel on the Channels List to edit by clicking on it. 2. Click on the Edit icon. 3.
- Page 280 To add passive channels to list: 1. Click on scan icon. 2. Wait until available channels display. 3. Select channels to test by clicking appropriate checkboxes and press Add button to add channels to list.
- Page 281 To import channels: 1. Insert USB disk into the mini-USB adaptor. 2. Click on the Import List button. 3. Choose the list to import. 4. The file should be of the format: 1;225.1.1.1;TVP1 Request Connections Once you load the Channel List, the status for each channel will display as Disconnected. Click on the Connect/Disconnect button to toggle it between Connected and Disconnected state.
-
Page 282: Running Stb Emulation
15.5.2 Running STB Emulation 1. Prior to running STB emulation, your Channel List must be loaded and you must choose which channels you wish to Connect. See previous section Build or Import Channel List. 2. Press on the button to start the emulation test. 3. - Page 283 The example screen above displays a list of connected streams. Click on the “+” to expand the tree with information about PID numbers inside the stream such as: • PID type(table like PAT/PMT/… and audio/video data) • PID number • bandwidth for each PID respectively.
-
Page 284: Detailed Results
15.5.3 Detailed Results To see detailed results, the user should click on a specific node of the stream tree on the LIVE screen and then click on the STATISTICS tab. For each PID and also for whole stream, detailed metrics and status information are presented on three tabs labeled Stream Info (Basic,Advanced), QoS, Transport (Packets,TR101290 P1, TR101290 P2), Graphs. - Page 285 Advanced subtab provides additional details such as: • IP source & destination address • UDP source & destination address • Encapsulation • IGMP Join time • • DSCP •...
- Page 286 QoS Tab Provides Quality of Service parameters such as: • Delay Factor • Media total Loss Rate • Jitter • Max Jitter • Interarrival Time • Transport Quality Index Transport Tab Provides information about the STREAM packet statistics including: Packets subtab •...
- Page 287 TR101290 P1 subtab provides information about the TR101290 Priority 1 stream metrics including: TS Sync Loss, Sync Byte Error, PAT Error, PAT 2 Error, Continuity, Error, PMT Error, PMT 2 Error, PID Error TR101290 P2 subtab provides information about the TR101290 Priority 2 stream metrics including: Transport Error, CRC Error, PCR Error, PCR Repetition Error, PCR Discontinuity Error, PCR Accuracy Error, PTS Error, CAT Error.
- Page 288 Graphs Tab Provides two histograms that display metric values in real time. You can use it to observer correlation between any two metrics.
-
Page 289: Channels Scan
15.6 CHANNELS SCAN Channels SCAN function allows you to connect as the end-device, to emulate Set-Top Box, and check availability of channels (streams) in an IPTV network from a loaded Channel List. Prior to running Channels Scan, a valid Channel List must be loaded. See previous section Build or Import Channel List. - Page 290 15.7 VoD Video-on-Demand (VoD )is based on Unicast technology. In order to communicate with the VoD network infrastructure, subscribers need to support real-time streaming protocol (RTSP). RTSP is the most common network protocol used to transport video over IP networks. It is a stateful protocol to establish and control media sessions between a media server and client viewer.
-
Page 291: Build Or Import Channel List
15.7.1 Build or Import Channel List Prior to starting VoD test, your NetProbe needs a Channel List. This list includes the channel names and rtsp URL addresses that will be used for testing. The list can be entered manually or imported via the NetProbe’s USB port. See 15.5.1 section to get information about handling Channel List. -
Page 292: Running Vod Test
15.7.2 Running VoD test 1. Prior to running VoD test, your Channel List must be loaded and you must choose which channels you wish to Connect. See previous section Build or Import Channel List. 2. Press on the button to start the emulation test. 3. - Page 293 The example screen above displays a list of connected streams. Click on the “+” to expand the tree with information about elementary streams inside the VoD stream. Following parameters are provided: • Elementary stream type (audio/video) • Bandwidth for each elementary stream and whole stream respectively. •...
-
Page 294: Detailed Results
15.7.3 Detailed Results To see detailed results, the user should click on a specific node of the stream tree on the LIVE screen and then click on the STATISTICS tab. For each elementary stream and also for whole stream detailed metrics and status information are presented on two tabs labeled Stream Info (Basic, Advanced), and Transport . - Page 295 Advanced subtab provides additional details such as: • IP source & destination address • RTSP source & destination port • RTCP source & destination port • RTP source & destination port • Encapsulation Transport Tab Provides information about the STREAM packet statistics including: •...
-
Page 296: Voip Phone Analyzer Option
16. VoIP PHONE ANALYZER OPTION 16.1 Overview The VoIP Phone analyzer option provides the following functions: 1. Call placement 2. Call answering 3. Call Log 4. Call Details 5. SIP Flow The IP Phone requires terminating the NetProbe LAN 10/100 port on the STB or Gateway port. Before running the VoIP Phone application, your NetProbe will need to acquire an IP address. -
Page 297: Acquiring An Ip Address
16.2 Acquiring an IP Address Prior to using the VoIP application, the NetProbe has to establish an IP address via the LAN 10/100 port with the network. Reference Chapter – 14 Acquiring an IP Address. The example below uses DHCP. -
Page 298: User Interface
16.3 User Interface Contacts Tab Use this tab to store and recall a SIP address. A sip address is in the form: sip:user@domain. You can also add a display name that is used only for your information. To recall a SIP address, select it by clicking on contact list. The address you have selected will display in the SIP-URL/Number entry area. - Page 299 To manage the contact list, use the following buttons: - add new account - edit selected account - remove selected account...
- Page 300 Keypad Tab Use this tab to enter the number you wish to call. By using the keypad the corresponding character will be inserted into the SIP-URL/Number entry area. The following keys can be used to edit the number: - move cursor to the left - move cursor to the right - delete character During a call, the keypad can be used for DTMF ("Dual-Tone Multi-Frequency") input.
- Page 301 Call Log Tab Use this tab to view the number of calls you've dialed, received or missed. A list of recent call is displayed. Type of calls are identified by the following icons: - incoming calls - outgoing calls To call back a sip number stored in the call log, select it by tapping a record on the Call log list.
- Page 302 To see the call detail of a particular call, click on the call of interest and click button. The call detail page is displayed. And includes such call information as: o Date and time o Status: Success, Aborted, Missed, Declined o Direction: Outgoing, Incoming o From (caller) o To (call recipient)
- Page 303 To create the SIP flow, NetProbe 2000 decode VoIP packets and then converts the hexadecimal bytes into useful pneumonics that make it easy for a user to follow the setup and teardown processes of a VoIP call. SIP flow is not available for encrypted calls (TLS).
-
Page 304: Preferences
16.3.1 Preferences To configure preferences, click on the button that is localized on Contacts, Keypad and Call log tab. The preference window is not accessible during a phone call. Preferences are divided into four groups: Network, Multimedia, Accounts, Codecs. Network Tab Send DTMFs as SIP Info - determines which technique should be used for carrying the DTMF information. - Page 305 Direct connection to the internet – use this option for making calls in local network or using proxy to route your calls. If you find yourself in a private network behind a NAT/firewall and if you do not use SIP provider to route your calls, you may need to use one of the following NAT traversal options.
- Page 306 Multimedia Tab Ring sound – you can choose what sound is used as ring tone. Click Play button to preview chosen sound. Volume – adjust the audio volume. Enable echo cancellation – check this option to use echo cancelation. Echo cancellation provides that the person on the other end will not hear an echo.
- Page 307 Accounts Tab Default identity – it is used when you don’t want to use a SIP proxy account. By using this identity you can make calls in the same network. o Display name – your name that others can see o Username –...
- Page 308 Codecs tab IP Phone supports several codecs for the transmission of voice data. You can choose your preferred codecs form the list. Use buttons on the bottom of the codec list to put them in an order of preference. You can decide to use or not use a codec buy changing its status with the enable/disable buttons.
-
Page 309: Registering At Remote Sip Server
16.3.2 Registering at remote SIP server To use the IP Phone, it doesn’t need to be registered to a proxy. You can make call to another device in your local network by entering its hostname or IP address (ex. sip:toto@192.168.1.23). This also works on the public internet provided that both ends have public IP addresses or appropriate firewall rules. - Page 310 The registration process flow is presented in the snap shots below:...
-
Page 311: Making A Call
16.3.3 Making a call To start a VoIP, just follow the steps below: o Enter the SIP address into the SIP-URL/Number prompt (tap on entry area to display the keyboard or click on to select an address from the dropdown list of recently used addresses). Alternatively, view your saved contacts on the Contacts Tab and navigate to a chosen item. - Page 312 The call making process flow is presented in the snap shots below:...
-
Page 313: Answering A Call
16.3.4 Answering a call When you receive a call, the application will switch to the Call Tab and the caller’s number or name is displayed. You also hear a ring sound on your headset. Once you have noticed an incoming call, do one of the following: o Press button to pick up the phone and start talking. -
Page 314: Wifi Analyzer Option
17. WiFi ANALYZER OPTION The WiFi analyzer option provides comprehensive test and verification of WiFi Networks with the following functions: • search for WiFi 802.11b/g/n networks • search for access points within selected WiFi network • display the type of the network and signal strength •... -
Page 315: Acquiring An Ip Address
17.1 Acquiring an IP Address Prior to using the WiFi application, the NetProbe has to establish an IP address via the integrated WiFi radio with the WiFi network. Reference Chapter – 14 Acquiring an IP Address. The example below uses DHCP. -
Page 316: Networks
17.2 Networks The WiFi Networks function provides a comprehensive tool to discover the presence of WiFi networks. When you press the Networks button, the NetProbe begins immediately sniffing for 802.11 b/g/n WiFi- networks. Discovered networks are listed along with the following information: •... - Page 317 Testing a Network To test a network, follow the steps below 1. Click on the network name to highlight it. If the selected network has one access point, press the Connect button. If the selected Network has multiple access points, press the Details button to see the list and the press the Connect button for the desired access point.
-
Page 318: Wifi - Ip Tools
17.3 WiFi - IP TOOLS The WiFi option includes a set of diagnostic tools. With these tools you'll get an outside view of your network response time and network topology, which allows you to track down network issues more easily. The IP Tools include the following functions: Ping Trace Route... -
Page 319: Wifi - Ping
17.3.1 WiFi – PING Ping is a diagnostic function used to test the reachability of a host device on an IP network and to measure the round- trip time (latency) for messages sent from the NetProbe to the host device. SETUP Tab Use this tab to setup the following Ping parameters: •... - Page 320 RESULTS Tab Use this tab to observe the PING results. The table display a list of IP addresses along with their corresponding round-trip time (latency) and Time to Live (TTL) Addional summary metrics include: • Number of packets Sent • Number of Packets Received •...
-
Page 321: Wifi - Trace Route
17.3.2 WiFi - Trace Route Trace Route is a diagnostic tool for displaying the routed path and measuring transit delays of packets across an IP network. The history of the route is recorded as the round-trip times (latency) of the packets from the NetProbe to each successive host (remote node) along the routed path. -
Page 322: Wifi - Discover
17.3.3 WiFi - Discover Discover scans and detects all network devices within a range of IP addresses. The range specified must be entered in CIDR notation. CIDR notation is constructed from: • IP address • Prefix – number of leading ‘1’ in the routing prefix mask To run DISCOVER, follow the steps below: 1. -
Page 323: Wifi - Ftp
17.3.4 WiFi - FTP FTP is used to check the status of an FTP server by measuring the time from to download a host file to the NetProbe or upload file to a server. To run FTP download test, follow the steps below: 1. - Page 324 To run FTP upload test, follow the steps below: 1. Check Upload radio button. 2. Select an FTP remote server directory where test file will be uploaded. 3. Enter User and Password in the entry blocks. If your FTP does not require authentication leave it empty.
-
Page 325: Wifi - Http
17.3.5 WiFi - HTTP HTTP is used to test and benchmark the performance of web applications, web servers. The HTTP test allow the NetProbe to measure the time required to download a web page. To run HTTP, follow the steps below: 1. -
Page 326: Ip Tools
18. IP TOOLS The IP TOOLS application is available as a standard feature on the NetProbe 2000. With these tools you'll get an outside view of your network response time and network topology, which allows you to track down network issues more easily. -
Page 327: Acquiring An Ip Address
18.1 Acquiring an IP Address Prior to using the IP Tools application, the NetProbe has to establish an IP address via the network. Reference Chapter – 14 Acquiring an IP Address. The example below uses DHCP. -
Page 328: Ping
18.2 PING Ping is a diagnostic function used to test the reachability of a host device on an IP network and to measure the round- trip time (latency) for messages sent from the NetProbe to the host device. SETUP Tab Use this tab to setup the following Ping parameters: •... - Page 329 RESULTS Tab Use this tab to observe the PING results. The table display a list of IP addresses along with their corresponding round-trip time (latency) and Time to Live (TTL) Addional summary metrics include: • Number of packets Sent • Number of Packets Received •...
-
Page 330: Trace Route
18.3 Trace Route Trace Route is a diagnostic tool for displaying the routed path and measuring transit delays of packets across an IP network. The history of the route is recorded as the round-trip times (latency) of the packets from the NetProbe to each successive host (remote node) along the routed path. -
Page 331: Discover
18.4 Discover Discover scans and detects all network devices within a range of IP addresses. The range specified must be entered in CIDR notation. CIDR notation is constructed from: • IP address • Prefix – number of leading ‘1’ in the routing prefix mask To run DISCOVER, follow the steps below: 1. -
Page 332: Ftp
18.5 FTP FTP is used to check the status of an FTP server by measuring the time from to download a host file to the NetProbe or upload file to a server. FTP Download Test To run a FTP download test, follow the steps below: 1. - Page 333 FTP Upload Test To run a FTP upload test, follow the steps below: 1. Check Upload radio button. 2. Select an FTP remote server directory where test file will be uploaded. 3. Enter User and Password in the entry blocks. If your FTP does not require authentication leave it empty.
-
Page 334: Http
18.6 HTTP HTTP is used to test and benchmark the performance of web applications, web servers. The HTTP test allow the NetProbe to measure the time required to download a web page. To run HTTP, follow the steps below: 1. Select a url or IP address for the test from the drop down or click in the Address entry block and enter an FTP address. -
Page 335: Remote Control
19. Remote Control The NetProbe 2000 has an integrated VNC server and can be controlled from a VNC Client application. Remote Control uses the Ethernet 10/100Base-T LAN or WiFi interface. Use this function to operate your NetProbe over any internet connection. - Page 336 Follow the steps below to establish a VNC Client: 1. Install free, open source VNC from this location: http://www.realvnc.com/download/viewer/ 2. Run the VNC client. The Client logon window is shown below. 3. Enter the Server name or IP address and enter OK. 4.
-
Page 337: Software Update Procedure
20. Software Update procedure Updating NetProbe 2000 software is easy and can be completed in about 5 minutes. To update NetProbe 2000 Software, follow the steps below: 1. Download the software update file (about 120 Mbytes) from provided link and copy it to a USB pen drive. - Page 338 6. The NetProbe displays the folders found on the USB drive. Navigate the directory tree to find the software update file and click on it to highlight it. 7. Press the button. The progress indicator displays the update status process. The entire process should complete in less than a minute.
- Page 339 8. Press the OK button to the warning message that the NetProbe will reboot. Wait until the main menu displays before you unplug the USB adaptor and USB pen drive. 9. The update is complete. If however, your NetProbe was not successfully updated, please contact Net Research Corporation via email at info@netrsr.com or via telephone at 1-703-270-0004.
-
Page 340: Technical Specifications
21. Technical Specifications ALARM/STATUS LED's with history: Signal/Loss of Signal: green/red/off Frame Sync/Loss of Frame: green/red/off 21.1 G.703 E1 Analyzer Option Alarm: red, combines the following alarms: LOS - loss of signal OOF - out of frame E1 RECEIVER: AIS - E1 AIS alarm detected Impedance: 120 or 75 Ohm RAI - remote Alarm detected Connectors: BNC and RJ-45... -
Page 341: Ds1(T1) Analyzer Option
1:15,1:31, Multipattern, Bridgetap, Inverted 21.2 DS1(T1) Analyzer Option: Error Measurements: Logic Errors, Rate, ERS, BPVErrors, Rate, ERS T1 RECEIVER: Frame Errors,Rate, ERS Impedance: 100 or 75 Ohm CRCErrors, Rate, ERS Connectors: BANTAM and RJ-45 E-bit Errors,Rate, ERS Input Frequency: 1,5444,000 Hz +/-300 ppm G.821: EFS, ERS, SES, AVS, UAVS Sensitivity: TERM +3 to -34 dbDSX, Error Injection: types -Logic, BPV(Code),Frame,CRC... -
Page 342: Co-Dir Analyzer Option
Yellow - remote alarm detected RAI - remote Alarm detected Error: red, on whenever any error is present LOOPBACKS: Psync: green, pattern sync/pattern loss – green/off when sync is lost Remote Looback, enables also through mode for line code and errors (No pattern sync) transparency T1 AUTO MONITOR:... -
Page 343: Wifi Analyzer Option
DATA RATE: 21.6 IEEE C37.94 Analyzer Option: nx56/64kb/s, n=1 to 24 (32), variable frequency synthesizer 300 hz – 8 Mhz Based on IEEE C37.94 –2002. RS-232 - 300b/s to 115kb/s Connector: ST V.35,V.36,RS-530-300b/s to 8 Mb/s Test Rate: nx64kb/s, n =1 to 12 BERT test: Test Pattern: PRBS, fixed Patterns: 2... -
Page 344: T3(Ds3) Analyzer Option
Signal level to declare Loss of Signal: -35 dB Summary Errored Seconds Signal Level to clear loss of signal: -15 dB Summary Error Free Seconds G.821 errors and %: EFS, ERS, SES, AVS, UAVS E3 TRANSMITTER: Error Injection: Impedance: 75 Ohms Logic: Rate Continuous, Single Output Pulse: Nominal 0.8 Vpk (+/- 5%) conforms to ITU G.703 Bipolar Violations: Rate Continuous, Single... - Page 345 HIGH: Nominal 1.2 Vpk conforms to ITU G.703&ANSI T.102 Bipolar Violations Rate Continuous, Single DSX: Nominal 0.6 Vpk con forms to ITU G.703&ANSI T.102 Frame Rate Continuous, Single External Clock Input: 75 Ohms, BNC connector P- Parity Rate Continuous, Single Frequency Range: C- bit Rate Continuous, Single Input: 44.736 +/-500 ppm...
-
Page 346: Gigabit Basic Analzer Option
Receiver – Wavelength: 1270 nm to 1570 nm – Signal: -24 dBm to -3 dBm max 21.10 Gigabit Basic Analzer Option: Wiremap: Open, short, crosstalk, length, impedance Electrical Gigabit Interface: 10/100/1000Base-T, RJ-45 Loopback: Manual, Layer 1,2,3 Optical Gigabit Interface: SFP Duplex LC, field removable BERT: Optical Power Measurement - Tx and Rx Single-ended test with loopback on the remote end... -
Page 347: Gigabit Adv Analyzer Option
Frame Loss Traffic Generation: Burst ( back to back) Layer 1, Layer 2, Layer 3, Layer 4 traffic Single tester mode Configurable source and destination MAC address Measurements: Configurable 802.1q VLAN tag and 802.1p priority Throughput: Frame size, Throughput %, Status Stacked VLAN: none, 1, 2 (Q-in-Q) Latency: Frame size, Rate %, Latency us, Jitter us, Status Configurable MPLS tags (up to 2 tags) -
Page 348: Iptv Analyzer Option
Transport Metrics: TR101290 Priority 1 21.12 IPTV Analyzer Option: TSYNC Loss Sync Byte Error Count PAT Error Count Interface: 10/100-Base T PAT2 Error Count Encapsulation supported: MPEG2-TS/UDP, MPEG2-TS/RTP/UDP Continuity Error Count PMT Error Count Modes of Connection: Termination and monitor PNT2 Error Count PID Error Count Max # of streams tested: up to 40 mbps total bandwidth (average 3... -
Page 349: General
Battery weight: 250g Environmental: 21.13 GENERAL: Operating Temperature: 0 C to 50 Operating Humidity: 5% to 90% non condensing Test Results: Storage: -10 C to 70 Storage: Internal microSD 4 GB card, External: USB flash Format: SQL Dbase, Date and time started, time stopped Levels: Summary Log of all test, Details per test, Histogram from selected record Output: Display, Export to USB Flash, Print to serial printer. - Page 350 Your Rep: US Office: EU Office: Sierra Technologies Net Research Corporation Net Research sp. z o.o. 1901 Association Drive Ul.Zakatek 6B/15 864-458-9035 Suite 202 30-076 Krakow, Poland Reston, Virginia 20191, USA Tel: +48 794-909-962 Sales@ Tel: +001 703-270-0004 info@netrsr.com SierraTechnologies.com...
Need help?
Do you have a question about the NetProbe 2000 and is the answer not in the manual?
Questions and answers