Furuno FMD-3200 Operator's Manual
Electronic chart display and information system
Hide thumbs
Also See for FMD-3200:
- Operator's manual (508 pages) ,
- Installation manual (142 pages) ,
- Instruction manual (133 pages)

Related Manuals for Furuno FMD-3200


Summary of Contents for Furuno FMD-3200
- Page 1 OPERATOR'S MANUAL ELECTRONIC CHART DISPLAY AND INFORMATION SYSTEM (ECDIS) FMD-3200 FMD-3200-BB FMD-3300 Model www.furuno.com...
- Page 2 ・FURUNO Authorized Distributor/Dealer 9-52 Ashihara-cho, Nishinomiya, 662-8580, JAPAN A : APR 2012 Printed in Japan All rights reserved. F : JAN . 19, 2016 Pub. No. OME-44730-F (DAMI ) FMD-3200/3200BB/3300 0 0 0 1 7 6 1 2 5 1 5...
-
Page 3: Important Notices
How to discard a used battery Some FURUNO products have a battery(ies). To see if your product has a battery, see the chapter on Maintenance. Follow the instructions below if a battery is used. Tape the + and - terminals of battery before disposal to prevent fire, heat generation caused by short circuit. - Page 4 Do not place liquid filled containers Unit. Do not remove any label. If a label is on the top of the equipment. missing or damaged, contact a FURUNO agent or dealer about replacement. Fire or electrical shock can result if a Name: Warning Label (1) liquid spills into the equipment.
-
Page 5: Table Of Contents
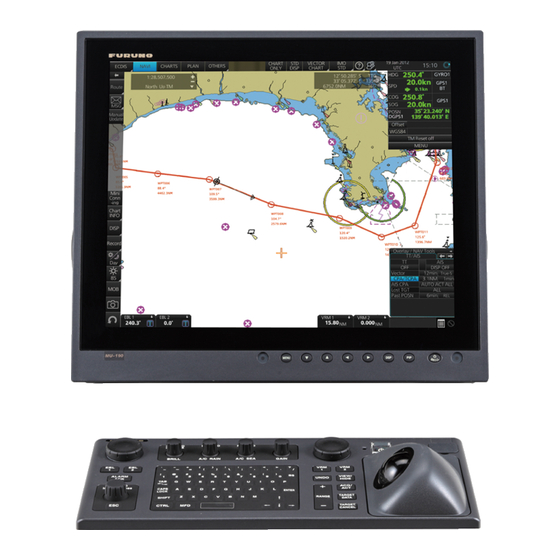
1.5 ECDIS Control Unit RCU-024..................1-3 1.5.1 Control description ..................1-3 1.6 Trackball Control Unit RCU-026 .................1-5 1.7 How to Select a Color Palette..................1-6 1.8 How to Adjust the Display Brilliance (FURUNO or Hatteland monitor), Control Unit Backlighting ........................1-7 1.8.1 Manual brilliance adjustment................1-7 1.8.2 Control unit backlighting .................1-8... - Page 6 TABLE OF CONTENTS 2.4 How to Select the Chart Scale ................. 2-17 2.5 How to Select the Presentation Mode..............2-18 2.6 Cursor Position Box ....................2-18 2.7 True Motion Reset....................2-19 2.8 How to Control Route and User Charts in Voyage Navigation and Voyage Planning Modes ..................
- Page 7 TABLE OF CONTENTS 3.19 How to Show Publishers Notes for ENC Charts............3-25 3.20 How to Find the Chart Type..................3-26 3.21 How to Update ENC, C-MAP Charts Manually............3-26 3.21.1 How to insert update symbols ..............3-27 3.21.2 How to delete update symbols ..............3-28 3.21.3 How to modify existing update symbols ............3-28 3.22 How to Synchronize Chart Data ................3-29 3.22.1 How to select the units to synchronize ............3-29...
- Page 8 TABLE OF CONTENTS 6.4 ARCS Subscriptions....................6-6 6.4.1 ARCS Navigator..................... 6-6 6.4.2 ARCS license information ................6-6 C-MAP CHARTS ....................7-1 7.1 C-MAP Cartographic Service ..................7-1 7.2 How to Register the System at C-MAP Norway............7-1 7.3 How to Order Charts ....................7-1 7.4 How to Apply for Licenses..................
- Page 9 TABLE OF CONTENTS 9.9.1 How to import FMD-3xx0, FAR-3xx0, FCR-2xx9 route data ......9-19 9.9.2 How to import FEA-2x07 route data ............9-19 9.9.3 How to import csv, ASCII format route data ..........9-20 9.10 How to Export Route Data..................9-20 9.10.1 How to export FMD-3xx0 route data ............9-20 9.10.2 How to export route data in FEA-2x07, csv, ASCII format ......9-21 9.11 How to Delete Routes....................9-21 9.12 Reports ........................9-22...
- Page 10 TABLE OF CONTENTS 12.5 Predictor........................12-6 12.6 Anchor Watch......................12-7 12.7 UKC (Under Keel Clearance)................... 12-8 12.7.1 UKC overview ....................12-8 12.7.2 How to set UKC.................... 12-8 12.7.3 UKC window....................12-9 12.8 Divider ........................12-10 12.8.1 How to use the divider................12-10 12.8.2 Usage characteristics, limitations...............
- Page 11 TABLE OF CONTENTS 15.1.2 How to manage received and sent AIS safety messages ......15-3 15.2 Navtex Messages .....................15-4 15.2.1 How to receive Navtex messages ..............15-4 15.2.2 How to manage received Navtex messages ..........15-4 16. RADAR OVERLAY ....................16-1 16.1 Introduction.......................16-1 16.2 How to Setup the Radar Overlay................16-2 16.3 How to Adjust the Radar Signal Fed From the Radar Connection Box....16-3 16.4 Error Between Radar Echo Image and Chart............16-7 16.5 Error Sources for Radar Echo Image and TT Mismatch ..........16-8...
- Page 12 TABLE OF CONTENTS 20.2 Alert Box........................20-2 20.3 How to Temporarily Silence the Buzzer for an Alarm or Warning......20-5 20.4 How to Acknowledge an Alarm or Warning.............. 20-5 20.5 Alert List ........................20-6 20.6 Alert Log........................20-8 20.7 Alert Reception from Connected Sensors..............20-8 20.8 List of Alerts ......................
- Page 13 TABLE OF CONTENTS 25.11Alert Priority, Alert State ..................25-7 25.12Alert Icons ........................25-8 25.13AMS Mode Operations ....................25-9 25.13.1How to select the AMS mode ...............25-9 25.13.2AMS mode windows ...................25-10 26. AUTOPILOT OPERATIONS ................26-1 26.1 Configuration ......................26-1 26.2 Controls ........................26-2 26.2.1 EMRI FAP-2000 ...................26-2 26.2.2 EMRI FAP-3000 ...................26-4 26.2.3 TOKYO KEIKI PR-6000 ................26-5 26.2.4 TOKYO KEIKI PR-9000 ................26-9...
-
Page 14: Foreword
• Continuous monitoring of ship’s position through multi-sensor Kalman filter processing using GPS, DGPS, SDME. • Route planning and route monitoring facilities. • Radar image can be overlaid on electronic charts. (Requires a FURUNO FAR-2xx7, FAR-3xx0 or FCR-2xx9 radar.) • Grounding warnings, safe depth contours. - Page 15 GPL or LGPL as published by the Free Software Foundation. Please access to the following URL if you need source codes: https://www.furuno.co.jp/cgi/cnt_oss_e01.cgi. This product uses the software module that was developed by the Independent JPEG Group.
-
Page 16: System Configuration
- Digital In (ack in) AC-DC Power Supply Unit PR-240 100-115/220-230 VAC, 1ø, 50/60 Hz 24 VDC 100-115/200-230 VAC 1ø, 50/60 Hz The following monitors are available for use with the FMD-3200 BB. Maker Model Viewing distance (m) FURUNO MU-190 1.0138 MU-231 1.0138 MU-201CE 1.0759... - Page 17 MC-3030D optional or local supply equipment. Serial Analog Digital IN Digital OUT interface interface interface interface The following monitors are available for use with the FMD-3200 BB. Maker Model Viewing distance (m) FURUNO MU-190 1.0138 MU-231 1.0138 MU-201CE 1.0759 MU-231CE 1.0138...
- Page 18 SYSTEM CONFIGURATION This page is intentionally left blank.
-
Page 19: Introduction
INTRODUCTION System Configuration This ECDIS series is comprised of the components shown in the illustration on the System Configuration page. The Processor Unit is connected to various sensors, and performs navigation calcu- lations, route planning and route monitoring. The Sensor Adapters interface between the Processor Unit and external equipment. -
Page 20: How To Turn The Power On/Off
1. INTRODUCTION How to Turn the Power On/Off Normally, leave the power switches at the front of the Processor Unit on and control the power with the power key on a Control Unit (RCU-024, RCU-026). The Monitor Unit is powered independently. How to power the system Push the Mains switch on the Processor Unit for the "I"... -
Page 21: Ecdis Control Unit Rcu-024
Control description Description POWER key Turns the system on or off. (With a FURUNO or Hatteland mon- itor unit, the monitor is also turned on or off with this key.) Status LED The color and state of the LED change according to system or alert status. - Page 22 Push: Confirms selection. ESC key: Goes back one step in the current operating se- quence on the InstantAccess bar. BRILL Rotate: Adjusts the brilliance of a FURUNO or Hatteland moni- tor. Push: Selects a color palette. A/C RAIN No use.
-
Page 23: Trackball Control Unit Rcu-026
Control Description Power key Turns the system on or off. (With a FURUNO or Hatteland monitor unit, the monitor is also turned on/off with this key.) Status The color and state of the LED change according to system or alert sta- tus. -
Page 24: How To Select A Color Palette
1. INTRODUCTION How to Select a Color Palette The system provides three sets of color and brilliance sets (palette), day, dusk and night, to match any ambient lighting condition. The default specifications of each set are as shown in the table below. The panel dimmer setting is automatically changed, and the number of steps depends on the color palette selected. -
Page 25: How To Adjust The Display Brilliance (Furuno Or Hatteland Monitor), Control Unit Backlighting
The backlighting for the control unit can be adjusted from the monitor brilliance adjust- ment window. Note 1: The brilliance of only the FURUNO or Hatteland monitor can be adjusted from the Control Unit. Use a serial cable for brilliance adjustment to make the connection between the Processor Unit and the Control Unit. -
Page 26: Control Unit Backlighting
1. INTRODUCTION Manual brilliance adjustment with the trackball module 1. Click the [BRILL] button on the InstantAccess bar to show the brilliance adjust- ment window. 2. For coarse adjustment, put the cursor on a location within the slider bar area then push the left button. -
Page 27: How To Select Sensor Settings
1. INTRODUCTION How to Select Sensor Settings This ECDIS system accepts navigation data input two ways: System or Local. System shares sensor data among multiple ECDIS in network. Sensor priority is also com- monly shared among the ECDIS. Local selects a sensor outside the network. 1. -
Page 28: How To Enter Ship Speed
The speed can be entered from a log (STW) or GPS (SOG), or manually on the menu. Note that FURUNO GPS Navigator GP-150 provides both COG and SOG. Speed data is checked for integrity (see section 18.7 for details), and the data is judged as [Doubtful], [Excluded], [Failed], [Not Available], or [Passed]. - Page 29 1. INTRODUCTION Check for automatic speed input Speed sensor list Stablilization PRIM: FILT/BT mode SPD: Integrity Integrity: Passed LOG/GPS check selection result Check for manual speed input SPD page, system sensor 5. For automatic input, follow the procedure below. For manual input, go to step 1) Check [Sensors].
-
Page 30: How To Enter Heading
1. INTRODUCTION 1.11 How to Enter Heading Heading can be entered manually or automatically. Heading data is checked for integ- rity (see section 18.7 for details), and the data is judged as [Doubtful], [Excluded], [Failed], [Not Available], or [Passed]. The integrity check results appear on the [HDG] page, shown below. - Page 31 1. INTRODUCTION PRIM: GYRO1 GYRO1 GYRO1 Doubtful GYO001 GYO002 System sensor settings 5. For automatic input follow the procedure below. For manual input go to step 6. 1) Check [Sensors]. 2) For local system settings, set the priority for each sensor connected, referring to section 1.10.
-
Page 32: How To Mark Mob Position
1. INTRODUCTION 1.12 How to Mark MOB Position Use the MOB (man overboard) feature to mark the position of man overboard on the display screen. Access the [MOB] but- ton (in any mode) on the InstantAccess bar. The MOB mark (orange) instantly appears at the system po- sition when the button is operated. -
Page 33: How To Select Time Format, Set Local Time
1. INTRODUCTION 1.13 How to Select Time Format, Set Local Time A GPS navigator feeds time and date data (ZDA sentence) to the ECDIS and they ap- pear on the Status bar. Neither the time nor the date can be adjusted, however you can select between UTC time (default) and local time. -
Page 34: The Settings Menu
1. INTRODUCTION 1.15 The Settings Menu The [Settings] button gives you access to the user profiles and the [Settings] menu. The [Settings] menu has facilities for screenshot management, file management, di- agnostic tests and customizing. See chapter 23. [Settings] button 1.16 How to Manage User Profiles Ten sets of [Chart Display], [Symbol Display] and [Chart Alert] menu settings can be... -
Page 35: How To View System Information, Operator's Manual
1. INTRODUCTION 1.17 How to View System Information, Operator's Manual You can show the system information and the operator's manual. Click the [?] button on the Status bar, then click the [Manual] or [About] button. [Manual] shows the Operator’s Manual. [About] shows the system information, prepared in four tabs. -
Page 36: Split Screen
1. INTRODUCTION 1.18 Split Screen You can split the screen in two, horizontally or vertically, in the Voyage navigation mode. 1.18.1 How to activate, deactivate the split screen To activate the split screen or return to the full screen, click the [DISP] and [TWO DISP] buttons on the InstantAccess bar to show the choices for screen division. -
Page 37: Function Availability
1. INTRODUCTION 1.18.2 Function availability Viewable Operable Item Main Main AIS target Anchor watch Chart display Danger highlight Divider EBL, VRM Parallel index lines Radar overlay Range rings Weather overlay 1.18.3 Split screen usage characteristics • If the sub view is not displayed correctly, restore the full screen display then try to ac- tivate the split screen again. -
Page 38: Tips
1. INTRODUCTION 1.19 Tips This ECDIS provides operational tips for the display area and the InstantAccess bar. To get a tip, simply put the cursor on an object. The tip appears to the right of the ob- ject. For example, put the cursor on the [BRILL] button on the InstantAccess bar. The tip "Adjust brilliance"... -
Page 39: Operational Overview
ECDIS Display The ECDIS (Electronic Chart Display and Information Systems) screen is divided into several areas, as illustrated below. (The illustration shows the layout for the FURUNO monitor. The layout may be slightly different with the Hatteland monitor.) Status bar... -
Page 40: Electronic Chart Area
2. OPERATIONAL OVERVIEW 2.1.1 Electronic chart area The ECDIS can use the following types of charts: • S-57 (IHO) • S-63 (IHO) (S-63 encrypted) • ARCS (UKHO) • CM-ENC (C-MAP by Jeppesen) • CM-93/3 (C-MAP by Jeppesen) The following information can also be displayed: •... - Page 41 To emphasize this point these charts are called "Non-ENC" charts in this manual. Note that some eToken dongles from the FEA-2xx7 can be used. These are labeled “JeT FURUNO XXXXX”. This ECDIS accepts the following C-MAP chart types: CM-ENC, Professional, Profes- sional+ and Jeppesen Primary ECDIS Service.
-
Page 42: Status Bar
2. OPERATIONAL OVERVIEW 2.1.2 Status bar The Status bar runs across the top of the ECDIS display. The bar mainly provides for selection of display mode, ECDIS operating mode, chart type and IMO chart display setting. ECDIS NAVI Button or item Description Display mode Selects the display mode, [ECDIS], [RADAR], [CONNING], or [AMS]. - Page 43 2. OPERATIONAL OVERVIEW How to operate the buttons on the Status bar There are two types of buttons on the Status bar: Toggle button and Drop-down list button. You operate the buttons with the trackball module. Button type Operating procedure Toggle button A toggle button alternately selects one of two functions assigned to a button.
-
Page 44: Instantaccess Bar
2. OPERATIONAL OVERVIEW 2.1.3 InstantAccess bar The InstantAccess bar runs vertically along the left edge of the screen. The bar con- tains all the operating functions related to the selected ECDIS operating mode (Voy- age planning, Voyage navigation and Chart maintenance). The bar is divided into two sections, upper and lower. - Page 45 2. OPERATIONAL OVERVIEW Button Description Voyage navigation mode bar ← Minimizes the InstantAccess bar. To restore the maxi- mized bar, click anywhere on the minimized bar. Click arrow Click anywhere on the minimized Voyage Route selects/deselects routes, and moves route to Voyage planning mode (for editing).
- Page 46 NAV log (Voyage, Details, Chart Usage), Target log (Danger Target). *Voyage navigation and Voyage planning modes Selects a color palette, day, dusk or night. • Adjusts the brilliance of a FURUNO or Hatteland monitor unit. • Adjusts the backlighting of the control unit. Inscribes the MOB (ManOverBoard) mark.
-
Page 47: Sensor Information Box
2. OPERATIONAL OVERVIEW 2.1.4 Sensor information box The sensor information box displays ship's heading, speed, course over the ground, speed over the ground and position. When the user-selected sensor fails, the system automatically selects another sensor. When this occurs, the color of the sensor name changes from green to red. -
Page 48: Own Ship Functions Box
2. OPERATIONAL OVERVIEW 2.1.5 Own ship functions box The own ship functions box shows information about own ship, enables offset, and does TM reset. Offset button ENC info WGS84 button appears here. RNC info appears here. TM/CU status • [Offset] button: See section 18.8.1. This button is only operative in the Voyage navi- gation mode. -
Page 49: Route Information Box
2. OPERATIONAL OVERVIEW 2.1.6 Route information box Asterisks appear in data locations when no route is selected for navigation. Minimize button • Route: Name of monitored route • Plan Speed: Planned speed to approach "To WPT". • Plan Course: Planned course between previ- ous WPT and "To WPT". -
Page 50: Overlay/Nav Tools Box
2. OPERATIONAL OVERVIEW 2.1.7 Overlay/NAV Tools box The Overlay/NAV Tools box sets up Minimize button Page name the following: • TT/AIS • Echo (radar overlay) Page • Parallel index lines selection • Range rings buttons • Predictor (predicts ship’s future movements) •... -
Page 51: Ebl, Vrm Boxes
2. OPERATIONAL OVERVIEW 2.1.10 EBL, VRM boxes The EBL measures the bearing to an object, and the VRM measures the range to an object. See section 2.9. 2.1.11 Context-sensitive menus Context-sensitive menus are available at the locations shown below. Right-click the applicable area then select the appropriate item from the menu. -
Page 52: How To Enter Alphanumeric Data
2. OPERATIONAL OVERVIEW 2.1.12 How to enter alphanumeric data On some screens it is necessary to enter alphanumeric data. The data can be input three ways: keyboard of the Control Unit, software keyboard or trackball. Alphanumeric data entry from the keyboard of the Control Unit 1. - Page 53 2. OPERATIONAL OVERVIEW 2. To switch between the alphabet keyboard and symbols keyboard, click [!$&]. Symbols keyboard Alphabet keyboard 3. Click the input box. 4. Click appropriate keys and finally click the [Enter] key. To erase the software keyboard, click the X button at the top right corner of the key- board.
-
Page 54: How To Select The Display Mode
2. OPERATIONAL OVERVIEW How to Select the Display Mode Click the Display mode button at the far left side of the Status bar to select the display mode, among [ECDIS], [RADAR], [CONNING] and [AMS] (option). [ECDIS]: Displays electronic charts. [RADAR]: Shows the radar display. (See the radar manual, issued separately.) [CONNING]: Provides comprehensive navigation displays, like wind direction and rud- der angle, in analog and digital formats. -
Page 55: How To Select The Chart Scale
2. OPERATIONAL OVERVIEW How to Select the Chart Scale When you open a chart it is displayed with the default scale, called the compilation scale. To change the chart scale, do one of the procedures shown below. The scale range is 1:1,000 to 1:70,000,000. •... -
Page 56: How To Select The Presentation Mode
2. OPERATIONAL OVERVIEW How to Select the Presentation Mode The presentation mode is available in North-up TM, North-up RM, Course-up TM, Course-up RM, Route-up RM and Head-up RM. To select a presentation mode, click the presentation mode indication to cycle through the presentation mode choices, or click the triangle to show the drop-down list of presentation modes. -
Page 57: True Motion Reset
2. OPERATIONAL OVERVIEW True Motion Reset In the true motion mode, the chart is stationary and own ship moves on the screen. With TM reset active, own ship moves until it reaches the true motion reset border- line(s), then the chart is redrawn and own ship jumps back to an opposite position on screen based on its course. -
Page 58: How To Control Route And User Charts In Voyage Navigation And Voyage Planning Modes
2. OPERATIONAL OVERVIEW How to Control Route and User Charts in Voyage Navigation and Voyage Planning Modes Click for Voyage navigation mode Click for Voyage planning mode ECDIS ECDIS Functions in Voyage navigation mode Functions in Voyage planning mode Click the appropriate chart mode button [PLAN] or [NAVI] at the top of the display to go to respective mode. -
Page 59: How To Use The Vrm And Ebl
2. OPERATIONAL OVERVIEW How to Use the VRM and EBL The VRM measures the range to an object and the EBL measures the bearing to an object. There are two each of VRMs and EBLs. The lengths of the dashes on the EBL2 and VRM2 are longer than those of the EBL1 and VRM1 to distinguish them. -
Page 60: Ebl, Vrm Functions Available With The Context-Sensitive Menu
2. OPERATIONAL OVERVIEW 2.9.4 EBL, VRM functions available with the context-sensitive menu The EBLs and VRMs have additional functions that are accessed from the context- sensitive menu. Right-click any VRM or EBL box to show the context-sensitive menu. Function Description Centered Centers the origin of the EBL and VRM on the current position. -
Page 61: Datum
2. OPERATIONAL OVERVIEW 2.10 Datum 2.10.1 General Datum is a mathematical model of the earth based on which a sea chart is produced. If the datum of a position sensor and that of a sea chart are different, a transformation has to be made somewhere in the system. -
Page 62: Set Up Before Departure
2. OPERATIONAL OVERVIEW 2.11 Set up Before Departure 2.11.1 Updates before departure Update chart material Update your chart material before embarking on a new voyage. See section 3.21. Display and approve dates for charts and manual updates Note: It is very important that you set the Display and Approve dates for charts as the current date. - Page 63 2. OPERATIONAL OVERVIEW Conditions for chart alerts during route monitoring, which includes safety contour and other chart alerts, on the [Alert Parameters] page of the [Route Plan] dialog box. Check Status: Checked Name of the user chart to be used during route monitoring together with this planned route, on the [User Chart] page of the [Route Plan] dialog box.
-
Page 64: How To Check And Prepare The Route, User Chart To Monitor
2. OPERATIONAL OVERVIEW Recalculate timetable and ETA values Timetable and ETA values can be recalculated from the [Optimize] page in the [Route Plan] dialog box. Minimally set ETD to equal departure time, and set optimization val- ues. Route Bank 2.11.3 How to check and prepare the route, user chart to monitor Select the route to monitor, view linked user charts Select a route for the voyage: In the Voyage navigation mode, click the [Voyage],... - Page 65 2. OPERATIONAL OVERVIEW To see all the user charts linked to the route, click the [Linked User Chart] tab to show the names of all the user charts linked to the route. Click a user chart to view its con- tents.
- Page 66 2. OPERATIONAL OVERVIEW Select the user chart(s) to monitor A user chart can be monitored without linking it to a route. You can select a user chart two ways. • Click the [Voyage], [User Chart] and [Select/Unselect] buttons on the InstantAccess bar to open the [Select Monitor User Chart] dialog box.
-
Page 67: Check Configuration Of Navigation Sensors
2. OPERATIONAL OVERVIEW 2.11.4 Check configuration of navigation sensors You can check the configuration of your navigation sensors in the [System Sensor Settings] page and [Local System Settings] page in the [Sensor] menu. Check speed settings ([SPD] page) Open the menu and click the [SPD] tab in the [System Sensor Settings] page or [Local System Settings] page. -
Page 68: How To Reset Odometer And Trip Meter
2. OPERATIONAL OVERVIEW Check position sensors (POSN page) Open the menu and click the [POSN] tab in the [System Sensor Settings] page or [Lo- cal System Settings] page. The [PRIM] and [Second] labels indicate the type of the position sensor. (In the figure below the [PRIM] label shows FILT). [PRIM] and [Sec- ond] indicate sensor status and priority. -
Page 69: How To Manage Charts
HOW TO MANAGE CHARTS This chapter mainly shows you how to install the public keys, licenses and charts, manually update chart objects, and synchronize charts. All chart-related operations begin from the Chart maintenance mode, which you access by clicking the [CHARTS] button on the Status bar. -
Page 70: How To Install Enc Licenses, Charts
3. HOW TO MANAGE CHARTS 5. Click the [Display Content] button on the [Public Key] dialog box to show the dis- play contents. Public Key content //BIG p FCA6 82SE 8E12 CABA 26EF CCF7 110E 526D B078 B05E DECB CD1E B4A2 08F3 AE16 17AE 01F3 5B91 A47E 6DF6 3413 C5E1 2ED0 8998 CD13 2ACD 50D9 9151 BDC4 3EE7 3579 2E17 //BIG q... -
Page 71: How To Install Enc Charts
3. HOW TO MANAGE CHARTS 5. Find the license (permit.txt) then click the [OK] button to install the license. The [Licenses] dialog box then shows cell name, date of expiration, data server name and subscription type of the license. 6. Click the [Close] button to finish. 7. - Page 72 3. HOW TO MANAGE CHARTS lation and are you sure to continue. Click the [OK] button to continue. A message informs you that the system is searching the medium (in the figure below the me- dium is a DVD) for chart data. The results of the search are displayed, an example of which is shown below.
-
Page 73: How To Install Arcs Licenses, Charts
3. HOW TO MANAGE CHARTS 4. When the installation is completed, information about the installation ap- pears in the [Error/Warn- 100% ing/Guidance] window. Click the [Confirm] button to finish. 5. If applicable, set the next sequential medium and repeat steps 2-4 to install the next charts. -
Page 74: How To Install Arcs Charts
3. HOW TO MANAGE CHARTS 3. Click the [Install Licenses] button. 4. Find the medium that contains the license then click the [Open] button. 5. Click the [OK] button to install the license. 4937 31 Mar 2015 3249 31 Mar 2015 4937 31 Mar 2015 1473... - Page 75 3. HOW TO MANAGE CHARTS that the system is searching the medium (in the figure below the medium is a DVD) for chart data. The results of the search are displayed, an example of which is shown below. To cancel the search, click the [Cancel] button. 3.
- Page 76 3. HOW TO MANAGE CHARTS 4. When the installation is completed, information about the installation appears in the [Error/Warning/Guidance] window. Click the [Confirm] button to finish. 5. If applicable, set the next sequential medium then repeat steps 2-4 to install the next charts.
-
Page 77: How To Delete Enc, Arcs Licenses
3. HOW TO MANAGE CHARTS How to Delete ENC, ARCS Licenses 1. Get into the Chart maintenance mode. 2. Click the [License] button on the InstantAccess bar. 3. Click the [ENC] or [ARCS] tab as appropriate to show a list of licenses. 4. -
Page 78: How To Install C-Map Charts
3. HOW TO MANAGE CHARTS How to Install C-MAP Charts Synchronize chart data before you install C-MAP charts, grouping the ECDIS units to synchronize, otherwise the chart data cannot be shared. See the procedure in section 3.22.1 for how to synchronize chart data. If C-MAP charts are not synchro- nized after installation, delete all C-MAP charts, and do the above procedure again. - Page 79 3. HOW TO MANAGE CHARTS How to install the C-MAP database 1. Insert the medium that contains the C-MAP database. 2. Get into the Chart maintenance mode then click the [AUTO Load] button on the InstantAccess bar. The [Install chart data] window appears and shows the percentage of completion, with digital and analog indication.
- Page 80 3. HOW TO MANAGE CHARTS Note 2: Synchronization is not done for charts which could not be installed success- fully. Reinstall failed charts. How to install C-MAP licenses A C-MAP license file is normally installed automatically. Manual installation is also available.
- Page 81 3. HOW TO MANAGE CHARTS 3.6.3 How to generate, order and apply an update file How to generate and order an update file To update the C-MAP chart database, you have to generate an update file, and e-mail the file directly to C-MAP. The update file defines coverage of charts you can display on your chart radar.
-
Page 82: How To Delete A C-Map Database
3. HOW TO MANAGE CHARTS How to Delete a C-MAP Database If you are going to delete all C-MAP databases, turn off chart synchronization and de- lete the databases from each processor unit. 1. Get into the Chart maintenance mode then click the [License] button on the InstantAccess bar. -
Page 83: How To Export A List Of Charts
3. HOW TO MANAGE CHARTS 3.8.2 How to enable and set up the C-MAP DL 1. Get into the Chart maintenance mode then click the [License] button on the InstantAccess bar. 2. Click the [C-MAP DL] tab to show the [Licenses] dialog box for C-MAP DL. C1210011 01 Jun 2012 Unissued... -
Page 84: How To Export A List Of Specific Licenses
3. HOW TO MANAGE CHARTS 3.10 How to Export a List of Specific Licenses You can export a list of your ENC, ARCS or C-MAP (excluding C-MAP DL) licenses to a USB flash memory, in .txt format. 1. Set a USB flash memory in the USB port on the Control Unit. 2. -
Page 85: How To View Permit Expiration Date
3. HOW TO MANAGE CHARTS To restore licenses: 1. Insert the USB flash memory that has the licenses into the USB port on the Control Unit. 2. Get into the Chart maintenance mode then click the [License] button on the InstantAccess bar to show the [Licenses] dialog box. -
Page 86: How To Display Install/Update History
3. HOW TO MANAGE CHARTS 3.14 How to Display Install/Update History You can see a history of chart installations and updates. On the InstantAccess bar, click the [Record] and [Chart Log] buttons followed by the [ENC], [ARCS] or [C-MAP] button. The example below shows the install/update history for ENC charts. You can filter the log with [Period Covered (UTC)]. -
Page 87: Catalog Of Chart Cells
3. HOW TO MANAGE CHARTS 3.15 Catalog of Chart Cells A catalog is used to view graphical coverage of the charts stored in your SSD, avail- able in a named "medium". Available charts are displayed using their limits of charts. Note that sometimes the real coverage of the charts may be considerably less than the declared limits of it. - Page 88 3. HOW TO MANAGE CHARTS 3) License Valid: Cell with valid license. Missing/Expired: Cell with missing or expired license. Valid + Missing/Expired: Display cell regardless of license. Uncheck both: Hide all cells. 4) Dynamic License Display DL or non-DL C-MAP charts. 5) C-MAP Collections A collection is a pre-defined dataset, the contents of which can be defined by zone, individual chart or any of those combinations.
-
Page 89: How To Group Chart Cells
3. HOW TO MANAGE CHARTS 3.15.1 How to group chart cells You can define groups of like-format chart cells. This means you can collect related charts, for example, all cells that cover a route from Liverpool to New York or all cells available from a National Hydrographic Office. -
Page 90: How To View Status Of Chart Cells
3. HOW TO MANAGE CHARTS How to delete a group of chart cells You can delete group of chart cells as follows: 1. In the Chart maintenance mode, click the [Manage Charts] button on the InstantAccess bar to show the [Filter] window. 2. -
Page 91: How To Open Charts
3. HOW TO MANAGE CHARTS 3.16 How to Open Charts In the Chart maintenance mode, click the [Manage Charts] button on the InstantAccess bar to display the dialog box shown below. Select the chart to open then click the [Open Chart] button. 3.17 How to Print Chart List, Cell Status List 3.17.1... -
Page 92: How To Print The Cell Status List
3. HOW TO MANAGE CHARTS Description of chart list printout Item Description Ship Name Name of ship IMO Number Ship’s IMO number Call Sign Ship’s call sign MMSI Ship’s MMSI number Printing Date Date list printed Data Location Location of charts; normally “Internal”. Filter Settings of the items in the [Filter] window. -
Page 93: How To Delete Charts
3. HOW TO MANAGE CHARTS 3.18 How to Delete Charts If you are going to delete all charts, turn off chart synchronization and delete charts from each processor unit. 1. Click the [Manage Charts] button to show the [Manage Charts] dialog box. 2. -
Page 94: How To Find The Chart Type
3. HOW TO MANAGE CHARTS 3.20 How to Find the Chart Type The electronic chart system can display more than one ENC chart cell at a time. This feature is called multi-cell display. If one ENC chart cell does not cover the whole dis- play, the system opens more ENC chart cells for display, if appropriate cells for the displayed area are available. -
Page 95: How To Insert Update Symbols
3. HOW TO MANAGE CHARTS 3.21.1 How to insert update symbols An update symbol can be added as shown in the procedure below. Note 1: If the system freezes when updating the drawing type [area], reset the power. Note 2: An update symbol that straddles the international date line cannot be edited. In this case, insert the same symbol on each side of the line. -
Page 96: How To Delete Update Symbols
3. HOW TO MANAGE CHARTS 8. You can add a comment related to a manual update object in the [Description] box. 9. To add textual information to an attribute, select the attribute from the [Attributes] window then add text in the [Edit Attribute’s Value] window. 10. -
Page 97: How To Synchronize Chart Data
3. HOW TO MANAGE CHARTS 3.22 How to Synchronize Chart Data This section shows you how to synchronize chart data between FMD-3xx0, FAR-2xx9 and FCR-2xx9 units, so that all units share the same chart data. Synchronization can be done automatically or manually (see section 3.22.2), however all units selected for synchronization must be powered to complete the synchronization. -
Page 98: How To Check Synchronization Status
3. HOW TO MANAGE CHARTS 2. To select a unit for synchronization: Put a checkmark next to the unit’s name in the [Not Synchronize with This Unit] window then click the << button. That unit’s name is moved to the [Grouped with This Unit] window. To deselect a unit from synchronization: Put a checkmark next to the unit’s name in the [Grouped with This Unit] window then click the >>... -
Page 99: Manual Updates And Synchronization
3. HOW TO MANAGE CHARTS Note 1: In normal operation do not disable synchronization. If you accidentally disable synchronization, try to synchronize by clicking the [Enable Sync] button. If that does not work, reset the power of all units selected for synchronization then click the [Urge Sync] button to synchronize. - Page 100 3. HOW TO MANAGE CHARTS This page is intentionally left blank. 3-32...
-
Page 101: How To Control Chart Objects4-1
HOW TO CONTROL CHART OBJECTS This chapter provides the information necessary for controlling chart features. How to Browse Your Charts You can view your charts using different positions and different scales. The basic tools for browsing charts are the RANGE key, chart offcenter, and scroll. RANGE - and RANGE + change the chart scale. - Page 102 4. HOW TO CONTROL CHART OBJECTS MULTI-COLOR presentation Chart zero Shallow contour Safety contour (input value) Safety contour (exisiting in ENC) Deep contour Non-navigable area Navigable area In the multi-color presentation four colors are used for depths. If the value entered as the safety contour does not exist in the electronic chart, the system automatically se- lects the next available deeper depth contour as the safety contour.
-
Page 103: Basic Setting Menu
4. HOW TO CONTROL CHART OBJECTS 4.2.2 Basic Setting menu To display this menu, click [DISP], [SET] and [Basic Setting] on the InstantAccess bar. Symbols: Select how to display chart symbols. The options are [Simplified] and [Pa- per Chart]. Simplified: The shape of symbols is of modern design and the sea mark symbols are filled in a color. -
Page 104: Chart Display Menu
4. HOW TO CONTROL CHART OBJECTS TM Reset: In the true motion mode, own ship moves until it reaches the true motion reset borderline (set here), and then it jumps back to an opposite position on screen based on its course. Set the limit for TM reset (in percentage). For example, “80” re- sets the position when the own ship marker is at a location which is 80% of the range. -
Page 105: Display Base
4. HOW TO CONTROL CHART OBJECTS 4.2.4 Display base A subset of chart features is called the “display base”. As required by IMO, these fea- tures cannot be made invisible. To get the display base, uncheck all items on the [Standard] and [Other] pages in the [Chart Display] menu. - Page 106 4. HOW TO CONTROL CHART OBJECTS True outlines shown if: If the length or width of the own ship mark is greater than 6.0 mm, the own ship mark is shown with the true scale symbol. Select [Length] or [Width]. The right illustration in the figure below shows own ship mark and AIS targets with scaled symbols.
-
Page 107: Tracking Page
4. HOW TO CONTROL CHART OBJECTS 4.3.2 Tracking page Own ship past tracks CCRP: Check to plot own ship’s track with CCRP position as reference. Primary: Check to plot own ship's track with position fed from sensor with highest pri- ority. -
Page 108: Route Page
4. HOW TO CONTROL CHART OBJECTS 4.3.3 Route page The [Route] page selects the route parts of the monitored and planned routes to show on the ECDIS. Channel Limit: The distance from the centerline to one side of the nav lane. -
Page 109: Targets Page
4. HOW TO CONTROL CHART OBJECTS Tidals: Check to show tidal symbols and tidal data on user charts. Areas: Check to show areas on the user charts. Circles: Check to show circles on user charts. Density: Set the degree of transparency for the user chart objects. Color fill for the areas can be chosen as transparent from 0%, 25%, 50% or 75%. -
Page 110: Control Of Predefined Imo Chart Display Settings4-10
4. HOW TO CONTROL CHART OBJECTS Past position TT Points: Select the number of TT past position points to display. AIS Points: Select the number of AIS past position points to display. Style: Select style of presentation of target's past position. Control of Predefined IMO Chart Display Settings There are three sets of predefined chart display settings that can be used to display... -
Page 111: Vector (S57) Charts
VECTOR (S57) CHARTS Theoretically a chart can be coded for use on a computer as a vector chart. Vector- coded charts are coded using a variety of techniques. One technique is called S57ed3 and it has been chosen by IMO as the only alternative for SOLAS compliant electronic charts. -
Page 112: Definitions Of Terms
5. VECTOR (S57) CHARTS 5.1.1 Definitions of terms Cell A cell is a geographical area containing ENC data and it is the smallest di- vision of ENC data. Each cell has a separate unique name. Hydrographic Offices divide their responsibility area by the cells that they publish. S57 chart A database, standardized as to content, structure and format, is issued for use with this system without any authority of government-authorized Hydro-... -
Page 113: Permanent Warnings For S57 Charts
5. VECTOR (S57) CHARTS Update Date: Date of update Compilation Scale: The scale of the original paper chart is shown here. Projection: Projection of current chart. Horizontal Datum: Horizontal datum used with current chart. Sounding Datum: Datum used to create sounding data. Vertical Datum: Vertical datum used with current chart. -
Page 114: Chart Viewing Dates And Seasonal Features Of The S57 Chart
5. VECTOR (S57) CHARTS Chart Viewing Dates and Seasonal Features of the S57 Chart 5.2.1 Introduction S57 charts contain date-dependent features. Updating in general, including reissues, new editions and updates, creates date dependency. In addition to the obvious date dependency, some features of the S57 charts create additional date dependency. These features include "Date Start", "Date End", "Seasonal date start"... -
Page 115: How To Set Display Date And Approved Until Dates
5. VECTOR (S57) CHARTS 5.2.3 How to set Display date and Approved until dates Click the [Chart INFO] and [Viewing Dates] button on the InstantAccess bar to show the [Viewing Date] dialog box. Set desired dates then click the [Close] button. 5.2.4 About chart viewing date dependency of S57 standard How the issue date of updates changes the visibility of the changes... -
Page 116: Symbology Used In S57 Charts
5. VECTOR (S57) CHARTS Symbology Used in S57 Charts You can familiarize yourself with the symbology used by browsing IHO Chart 1, which is included in this system. Note that it behaves as any S57 chart and it follows your selections. - Page 117 5. VECTOR (S57) CHARTS 1. Get into the Voyage navigation mode or Voyage planning mode then right-click an object to show the context-sensitive menu. (The menu shown below appears in the Voyage navigation mode.) Ship off center Object INFO Chart Legend Manual Update New Divider 2.
-
Page 118: Admiralty Information Overlay (Aio)
5. VECTOR (S57) CHARTS Admiralty Information Overlay (AIO) The Admiralty Information Overlay includes all Admiralty Temporary and Preliminary Notices to Mariners (T&P NMs) and provides additional navigationally significant in- formation from UKHO's ENC validation programme. The AIO is displayed as a single layer on top of the basic ENC and is available free of charge as part of the Admiralty S57 Chart Service and within Admiralty Value Added Resellers' services. -
Page 119: Catalog Of Aio Cells
5. VECTOR (S57) CHARTS 5.5.3 Catalog of AIO cells A catalog of AIO (NtoM) cells is maintained in the [Manage Charts] dialog box. To show this box, get into the Chart maintenance mode then click the [Manage Charts] button on the InstantAccess bar. The AIO cell is GB800001. NtoM... -
Page 120: How To Find Aio Chart Object Information
5. VECTOR (S57) CHARTS 5.5.4 How to find AIO chart object information Do the following to find chart object information contained in the AIO. 1. Right click a red hatched area in the chart area, then select [Object INFO] to show the [Select Object] dialog box. -
Page 121: How To Select The Information To Display
5. VECTOR (S57) CHARTS 5.5.5 How to select the information to display Select what type of notices to display as follows: 1. Click the [DISP], [SET] and [Chart DISP] buttons on the InstantAccess bar. 2. Click the [NtoM] tab. 3. In the [AIO] window, check the items to display. 4. - Page 122 5. VECTOR (S57) CHARTS This page is intentionally left blank. 5-12...
-
Page 123: Raster (Arcs) Charts
RASTER (ARCS) CHARTS ARCS Charts Approximately 2,700 ARCS charts are available on 11 chart CD-ROMs, covering the world's major trading routes and ports. Regionally based chart CD-ROMs RC1 to RC10 contain standard BA navigation charts, while RC11 contains ocean charts at scales of 1:3,500,000 and smaller. - Page 124 6. RASTER (ARCS) CHARTS Projection: Projection of current chart. Horizontal Datum: Horizontal datum used with current chart. WGS 84 Shift: Datum shift between local datum and WGS-84 datum is known (=De- fined), unknown, operator defined (=Undefined) or shift is known only some parts of chart (=Partially defined).
- Page 125 6. RASTER (ARCS) CHARTS Warnings There could be warnings not included in Notices to Mariners. British Admiralty may re- lease textual warnings for any chart and they are available here. Click the [Warnings] button to display the [Warnings] window. How to set preference for inset (panel) If there are the different insets with the same position, the operator can select pre- ferred inset, which displays your ship's position.
- Page 126 6. RASTER (ARCS) CHARTS How to display notes of ARCS chart The operator can select a desired item from the combo box in the [ARCS Details] di- alog box in order to view notes for that item. Select an item on the [Notes] combo box then click the [Show Notes] button to show the notes for the selected item.
-
Page 127: Datum And Arcs Charts
6. RASTER (ARCS) CHARTS Datum and ARCS Charts The difference between ARCS chart local datum and WGS 84 datum is known as WGS 84 shift. This difference is known and the system does the conversion automat- ically. If the WGS shift for a chart is defined, the amount of shift is indicated. If the WGS shift is not defined, "Undefined"... -
Page 128: Arcs Subscriptions
6. RASTER (ARCS) CHARTS ARCS Subscriptions ARCS customers can subscribe to one of two service levels, ARCS Navigator or ARCS Skipper. Note: If you receive an ARCS chart permit on a floppy disk, copy the contents of the disk to a USB flash memory and then install the permit files. 6.4.1 ARCS Navigator ARCS Navigator operators receive a comprehensive weekly updating service on a... -
Page 129: C-Map Charts
C-MAP CHARTS The descriptions in this chapter apply to the CM-93/3 charts. (This system does not support CM-93/2 charts.) C-MAP Cartographic Service Your chart system has the capability of using and displaying the latest C-MAP world- wide vector chart database. These charts are fully compliant with the latest IHO S-57 3.1 specifications. -
Page 130: Troubleshooting
7. C-MAP CHARTS Troubleshooting If you are having problems installing your software or charts please check the follow- ing before contacting C-MAP: • Check that the charts are available, with the chart management function. • Check that the license is correctly installed, with the license function Contact Information: For information or help please call you're nearest C-MAP Office (details can be found on the reverse side of the C-MAP chart CO box) or contact C- MAP Norway. -
Page 131: Chart Display
7. C-MAP CHARTS Chart Display 7.7.1 Introduction C-MAP charts are S57 charts displayed together with ENC (S57) and CM93/3 charts. These charts have the priority order shown below. 1. CM- ENC 2. C-MAP 93/3 Prof and C-MAP 93/3 Prof+ If the same navigational purpose charts are available over an area, priority is as shown above. -
Page 132: Permanent Warnings
7. C-MAP CHARTS Magnetic Variation: Amount of magnetic variation. A positive value indicates a change in an easterly direction and a negative value indicates a change in a westerly direction. Quality Indication: Quantitative estimate of the accuracy of chart features, given by the chart producer. -
Page 133: Notice To Mariners (Nm)
7. C-MAP CHARTS Notice to Mariners (NM) The NM has been developed to ensure mariners can simply view the information they need - in addition to the standard chart - to navigate safely and compliantly. By clearly showing where important Temporary or Preliminary changes may impact a voyage, the NM will give seafarers the same consistent picture of the maritime environment on their charts as they have always had. -
Page 134: Catalog Of Nm Cells
7. C-MAP CHARTS 7.9.3 Catalog of NM cells A catalog of NM cells is maintained in the [Manage Charts] dialog box. To show this box, get into the Chart maintenance mode then click the [Manage Charts] button on the InstantAccess bar. 7.9.4 How to find NM chart object information Do the following to find chart object information contained in the NM. -
Page 135: How To Select The Nm Information To Display
7. C-MAP CHARTS 7.9.5 How to select the NM information to display Select what type of notices to display as follows: 1. Click the [DISP], [SET] and [Chart DISP] buttons on the InstantAccess bar. 2. Click the [NtoM] tab. 3. In the [Jeppesen] window, check the items to display. 4. - Page 136 7. C-MAP CHARTS This page is intentionally left blank.
-
Page 137: Chart Alerts
CHART ALERTS The ECDIS can detect areas where the depth is less than the safety contour or detect an area where a specified condition exists. If prediction of own ship movement goes across a safety contour or an area where a specified condition exists, the system does the following: •... -
Page 138: Chart Alerts
8. CHART ALERTS Chart Alerts Official S57 chart material contains depth contours that can be used for calculation of chart alerts. A chart database also includes different types of objects that the operator can use for chart alerts. The procedure for setting chart alerts is outlined below. 1. -
Page 139: How To Select Objects Used In Chart Alerts
8. CHART ALERTS 8.1.2 How to select objects used in chart alerts You can also include calculation areas that have to be noted when sailing (for exam- ple, restricted areas). To include these areas in chart alerts, do the following: 1. -
Page 140: How To Activate Own Ship Check
8. CHART ALERTS How to Activate Own Ship Check Calculation of own ship predicted movement area is done using a check area about own ship position. Set the check area as follows: 1. Select the [Check Area] page from the [Overlay/ NAV Tools] box. -
Page 141: Route Planning
8. CHART ALERTS Object selected for Chart Alert Chart alert Highlight (red) area Route Planning The system will calculate chart alerts using user-defined channel limit for routes. Dan- ger areas are shown highlighted if safety contour or user-chosen chart alert areas are crossed by the planned route. - Page 142 8. CHART ALERTS Check Status: Checked 4. Click the [Check Route] button to generate a list of chart alerts. The results appear on the [Check Results] page. Route Bank The figure above shows the alerts to be monitored. If there are alerts included in the planned route, check alerts leg by leg, or check alerts by using category of alert.
-
Page 143: Route Monitoring
8. CHART ALERTS Route Monitoring • When the ship enters a check area, a visual alert (caution level) is generated. Nei- ther objects or routes are highlighted. • When the ship enters a check area, a visual alert (alarm, warning level) is generat- ed. - Page 144 8. CHART ALERTS This page is intentionally left blank.
-
Page 145: Routes
ROUTES Route Planning Overview A route plan defines the navigation plan from starting point to the final destination. The plan includes: • Route name • Name, latitude and longitude of each waypoint • Radius of turn circle at each waypoint •... -
Page 146: Main Menu For Route Planning
9. ROUTES Main Menu for Route Planning The main parameters for the route planning are: • Latitude and longitude of the waypoint • Channel limits to the waypoint • Turning radius of the waypoint • Maximum speed limit and planned speed for each leg There are two phases for a route: Route Plan and Route Monitor. -
Page 147: How To Create A New Route
In this condition you can make a route and use it for navigation, but you cannot save it. Contact a FURUNO dealer for instruction. 4. Use the cursor to select a position for the first waypoint then push the left mouse button. - Page 148 9. ROUTES 1) In the Route Plan dialog box, right click the bearing or the distance of the waypoint to change. 2) Select [Adjust Position] to show the [Adjust Waypoint] context menu shown right. 3) Enter value at [Direction] or [Distance], then click the [OK] button.
-
Page 149: How To Use The Waypoints Page
9. ROUTES 9.4.1 How to use the Waypoints page The following fields and boxes can be found in the [Waypoints] page. Scroll the list rightward to see hidden items. WPT: Each waypoint has a number. CH Limit/m: Define channel limit for each Name: You can name each waypoint. -
Page 150: How To Use The User Chart Page
9. ROUTES Note: You can select the route information data to display on the [Waypoints] page with the context-sensitive menu. Right click the “Edit Columns” to show the context- sensitive menu. Check or uncheck items as appropriate then click the [OK] button. CH Limit/m 9.4.2 How to use the User Chart page... -
Page 151: How To Use The Optimize Page
9. ROUTES 9.4.3 How to use the Optimize page After all waypoints are inserted and you have made safe water calculation, you can optimize your route, on the [Optimize] page. If not chosen, then optimization will be done automatically with max. speed. If you want do optimization with a specific strat- egy, see section 9.8 for how to optimize a route. -
Page 152: How To Use The Alert Parameters Page
9. ROUTES 9.4.4 How to use the Alert Parameters page The [Alert Parameters] page sets the alert conditions to use when checking a route. Put a “W” for an item to highlight on the chart. ([Safety Contour] is fixed to “A” (Alarm). If you do not require the highlight display for an item, put a “C”... -
Page 153: How To Use The Check Results Page
9. ROUTES Radio buttons, input boxes Alert items Item Description Item Description Seaplane Land- Seaplane landing area ing Area Submarine Tran- Submarine transit lane sit Lane Anchorage Area Anchorage area MarineFarm Marine farm aquaculture Aquaculture PSSA Area Particularly Sensitive Sea Area Non-official ENC No official ENC data No Vector Chart... -
Page 154: How To Modify An Existing Route
9. ROUTES How to Modify an Existing Route 9.5.1 How to change waypoint position To change position of a waypoint you have the following choices: • Enter latitude and longitude on the [Waypoints] page in the [Route Plan] dialog box. •... -
Page 155: How Insert A Waypoint
9. ROUTES 9.5.4 How insert a waypoint How to insert a waypoint between waypoints from the electronic chart area 1. Put the cursor anywhere on the route where you want to insert a waypoint. 2. Right-click to show the context-sensitive menu then click [Edit]. 3. -
Page 156: Sar Operations
9. ROUTES SAR Operations The SAR feature facilitates search and rescue and MOB operations. To use the SAR feature, get into the Voyage planning mode then do the following: 1. Click the [Planning] and [Route] buttons on the InstantAccess bar to show the [Route Plan] dialog box then click the [SAR] button. - Page 157 9. ROUTES Search Options Sample pattern type Expanding WPT7 square 90.00° Start Leg Length WPT3 90° WPT4 WPT8 Direction: Set the direction to start 90.00° WPT2 the search, Clockwise or Anticlock- WPT6 wise. Search Pattern 90.00° Search Pattern Heading: See the Heading right figure.
- Page 158 9. ROUTES Search Options Sample pattern type Sector Search Pattern Heading search WPT3 WPT6 Sector #2 Sector #1 60° WPT9 WPT4 Direction: Select the direction to WPT2 WPT5 start the search, Clockwise or Anti- clockwise. Search Pattern Heading: See the Sector #3 right figure.
-
Page 159: Route Bank
9. ROUTES Route Bank The route bank stores all the routes you have created. To show the route bank in the Voyage planning mode, select [Route], [Route Bank] in [Route Plan] dialog box: Route name Date created or Route ID modified Total no. -
Page 160: Route Optimization
9. ROUTES 6. Click the << button to insert the waypoint(s) from the inactive route to the active route. In the example below, WPT1 of the inactive route is inserted at the end of the active route, becoming its waypoint 5. Route1 Route2 7. -
Page 161: How To Optimize A Route
9. ROUTES 9.8.2 How to optimize a route You can define Estimated Time of Departure (ETD), desired number of waypoints and Estimated Time of Arrival (ETA) on the [Optimize] page in the [Route Plan] dialog box to optimize your route. 1. -
Page 162: How To Plan A Speed Profile
9. ROUTES 3) For [Time table], the [Set ETA] window appears. Set the ETA to use for each waypoint. To enter the Time and Date, click the [Date] window to show the [Set date] window. Click the appropriate date. The date entered appears in the [Set ETA] window. -
Page 163: How To Import Routes
9. ROUTES How to Import Routes 9.9.1 How to import FMD-3xx0, FAR-3xx0, FCR-2xx9 route data You can import a route created on another FMD-3xx0, FAR-3xx0, FCR-2xx9. 1. Set the USB flash memory that contains the route data to import in the USB port on the Control Unit. -
Page 164: How To Import Csv, Ascii Format Route Data
9. ROUTES 9.9.3 How to import csv, ASCII format route data 1. Set the USB flash memory to the Route Data Management USB port on the Control Unit. 2. Activate the Voyage planning mode. 3. On the InstantAccess bar, click the [Manage Data] and [Route] buttons to show the [Route Data Manage- ment] dialog box. -
Page 165: How To Export Route Data In Fea-2X07, Csv, Ascii Format
9. ROUTES 9.10.2 How to export route data in FEA-2x07, csv, ASCII format 1. Activate the Voyage planning mode then set a USB flash memory to the USB port on the Control Unit. 2. On the InstantAccess bar, click the Route Data Management [Route], [Route] and [Route Data Management] buttons to show the... -
Page 166: Reports
9. ROUTES 9.12 Reports This ECDIS generates reports for waypoints in the selected route. If connected to a printer, reports can be printed by clicking the [Print Text] button. Text in reports can be searched with the [Find] button. To generate a report, do the following: 1. - Page 167 9. ROUTES WPT report The WPT report contains the following information for each waypoint in the route se- lected. • Route name • Date of report • Waypoint no. • Position in latitude and longitude • Length of waypoint • Distance remaining in route •...
- Page 168 9. ROUTES Full WPT report You can generate a full waypoint report for the route selected. The report includes the following for each waypoint • Route name • Date of report • Waypoint no. • Position in latitude and longitude •...
- Page 169 9. ROUTES Passage plan report The passage plan report generates waypoint information for each waypoint in the route selected. • Route name • Date of report • Waypoint no. • Position in latitude and longitude • Length • Cumulative length •...
- Page 170 9. ROUTES This page is intentionally left blank. 9-26...
-
Page 171: 10. User Charts
10. USER CHARTS 10.1 Introduction User charts are overlays that the user creates to indicate safety-related objects and areas. They can be displayed on both the radar overlay and the electronic chart. These charts are intended for pointing out safety-related items like position of import- ant navigation marks, safe area for the ship, etc. -
Page 172: How User Charts Are Synced
10. USER CHARTS • Circle: The operator can define an area with a circle, which can define a location to avoid. If route or estimated ship position is going to cross the area, the system gen- erates a warning to the user. These areas can be used to specify safe areas as de- fined by the master or by the policy of the ship's owner. -
Page 173: How To Create A User Chart
10. USER CHARTS 10.3 How to Create a User Chart You can create and modify a user chart in the Voyage planning mode. To make a complete user chart, do the following: 1. Click the [PLAN] button on the Status bar to go to the Voyage planning mode. 2. - Page 174 10. USER CHARTS (3) Click (1) Click (2) Click (4) Right-click; select Finish. (2) Drag cursor; (1) Click double-click to set. 1) Put cursor where to locate center of circle then click. 2) Drag cursor to set radius; double-click to set. How to create a line How to create a circle (1) Click...
- Page 175 10. USER CHARTS 3) For a line, enter the distance from the line position in the [Range of notes] input box. Note: You cannot select both Danger and Notes for these symbols; select ei- ther Danger or Notes. What are Notes? "Notes"...
- Page 176 10. USER CHARTS • The Line with the name "Coast" is a coastline. • The Notes for the Circle is “E”. The message that was input in the [Description] box will appear in a pop-up window when your ship arrives inside the Circle. •...
-
Page 177: How To Import A User Chart Created With Ecdis Fea-2X07
10. USER CHARTS 10.4 How to Import a User Chart Created with ECDIS FEA-2x07 User charts created at the ECDIS FEA-2x07 can easily be imported to this ECDIS. Copy the user charts to a folder (see chapter 17 in the operator’s manual of the FEA- 2x07) in a USB flash memory then do as follows. -
Page 178: How To Edit Objects On A User Chart
10. USER CHARTS 10.5 How to Edit Objects on a User Chart Do steps 1 and 2 in section 10.3 to show the [User Chart] dialog box then click the [Se- lect] button. Select the user chart to edit then click the [Open] button. Follow the ap- propriate instructions below. -
Page 179: How To Select The User Chart Objects To Display
10. USER CHARTS 10.7 How to Select the User Chart Objects to Display User charts can be displayed on the electronic chart. Open the [Mariner] page in the [Symbol Display] menu and check the user chart items to display. Choose the degree of transparency for the objects with [Density]. -
Page 180: User Chart Reports
10. USER CHARTS 10.9 User Chart Reports 1. Click the [Plan] button to go to the Voyage planning mode. 2. Click the [Report] button followed by the [User Chart] button to show the [Select User Chart] dialog box. 3. Select the appropriate user chart then click the [OK] button to show the selected report. - Page 181 10. USER CHARTS Tidal report The tidal report provides • Position of the tidal • Type of tidal (current or predicted) • Speed and direction of the tidal • Time of the tidal Line report The Line report provides line name and latitude and longitude of each point on the line. 10-11...
- Page 182 10. USER CHARTS Clearing line The Clearing line report shows the name and position of clearing lines entered on the user chart selected. Area report The area report provides • Area no. and area name • The description of the area •...
- Page 183 10. USER CHARTS Circle report The Circle report provides the position and radius of circles drawn on a user chart. Label report The Label report provides the latitude and longitude position of each label, the name of each label. On radar is shown if the label is shown on the radar overlay. 10-13...
-
Page 184: How To Select The User Chart(S) To Use In Route Monitoring
10. USER CHARTS 10.10 How to Select the User Chart(s) to Use in Route Monitoring Click the [NAVI] button on the Status bar then do as follows to select the user chart(s) to use in route monitoring. 1. Click the [Voyage], [User Chart] and [Select/Unselect] buttons on the InstantAccess bar to open the [Select Monitor User Chart] dialog box. -
Page 185: 11. How To Monitor Routes
11. HOW TO MONITOR ROUTES Route monitor is a means for permanent monitoring of the ship's behavior relative to the monitored route. The [Monitor Information] box displays the data on the ship's po- sition relative to the monitored route. The monitored route consists of the following in- formation, displayed in the electronic chart area: •... - Page 186 11. HOW TO MONITOR ROUTES Method 2: Selection from the Route information box Right-click the route name location in the [Route Information] box then select [Select Route] to show the [Select Route] dialog box. Select a route then click the [Open] but- ton.
-
Page 187: How To Stop Monitoring A Route (Manual, Auto)
11. HOW TO MONITOR ROUTES About monitoring routes When you choose a route for monitoring, the messages shown below appear, on the [Select Route] dialog box or in a message window, when a route cannot be opened for monitoring. •... -
Page 188: How To View Waypoint Information
11. HOW TO MONITOR ROUTES 11.4 How to View Waypoint Information Click the [Voyage] and [Monitor INFO] buttons on the InstantAccess bar to show the [Monitor Information] dialog box. Click the [Waypoints] tab to show waypoint info. * Scroll list horizontally to view below items. 3.60 2.51 3.00... -
Page 189: How To View Linked User Chart Information
11. HOW TO MONITOR ROUTES 11.5 How to View Linked User Chart Information Click the [Voyage] and [Monitor INFO] buttons on the InstantAccess bar, then click the [Linked User Chart] tab in the [Monitor Information] dialog box. The [Linked User Chart] list shows all the user charts linked with the monitored route and their contents. -
Page 190: How To Change Monitored Route To Planned Route
11. HOW TO MONITOR ROUTES 11.7 How to Change Monitored Route to Planned Route The monitored route can be transferred to the Voyage planning mode. This is useful when you don't need the route for monitoring but want to edit it. To transfer the moni- tored route, click the [Voyage], [Route] and [Move to Plan] buttons on the InstantAc- cess bar. -
Page 191: Safe Off Track Mode
11. HOW TO MONITOR ROUTES 11.8.1 Safe off track mode Click here to show drop down list to select mode. If it becomes necessary to deviate from the monitored route; for example, to avoid collision, use the [Safe Off Track] mode to create an instant track to a safe location. -
Page 192: Back To Track Mode
11. HOW TO MONITOR ROUTES 11.8.2 Back to track mode When the vessel goes off track, the alert Click here to show drop "172 Off Track Alarm" appears in the down list to select mode. [Alert] box. To create an instant track to re- turn to the monitored route, use the [Back to Track] mode as follows: 1. -
Page 193: Instant Track Messages
11. HOW TO MONITOR ROUTES 11.8.3 Instant track messages The table below shows all the instant track messages and their meanings. Message Meaning Color (1) Instant Track mode "Back to Track" Back to track mode White "Safe Off Track" Safe off track mode White (2) Check result, error message "Could not create the Track."... -
Page 194: Instant Track Details
11. HOW TO MONITOR ROUTES 11.8.4 Instant track details You can see the location and alert type found in an instant track by clicking the [De- tails] button on the [Instant Track] dialog box. Note: If the Status is not [OK], an alert (alarm or warning priority, depending on set- ting) appears in the Alert box. - Page 195 11. HOW TO MONITOR ROUTES To close the [Instant Track] dialog box, click the [Close] button. (The system continues monitoring the instant track route.) The following occurs when sensor data is lost while using the instant track function. Monitoring condition Result Instant track route monitor- •...
-
Page 196: How To Return To A Monitored Route When Following An Instant Track Route (Safe Off Track Mode Only)
11. HOW TO MONITOR ROUTES 11.8.6 How to return to a monitored route when following an instant track route (safe off track mode only) Do the following to return to a monitored route while following an instant track route. 1. While monitoring an instant track route, click the [Original Route] dialog box and its [Monitoring] page in the [Instant Track] dialog box to show the [Select Route] dialog box. -
Page 197: Button Label And Equipment State
11. HOW TO MONITOR ROUTES 11.8.7 Button label and equipment state The label on the button at the position circled in the figure below changes according to the state of the instant track. Instant track TCS state Button label state Creating Monitoring Execute (same function as Monitoring) -
Page 198: How To Share A Monitored Route
11. HOW TO MONITOR ROUTES 11.9 How to Share a Monitored Route With multiple units (FMD-3xx0, FCR-2xx9, FAR-3xx0) connected, the master unit can share a monitored route with the units mentioned above. Follow the procedure below to enabling the route sharing feature. 1. -
Page 199: 12. Navigation Tools
12. NAVIGATION TOOLS This chapter presents the various navigation tools available with the system. With the exception of the divider, the tools listed below are in the [Overlay/NAV Tools] Box. • TT/AIS (see chapters 13 and 14) • Echo (see chapter 16) •... -
Page 200: Parallel Index (Pi) Lines
12. NAVIGATION TOOLS 12.2 Parallel Index (PI) Lines The parallel index lines are useful for keeping a constant distance between own ship and a coastline or a partner ship when navigating. There are six sets of PI lines (PI- P6) and you can turn them on or off individually. Select the PI line to process with the [Display] pull-down list then click the [ON] or [OFF] button as appropriate. -
Page 201: How To Adjust Pi Line Orientation, Pi Line Interval
12. NAVIGATION TOOLS 12.2.5 How to adjust PI line orientation, PI line interval There are two ways to adjust PI line orientation and PI line interval: through the menu and on the screen. How to adjust PI line orientation, PI line interval from the menu 1. -
Page 202: How To Adjust Pi Line Length
12. NAVIGATION TOOLS 12.2.7 How to adjust PI line length You can adjust the forward and backward lengths of a PI line when [Index Lines] is set to 1. 1. Open the main menu and select [NAV Tools], [PI Lines] and [Truncate]. 2. -
Page 203: Check Area
12. NAVIGATION TOOLS 12.3 Check Area Check area sets the area ahead and around own ship for which to check for safe nav- igation. See section 8.2 for how to activate own ship check. 12.4 Ring The range rings are the concentric set of rings on the ECDIS display. They provide an estimation of the range to an object. -
Page 204: Predictor
12. NAVIGATION TOOLS 12.5 Predictor The predictor is a tool for estimating your ship's future positions and behavior. The on- screen predictor graphic consists of three pieces of your ship, drawn in true scale to successive future positions. The position of the third symbol will be your approximate position at the end of the time interval selected. -
Page 205: Anchor Watch
12. NAVIGATION TOOLS 12.6 Anchor Watch The anchor watch feature checks to see if your ship is drifting when it should be at rest. Alarm setting Conning position : Alarm triggered To set the anchor watch: 1. Select the [Anchor Watch] page. 2. -
Page 206: Ukc (Under Keel Clearance)
12. NAVIGATION TOOLS 12.7 UKC (Under Keel Clearance) 12.7.1 UKC overview The UKC is the distance between the deepest point of the vessel's hull and the sea- bed. The UKC feature continuously checks ship's draught setting (UKC), and actual depth. When the depth gets shallower than the UKC, the Alert 634 “UKC Limit” is gen- erated. -
Page 207: Ukc Window
12. NAVIGATION TOOLS 12.7.3 UKC window The UKC window provides a visual graphic of the relationship between UKC, draft and current depth. The window can be shown or hidden as desired and located anywhere within the electronic chart area. To show the window, click [Show UKC] on the [UKC] page. -
Page 208: Divider
12. NAVIGATION TOOLS 12.8 Divider The divider performs the following calculations: • Range and bearing between two points • TTG between two points • Total TTG from start to end • Total distance from start to end The divider is available in the Voyage navigation and Voyage planning modes. Only one divider can be displayed. -
Page 209: Usage Characteristics, Limitations
12. NAVIGATION TOOLS 00:13 2.75NM 11.63NM 00:26 00:13 358.6° 261.1° 22.60NM 00:26 22.60NM 11.63NM 11.63NM 170.6° 170.6° Drag here 00:13 00:13 00:13 00:13 10.57NM 10.57NM 10.97NM° 10.97NM 213.6° 213.6° 00:00 00:00 00:00 00:00 12.8.2 Usage characteristics, limitations • The distance between points is shown to the hundredths decimal place up to 100 NM and to the tenths decimal place thereafter. - Page 210 12. NAVIGATION TOOLS This page is intentionally left blank. 12-12...
-
Page 211: Tracked Target (Tt)
13. TRACKED TARGET (TT) FUNCTIONS With connection to a radar, the movement of a maximum of 200 radar-tracked targets can be shown on the chart. Note: The following conditions must be met to use the TT function: • The TT data from the radar must be true bearing referenced. •... -
Page 212: Tt Symbols And Tt Attributes
13. TRACKED TARGET (TT) FUNCTIONS 13.2 TT Symbols and TT Attributes 13.2.1 TT symbols The symbols used in this equipment comply with IEC 62288 Ed.2. Symbol Default color Name Description Green Past position point Marks a past position of a TT. Green Target under A target acquired manually is initially indicated... -
Page 213: Tt Cpa/Tcpa Alarm
13. TRACKED TARGET (TT) FUNCTIONS 13.3 TT CPA/TCPA Alarm A dangerous TT is one whose CPA and TCPA are within the range of the CPA and TCPA limits set on the [TT/AIS] page in the [Overlay/NAV Tools box]. A dangerous TT is displayed as a blinking target symbol in red until you acknowledge the "TT CPA/TC- PA"... -
Page 214: How To Set The Lost Tt Alarm Filter
13. TRACKED TARGET (TT) FUNCTIONS 13.4.2 How to set the lost TT alarm filter If you are in a congested area the lost TT alarm may sound against many TT. In this case, you can prevent the alarm from sounding against TT that are under a certain range and/or speed. - Page 215 13. TRACKED TARGET (TT) FUNCTIONS In) the true vector mode, there are two types of stabilization: ground stabilization (True-G) and sea stabilization (True-S). The stabilization mode is automatically select- ed according to speed selection, as shown in the table below. Speed selection True vector mode LOG(WT)
-
Page 216: How To Display Tt Data
13. TRACKED TARGET (TT) FUNCTIONS 13.6 How to Display TT Data 13.6.1 How to display target data for individual TT By Control Unit Put the cursor on a TT then push the TARGET DATA key. By trackball Click the target for which you want to show its data. TT data To erase TT data from a data box, click the appropriate close data button. -
Page 217: Displaying Past Positions Of Tt
13. TRACKED TARGET (TT) FUNCTIONS 13.7 Displaying Past Positions of TT The past position display shows equally time-spaced dots marking past positions of TT. A new dot is added at preset time intervals until the preset number is reached. If a TT changes its speed, the spacing will be uneven. -
Page 218: Tt Source
13. TRACKED TARGET (TT) FUNCTIONS 13.8 TT Source The TT source can be either a radar antenna or the TTM sentence. Normally, select the radar antenna chosen to display radar echoes as the TT source. To automatically select the radar currently displaying radar echoes as the TT source, check the [SYNC. -
Page 219: 14. Ais Target Functions
14. AIS TARGET FUNCTIONS 14.1 Introduction An AIS transponder can be connected to the ECDIS to display AIS targets received from an AIS transponder. The ECDIS can store up to 2,000 AIS targets in its storage buffer. When this buffer becomes full of AIS targets, Alert 533 “AIS Target Capacity 100%”... -
Page 220: Ais Symbols
14. AIS TARGET FUNCTIONS There can be several hundreds or several thousands AIS targets, and of those only a few will be significant for your ship. To remove unnecessary AIS targets from the EC- DIS display, the feature "active and sleeping AIS targets" is available. Initially any new AIS target received by an AIS transponder is not-active (="sleeping"). - Page 221 14. AIS TARGET FUNCTIONS Default Symbol Name Description color Green No heading/COG target AIS symbols are shown in a broken lines in the following cases: • No water or ground tracking speed of your ship, or there is no speed data. All AIS symbols are shown in broken lines.
-
Page 222: Voyage Data
14. AIS TARGET FUNCTIONS 14.3 Voyage Data Before you embark on a voyage, set your navigation status, ETA, destination, draught and crew, on the [Voyage Data] page in the [NAV Status] menu. The data entered here is reflected to the AIS transponder. 1. -
Page 223: How To Show, Hide Ais Targets
14. AIS TARGET FUNCTIONS 14.4 How to Show, Hide AIS Targets Targets that are being tracked by an AIS transponder can also be displayed on the ECDIS display. To show or hide AIS target, select the [TT/AIS] page from the [Overlay/ NAV Tools] box. -
Page 224: How To Filter Ais Targets
14. AIS TARGET FUNCTIONS 14.5 How to Filter AIS Targets 1. Right-click [AIS] on the [TT/AIS] page in the [Overlay/NAV Tools box], select [Set- ting] and open the [Setting.1] page. (The [Setting.1] page can also be opened from the menu (MENU→[TT/ AIS]→[Setting]→[Setting.1].) 2. -
Page 225: Ais Cpa/Tcpa Alarm
14. AIS TARGET FUNCTIONS 14.6 AIS CPA/TCPA Alarm A dangerous AIS target is one whose CPA and TCPA are within the range of the CPA and TCPA limits set in the information area. A dangerous AIS target is displayed as a blinking target symbol in red as long as you acknowledge the "AIS CPA/TCPA"... -
Page 226: Automatic Activation Of Sleeping Targets
14. AIS TARGET FUNCTIONS 14.7 Automatic Activation of Sleeping Targets 14.7.1 Enabling, disabling automatic activation of sleeping targets Enable or disable the automatic activation of sleeping targets from the [TT/AIS] page of the [Overlay/NAV Tools] box. Click the indication below to enable or disable auto- matic activation. -
Page 227: How To Sleep All Activated Targets
14. AIS TARGET FUNCTIONS 14.8 How to Sleep All Activated Targets You can sleep all activated targets. Open the [TT/AIS] menu, select [Setting] and then click the [Setting.1] tab. Click the button to the right of [Sleep All Targets] then click the [Set] button. -
Page 228: How To Set The Ais Lost Target Alarm Filter
14. AIS TARGET FUNCTIONS 14.9.2 How to set the AIS lost target alarm filter You can select what AIS targets to exclude from the lost target alarm, on the [Setting. 2] page in the [TT/AIS] menu. MAX Range: Set the max. range at which a target must be to be declared a lost target. MIN Ship Speed: Set the minimum ship speed a target must obtain to be declared a lost target. -
Page 229: 14.11 How To Display Ais Target Data
14. AIS TARGET FUNCTIONS Speed selection True vector mode LOG (WT) True-S LOG (BT) True-G POSN True-G True-G True-S MAN w/set & drift True-G Relative vector Relative vectors on targets that are not Vector time moving over the ground such as land, nav- Vector reference igational marks and ships at anchor will represent the reciprocal of own ship's... - Page 230 14. AIS TARGET FUNCTIONS Expanded data Left click an active AIS target. Click the [Expand] button on the [AIS Info] box to show expanded AIS data. Title bar Normal/Expand button MMSI Scroll buttons Vessel name Close button Heading Bearing Range Course over ground Rate of turn Speed over ground...
-
Page 231: 14.12 How To Display Ais Target Past Positions
You can see own ship's data on the [Own Ship] page in the [NAV Status] menu. Open the menu then click both [NAV Status] in the [TT/AIS] menu and the [Own Ship] tab. MMSI: 457804356 Length(LOA): 223.2 m Name: FURUNO Voyager Width: 31.8 m Call Sign: JZ5890312 Ref Bow: 3.3 m... - Page 232 14. AIS TARGET FUNCTIONS This page is intentionally left blank. 14-14...
-
Page 233: Ais Safety, Navtex Messages
15. AIS SAFETY, NAVTEX MESSAGES 15.1 AIS Safety Messages You can send and receive messages via the VHF link, to a specified destination (MMSI) or all AIS-equipped ships within communication range of your ship. Messages can be sent to warn of safety of navigation, for example, an iceberg sighted. Routine messages are also permitted. - Page 234 15. AIS SAFETY, NAVTEX MESSAGES 2. Click the [New] button. 3. At [Send to], select where to send the message. Select [Broadcast] to send the message to all AIS-equipped ships within communication range, or select [MMSI] and enter the MMSI of the ship where to send the message. 4.
-
Page 235: How To Manage Received And Sent Ais Safety Messages
15. AIS SAFETY, NAVTEX MESSAGES 15.1.2 How to manage received and sent AIS safety messages When an AIS message is received, the alert 539 “AIS Message Received” appears. Do the following to view the message. How to display the Message dialog box, view a message Click the [MSG] and [Safety MSG] buttons on the InstantAccess bar. -
Page 236: Navtex Messages
15. AIS SAFETY, NAVTEX MESSAGES 15.2 Navtex Messages Navtex (Navigational Telex) is an international automated medium frequency direct- printing service for delivery of navigational and meteorological warnings and fore- casts, as well as urgent marine safety information to ships. Navtex messages can be received and read in the Voyage navigation mode. 15.2.1 How to receive Navtex messages Do the following to display a NAVTEX message:... -
Page 237: 16. Radar Overlay
The radar overlay has the radar echo image overlaid on the ECDIS chart display, in the Voyage navigation mode. The radar video signal can be fed from a FURUNO radar connected to the ECDIS via LAN, or via the optional Radar Connection Box (RCB- 002) in the case of a FURUNO radar or a non-FURUNO radar. -
Page 238: How To Setup The Radar Overlay
16. RADAR OVERLAY 16.2 How to Setup the Radar Overlay Radar echoes can be output to the ECDIS and shown on its display. Like details on S57 charts, the radar overlay can be displayed or removed from the chart display. The transparency of the echo display can be set from the [Echo] page in the [Overlay/NAV Tools] box. -
Page 239: How To Adjust The Radar Signal Fed From The Radar Connection Box
16. RADAR OVERLAY 16.3 How to Adjust the Radar Signal Fed From the Radar Connection Box Follow the procedure below to set up the radar overlay for the radar connected via the Radar Connection Box. These adjustments are not necessary for the radar which feeds the radar signal via LAN. - Page 240 ECDIS via the Radar Connection Box. Note: For FURUNO radars, it is recommended to use the settings set on the radar in order to match the radar overlay picture with the radar picture.
- Page 241 16. RADAR OVERLAY 1) [Noise Reject] suppresses white noise. 2) [Video Contrast] adjusts the video dynamic range and curve. Refer to the fig- ure below for settings and results. The gain at the center of the signal strength is low, suitable for distinguishing “Standard”...
- Page 242 16. RADAR OVERLAY 6) [Heading Align]: Some positioning error may occur when the antenna unit is installed. This error can be compensated from the ECDIS. Correct bearing (relative to heading) Target Apparent position of target Antenna mounted error Picture appears to port (HDG SW advanced) deviated clockwise.
-
Page 243: Error Between Radar Echo Image And Chart
16. RADAR OVERLAY 16.4 Error Between Radar Echo Image and Chart There are several reasons why the radar echo image and chart display do not match exactly. The mismatch is a combination of several reasons and removing one reason doesn't solve the mismatch perfectly. There is a fundamental difference between the radar echo image and corresponding chart feature. -
Page 244: Error Sources For Radar Echo Image And Tt Mismatch
16. RADAR OVERLAY 16.5 Error Sources for Radar Echo Image and TT Mismatch There are several reasons why the radar echo image and tracked target symbols do not match exactly. 1. Different gyro value at radar overlay and at ECDIS. 2. -
Page 245: 17. Weather Overlay
17. WEATHER OVERLAY 17.1 What is the Weather Overlay? The weather overlay, available in the Voyage navigation and Voyage planning modes, provides an animated display of weather information over time for the area selected. The information may include wave, ocean current, wind, temperature, cloud coverage, and precipitation rate. -
Page 246: How To Select, Playback A Weather Data File
17. WEATHER OVERLAY When the weather overlay is made active, two weather overlay dialog boxes appear, [Weather Overlay Control] and [Weather Overlay]. The [Weather Overlay Control] di- alog box selects and plays back weather data files. The [Weather Overlay] dialog box controls what weather information to display and how to display it. -
Page 247: How To Set Up The Weather Overlay
17. WEATHER OVERLAY 3. Select the weather data file then click the [Open] button. The message "Now Preparing... "appears while the file is being read, and "Now unmounting the media" appears when the reading is completed. The [Weather Overlay Control] dialog box shows the start and end times of the file. If the file is too large, the message "An error occurred. - Page 248 17. WEATHER OVERLAY tion] drop-down list. The choices are [Wind], [Temperature], [Cloud Coverage], [Precipitation Rate], [Wave], and [Ocean Current]. (The weather data file must contain the data selected in order to display it.) 2. The [Color] checkbox, when checked, provides a color presentation of the weath- er item selected.
-
Page 249: Weather Overlay Examples
17. WEATHER OVERLAY 17.5 Weather Overlay Examples 17.5.1 Wind display The wind display provides wind speed and direction. Windbarbs show both wind speed and direction. The relative wind speed is shown in colors, from blue (low) to ma- genta (high). How to read the windbarbs Windbarbs represent both wind speed and direction. -
Page 250: Temperature Display
17. WEATHER OVERLAY 17.5.2 Temperature display The temperature display provides air temperature information, in colors from blue (low) to red (high). The entire area in the figure below has moderately high tempera- tures. 17.5.3 Cloud coverage display The cloud coverage display shows areas obscured by clouds, in transparent (low) to light gray (high). -
Page 251: Waves Display
17. WEATHER OVERLAY 17.5.5 Waves display The waves display shows the average height of the highest waves, in colors from green (low) to red (high). The length of an arrow indicates wave height. The arrow points in the direction of the main swell. Arrow length and wave height (m) Less than 1 Less than 3... -
Page 252: Weather Spot Information
17. WEATHER OVERLAY 17.6 Weather Spot Information You can get various weather information for any area with the weather spot informa- tion feature, in the Voyage navigation and Voyage planning modes. The weather over- lay must be active and position data available. 1. -
Page 253: 18. Navigation Sensors
18. NAVIGATION SENSORS 18.1 CCRS This ECDIS employs a Consistent Common Reference System (CCRS) for the acqui- sition, processing, storage and distribution of sensor information. The CCRS ensures that all parts of the system uses the same source and values, e.g., speed through wa- ter, heading, etc. -
Page 254: How To Select Navigation Sensors
18. NAVIGATION SENSORS 18.2 How to Select Navigation Sensors The operator can choose navigation sensors to use for navigation and view their cur- rent values on the applicable page in the [System Sensor Settings] and [Local Sensor Settings] menus. To access these menus, right-click the [Sensor information] box then click [Open MENU]. - Page 255 18. NAVIGATION SENSORS Reference SPD: If checked, radar is used as the source for speed and course. Check- mark is valid when the speed measurement method is “ground”. Not available with system sensor. Set and drift: Check the [Set Drift] checkbox to manually set speed and course of drift. Note that you can select manual drift only if you deactivate the AIS function.
- Page 256 18. NAVIGATION SENSORS COG/SOG page Select the source (GPS receiver) for speed over the ground and course over the ground. PRIM: FILT FILT Not Available Other sensors page To show the [Other Sensors] page, open the menu and select [Other Sensor Settings]. 130.7m Mid: 130.8m...
-
Page 257: Source Of Position
18. NAVIGATION SENSORS 18.3 Source of Position The figure below shows how source for position is chosen. The position sensors have either primary or secondary as input for their calculation. DGPS position sensors are considered more accurate than other position sensors. The latitude and longitude position is shown at the top-right position on the chart dis- play, and in the example below the position source is DGPS. -
Page 258: Ccrp, Primary, Secondary And Pivot Positions Of Own Ship
18. NAVIGATION SENSORS 18.4 CCRP, Primary, Secondary and Pivot Positions of Own Ship This system displays position in one of four methods • CCRP position: CCRP • Primary position: Position generated by position source chosen as highest priority. • Secondary position: Position generated by position source chosen as 2nd highest priority. -
Page 259: Source Of Navigation Data
18. NAVIGATION SENSORS 18.5 Source of Navigation Data The figure below shows how various sources of navigation data are chosen. "SOG, COG" is speed over the ground and course over the ground, respectively. "SPD" is speed through the water. “Drift” is the difference between speed through the water and speed over ground. - Page 260 18. NAVIGATION SENSORS Speed used by the system is shown at the top-right position on the chart display.The figure below shows the source of water speed is used for drift calculation. Selected and Water Stabilization Manual set drift exists Speed Manual speed Mode Selected Manual...
-
Page 261: Switching Of Sensor And Indication
18. NAVIGATION SENSORS 18.6 Switching of Sensor and Indication When a sensor cannot be used because of some problem, the system automatically switches the sensor. When this occurs the name of the newly selected sensor appears in yellow. Speed sensor changed 18.7 Filter Status... - Page 262 18. NAVIGATION SENSORS Not Available (red): Sensor malfunction or data is improper. Passed (green): Data is available for comparison and data is normal. For heading data, If there is only one gyro, the judgement is “Doubtful” when the ship is stopped because there is no COG for comparison. When the ship begins to move, the judgement is changed to “Passed”...
-
Page 263: Position Alignment
18. NAVIGATION SENSORS SOG/COG data fed from GP0002 is compared with the sensors GP0001 and VD0001. The integrity evaluation for the compared sensors is [Passed]. To unselect a sensor manually, select the sensor from the drop-down list at the bot- tom left corner of the page, click the [Unselect] button then click the [Save] button. -
Page 264: Wind Sensor
18. NAVIGATION SENSORS 18.9 Wind Sensor ECDIS can display and output wind data in the following three formats: Apparent: Windmeter-measured wind speed and direction. Wind angle reference: Heading North: True wind angle, true wind speed, referenced to North Wind angle reference: True North Theoretical: True wind angle, true wind speed, referenced to heading Wind angle reference: Heading The illustration below shows wind speed and direction with given ship data. -
Page 265: 18.10 Depth Sensor
18. NAVIGATION SENSORS Apparent, North (true wind referenced to North), Theoretical (true wind referenced to heading) may be selected from the [Other Sensor Settings] menu. If the wind indica- tion is not accurate; for example, the wind is blowing from the North but the wind di- rection displays otherwise, check if the format is Theoretical. - Page 266 18. NAVIGATION SENSORS This page is intentionally left blank. 18-14...
-
Page 267: Recording, Playback Functions
19. RECORDING, PLAYBACK FUNC- TIONS The ECDIS records various items during a voyage, like movement and position of your ship and dangerous radar targets (from the radar). These items are recorded in the following logs: Event log: Records user events and position events. NAV log: Records entire voyage (i.e., a sailing of a route from first point to the last, also MOB data), details (position, speed and course every minute), chart usage (information on... -
Page 268: Position Events
19. RECORDING, PLAYBACK FUNCTIONS 19.1.2 Position events The purpose of a position event is to record current position data to the [Voyage] log. Position events can be shown in the chart area by checking [Positions] on the [Track- ing] page of the [Symbol Display] menu. Do as shown below to record position events. How to record position events 1. - Page 269 19. RECORDING, PLAYBACK FUNCTIONS 5. If you selected [Manual] at step 3, enter latitude and longitude position and com- ment (optional), then click the [Record] button. Manually entered Enter comment position here. The [Position Event] window shows the position at 1044 the moment the [Record] button is clicked.
- Page 270 19. RECORDING, PLAYBACK FUNCTIONS timestamp on the chart. The method of transfer may be selected in the bottom of the dialog. Transfer to latest transfers the measurements as if they were all made at the time of the newest measurement. Continuous transfer transfers all measurements to real time.
-
Page 271: Details Log
19. RECORDING, PLAYBACK FUNCTIONS 19.2 Details Log The [Details] log contains various voyage information, recorded once per minute. • Date of entry • Time of entry • Source: No. of unit which generated log • Type: Type of position data •... -
Page 272: Voyage Log
19. RECORDING, PLAYBACK FUNCTIONS 19.3 Voyage Log The [Voyage] log records all voyage-related data of the past three months. Recorded events are: • Date: Date of entry • Time: Time of entry • Type: Log entry types • Auto: Automatic entry of ship position, in 1 to 4 hr intervals, set by operator. •... -
Page 273: How To Set Conditions For Voyage Logging
19. RECORDING, PLAYBACK FUNCTIONS How to view the Voyage log Click the [Record], [NAV Log] and [Voyage] buttons on the InstantAccess bar. Export File • To show the logs of a specific period, enter the period to show with [Period Cov- ered (UTC)] then click the [Set Period] button. - Page 274 19. RECORDING, PLAYBACK FUNCTIONS Course: 0 - 30°, 0.1° increment Log Interval: 1 - 4 hr, 1 hr interval 19-8...
-
Page 275: Chart Usage Log
19. RECORDING, PLAYBACK FUNCTIONS 19.4 Chart Usage Log The [Chart Usage] log stores which charts were used on the ECDIS display. To open the log, click [Record], [NAV Log] and [Chart Usage] on the InstantAccess bar. The following information is recorded in the chart usage log: •... -
Page 276: Danger Targets Log
19. RECORDING, PLAYBACK FUNCTIONS 19.5 Danger Targets Log The [Danger Targets] log stores information about dangerous targets that are re- ceived from a radar (TTs) and/or targets that are received from an AIS transponder (AIS targets). If a TT or AIS target is within the set CPA (Closest Point of Approach) and TCPA (Time to CPA), information of all TTs (including non-dangerous targets) are recorded into the danger target log. -
Page 277: How To Set The Conditions For Logging Danger Targets
19. RECORDING, PLAYBACK FUNCTIONS 19.5.1 How to set the conditions for logging danger targets The operator may set Closest Point of Approach (CPA), Time to CPA (TCPA) and Log interval for viewing dangerous TT and AIS targets on the ECDIS display. 1. -
Page 278: How To Playback The Log
19. RECORDING, PLAYBACK FUNCTIONS 19.6 How to Playback the Log The log can be played back to check ship’s movements within a given time frame. If an AMS is connected, deactivate it to enable playback. 1. On the Status bar, click the [OTHERS] and [Playback] buttons. The message "If you use playback function, you cannot use other function before ECDIS restarts."... - Page 279 19. RECORDING, PLAYBACK FUNCTIONS • The [Select] button selects a file. Playback is stopped and a message asks if you are sure to select a different file. 14:46 05 Mar 2014 14:54 05 Mar 2014 Select button (Select different file to playback.) Time 05 Mar 2014 elapsed...
- Page 280 19. RECORDING, PLAYBACK FUNCTIONS This page is intentionally left blank. 19-14...
-
Page 281: 20. Alerts
20. ALERTS 20.1 What is an Alert? "Alert" is a generic name for a notice to any unusual or potentially dangerous situation generated within the system. Alerts are classified according to priority and category. Alert priority There are four alert priorities: emergency*, alarm, warning and caution. * Generated when this ECDIS is connected to an AMS. -
Page 282: Alert Box
20. ALERTS 20.2 Alert Box When an alert is generated, the related alert message and alert state icon appear in the [Alert] box, which is at the bottom right corner on the screen. An audible alarm is additionally generated for emergencies, alarms and warnings. In addition to the alert message and alert state icon, the [Alert] box has the buzzer stop button and provides access to the [Alert List] and [Alert Log]. - Page 283 20. ALERTS Alert message display format Priority of Alert indication Display state Alert state alert Emergency, - Not acknowledged, Not rectified. Black characters on red Alarm background. Sensor Failure - Not acknowledged, Rectified. Not acknowledged: flashes every 0.5 s. Acknowledged: 3 s Displayed on;...
- Page 284 20. ALERTS Alert state icons The table shows the icons used to indicate the different alert states for the emergency, alarm, warning and caution alerts. Icon Alert state Icon description Alert priority: Emergency, Alarm Not acknowledged, Not rectified Red triangle with black loudspeaker in center of Flashing every 0.5 s.
-
Page 285: How To Temporarily Silence The Buzzer For An Alarm Or Warning
20. ALERTS 20.3 How to Temporarily Silence the Buzzer for an Alarm or Warning When the buzzer for an alarm or warning sounds, you can temporarily silence it by do- ing one of the following: • Click the buzzer stop button in the [Alert] box. •... -
Page 286: Alert List
20. ALERTS Category of alert and place of alert acknowledgement The place of alert acknowledgement depends on the category of the alert. Place of alert Category Where the alert is generated acknowledgement Equipment that generated the alert. Equipment that generated the alert. Equipment and AMS* (Alert Manage- Equipment that generated the alert or ment System) *No use... - Page 287 20. ALERTS The [Filter] checkboxes at the top of the window let you select what alerts to view. Check or uncheck the boxes to show or hide the corresponding alerts. To find details about an alert, click the applicable alert info icon at the left side of the window to show the details in the [Detail] box at the top of the window.
-
Page 288: Alert Log
20. ALERTS 20.6 Alert Log The [Alert Log] stores and displays the latest 10,000 alerts. To display the log, right- click the [Alert List/Alert Log] button then select [Alert Log Window]. The log shows the following information for each alert: •... -
Page 289: List Of Alerts
20. ALERTS 20.8 List of Alerts Below is a list of all available alerts and their default priorities. The priority of Alerts 620 to 638 can be switched between Caution and Warning on the [Chart Alert] page. See section 8.1.2. For a detailed Alert list, including remedies, see Appendix 5. Default Text priority... - Page 290 20. ALERTS Default Text priority EC-3000 CPU Board Temp High Caution EC-3000 Remote 1 Temp High Caution EC-3000 Remote 2 Temp High Caution EC-3000 CPU Fan Rotation Speed Lowering Caution EC-3000 Fan1 Rotation Speed Lowering Caution EC-3000 Fan2 Rotation Speed Lowering Caution EC-3000 CPU Fan No Rotation Warning...
- Page 291 20. ALERTS Default Text priority SDME 1 COM Error Caution SDME 2 COM Error Caution SDME 3 COM Error Caution SOG Not Available Warning Heading Magnetic Not Available Caution EPFS 1 COM Error Caution EPFS 2 COM Error Caution EPFS 3 COM Error Caution EPFS 4 COM Error Caution...
- Page 292 20. ALERTS Default Text priority NAVTEX COM Error Caution ROT Gyro 1 COM Error Caution ROT Gyro 2 COM Error Caution ROT Gyro 3 COM Error Caution Network Printer Not Available Caution Local Printer Not Available Caution Other Sensor 11 COM Error Caution Other Sensor 12 COM Error Caution...
- Page 293 20. ALERTS Default Text priority AIS Lost Warning AIS Message Received Caution AIS Message Transmit Error Caution AIS Transmitting Caution No CPA/TCPA for AIS Warning User Chart Danger Area Warning Traffic Separation Zone Warning Inshore Traffic Zone Warning Restricted Area Warning Caution Area Warning...
- Page 294 20. ALERTS Default Text priority Gyro 1 Sensor Banned Caution Gyro 2 Sensor Banned Caution Gyro 3 Sensor Banned Caution Gyro 4 Sensor Banned Caution Gyro 5 Sensor Banned Caution ROT Gyro 1 Sensor Banned Caution ROT Gyro 2 Sensor Banned Caution ROT Gyro 3 Sensor Banned Caution...
-
Page 295: 21. Parameters
21. PARAMETERS 21.1 Ship and Route Parameters The purpose of the ship and route parameters is set the basic parameters for the ship. These parameters are relative to ship steering and they are very important to get cor- rect function of the integrated navigation system. They must be maintained carefully. Modification requires a good knowledge of the parameters' importance. -
Page 296: Forwarding Distances
However, the operator can view the forwarding distances settings on the [For- warding Distance] display ([MENU]→[General]→[Navigation Parameter]). Note: These are the port side values. Starboard side values can also be shown. Con- tact a FURUNO dealer for details. 21-2... -
Page 297: Cost Parameters
21. PARAMETERS 21.3 Cost Parameters The cost parameters are used in the optimization calculation. Therefore define these parameters before doing the calculation. Open the menu and select [Cost Parameters] from the [General] menu to show the [Cost Parameters] page. Set each item according to ship’s plan, etc. At the [Cost] window, enter the cost/hour and cost/ton for heavy fuel oil and diesel oil. -
Page 298: Instant Track Parameters
21. PARAMETERS 21.4 Instant Track Parameters The instant track feature can create, in route monitoring, a simple route in the following situations: • Return to the monitored route when the vessel goes outside the channel limits. • Temporarily deviate from the monitored route (avoid collision, etc.). How to set instant track parameters Set the parameters for the instant track ([MENU]→[General]→[Ship &... -
Page 299: 22. Conning Displays
22. CONNING DISPLAYS 22.1 Main Conning Display The main conning display provides relevant sensor information data (including engine data) from external equipment, on one display to facilitate safe and efficient monitor- ing. The ECDIS accepts sensor information data in analog, serial and contact signal formats. - Page 300 Selects a display palette. See section 1.7. Adjusts the brilliance of a FURUNO or Hatteland monitor. See section 1.8. Takes a screenshot. See section 1.14. Displays system information and the Operator’s Manual. Conning informa- tion appears in the Version tab.
- Page 301 22. CONNING DISPLAYS Conning display examples Six conning display sheets are available, and the content, layout and name of each sheet can be customized, by the service technician. Below are some examples con- ning display sheets. Example 1 (General navigation) Example 2 (General navigation) 22-3...
- Page 302 22. CONNING DISPLAYS Example 3 (General navigation) Example 4 (General Navigation) 22-4...
- Page 303 22. CONNING DISPLAYS Example 5 (All waters, navigation) Example 6 (All waters, harbor) 22-5...
- Page 304 22. CONNING DISPLAYS Example 7 (Ocean, navigation) Example 8 (Ocean, harbor) 22-6...
- Page 305 22. CONNING DISPLAYS Example 9 (Offshore Service Vessel, Fore 1) Example 10 (Offshore Service Vessel, Fore 2) 22-7...
- Page 306 22. CONNING DISPLAYS Example 11 (Offshore Service Vessel, Aft1) Example 12 (Offshore Service Vessel, Aft2) 22-8...
-
Page 307: Mini Conning Display
22. CONNING DISPLAYS 22.2 Mini Conning Display The mini conning display, available in the Voyage navigation mode, provides various navigation information and is set during the installation. The display example below shows heading, doppler log speed and rudder angle. To show or hide the mini conning display, click the [Mini Conning] button on the InstantAccess bar. -
Page 308: Side Conning Display (Landscape Monitor Only)
22. CONNING DISPLAYS 22.3 Side Conning Display (landscape monitor only) With the landscape monitor, the side conning display can be shown in the information area, in the radar mode. The presence or absence of the display is determined during the installation. Four side conning sheets are preset during the installation according to expected us- age, possible navigation conditions, etc. -
Page 309: 23. Settings Menu
23. SETTINGS MENU The [Settings] menu provides file import, export and maintenance, testing facilities (display, keyboard, self test), data sharing, customizing, screenshot processing, user default restoration, and CCRP selection. 23.1 How to Access the Settings Menu Click the Settings button ( ) on the Sta- tus bar then select [Settings]. -
Page 310: File Export
23. SETTINGS MENU 23.2 File Export The [File Export] page exports setting data, route/user charts, and playback data*, to a USB flash memory. Data is exported in .zip files. * Disable AMS to enable export. Db export: Execute Playback data Name Description Data selection... -
Page 311: File Import
23. SETTINGS MENU 23.3 File Import The [File Import] page lets you import FMD-3xx0 series created setting data, routes/ user charts, and playback data*, from a USB flash memory. .*Disable AMS to enable import. Playback data Name Description Select file to import Click to show the [OPEN FILE] dialog box, where you can button select the file to import. -
Page 312: File Maintenance
23. SETTINGS MENU 23.4 File Maintenance The [File Maintenance] page lets you restore the last-saved route/user chart applica- tion and Route/user chart system. Name Description Route/User chart Check to restore last-saved route/user chart application. Application backup Route/User chart Check to restore last-saved route/user chart system. System backup [Restore] button Click to restore item selected. -
Page 313: Self Test
23. SETTINGS MENU 23.5 Self Test The [Self Test] page is mainly for use by the service technician to check the equip- ment. The ECDIS function is inoperative during the test. Function: ecdis,conning,tcs,ams Name Description Test results, pro- The results of the self test and the program numbers. gram numbers (Program numbers subject to change.) [Start] button... -
Page 314: Data Sharing
23. SETTINGS MENU 23.6 Data Sharing The [Data Sharing] page shares the same brilliance setting between main and slave displays (ECDIS and conning applications). Data Sharing Please check items to share between all applications. Display Settings Display Brilliance 23-6... -
Page 315: Customize
23. SETTINGS MENU 23.7 Customize The [Customize] page lets you set buzzer volume, key beep volume, and scrollwheel rotation direction. File Maintenance Self Test Data Sharing Name Description Wheel rotation Set the direction of scrollwheel rotation direction. Normal: Downward to increase value, upward to decrease value. -
Page 316: Display Test
23. SETTINGS MENU 23.8 Display Test The [Display Test] page displays various test patterns to check the FURUNO-supplied monitor for proper display of colors. Click the [Display Test] button to start the test. The buzzer sounds at the start of the test. -
Page 317: Keyboard Test
23. SETTINGS MENU 23.9 Keyboard Test The [Keyboard Test] page checks the controls and keys on the ECDIS Control Unit and the trackball module on the ECDIS Control Unit and Trackball Control Unit. Data Sharing Customize Display Test Keyboard Test Name Description EBL, BRILL, GAIN and... - Page 318 23. SETTINGS MENU Name Description Trackball module Check the trackball module of a Control Unit: 1) Spin the scrollwheel and rotate the track- ball. The indication above the operated control shows the setting value. 2) Push each button. The window above a pushed button lights in light blue.
-
Page 319: 23.10 Screenshots
23. SETTINGS MENU 23.10 Screenshots The [Screenshot] page processes screenshots saved to the SSD. Name Description List List of screenshots taken. Screenshots are automatically assigned a file name consisting of the time and date the screenshot was taken. Check boxes Put a checkmark in the box of the screenshot to process. -
Page 320: 1How To Export Screenshots
23. SETTINGS MENU 23.10.1 How to export screenshots You can export screenshots to a USB flash memory as follows: 1. Insert a USB flash memory in the USB port on the Control Unit. 2. Open the [Screenshot] page. 3. Put a checkmark in the checkbox of the screenshot(s) to export. 4. -
Page 321: 23.11 User Default
23. SETTINGS MENU 23.11 User Default The [User Default] page restores all default settings for the [Chart Display] and [Sym- bol Display]. Click the [Restore User Setting] button. You are asked "All setting data will be restored to the default. Do you wish to continue?" appears. Click the [Yes] but- ton to restore default settings and reset the power. -
Page 322: 23.12 Ccrp
23. SETTINGS MENU 23.12 CCRP The [CCRP] page provides for selection of CCRP (Consistent Common Reference Point) and shows the location of various sensors. Name Description CCRP Select the CCRP to use in the case of multiple CCRPs. Display Filter Check the items to show on the ship’s graphic. -
Page 323: Maintenance And Troubleshooting
24. MAINTENANCE AND TROUBLE- SHOOTING Periodic checks and maintenance are important for proper operation of any electronic system. This chapter contains maintenance and troubleshooting instructions to keep optimum performance and the longest possible life of the equipment. Before attempt- ing any maintenance or troubleshooting procedure please review the safety informa- tion below. -
Page 324: How To Replace The Fuse
24. MAINTENANCE AND TROUBLESHOOTING 24.2 How to Replace the Fuse The fuse in the Processor Unit, Monitor Unit and Sensor Adapter protects those units from overvoltage (overcurrent) and internal fault. If a unit cannot be turned on, check if its fuse has blown. If a fuse has blown, find out the cause before replacing the fuse. If the fuse blows again after replacement, contact your dealer for advice. -
Page 325: Trackball Maintenance
24. MAINTENANCE AND TROUBLESHOOTING 24.3 Trackball Maintenance If the cursor moves abnormally, dust or dirt may be on the trackball. Clean the trackball as shown below: 1. Turn the retaining ring on the trackball module counterclockwise 45° to unlock it. Retaining ring 2. -
Page 326: Troubleshooting
“There is • dongle is not connected. • Connect dongle. no dongle or an error • data in the dongle is corrupted. • Contact FURUNO for assistance. has occurred in the dongle. The system will automatically shut down.” appears monitored route is •... - Page 327 24. MAINTENANCE AND TROUBLESHOOTING If… then… Remedy S57 chart cannot be • no ENC chart for area. • Open S57 chart from [Manage displayed Charts] dialog box. • dongle is not connected. • Connect dongle. past track is not • past track is not selected to be vis- •...
-
Page 328: Consumable Parts
24. MAINTENANCE AND TROUBLESHOOTING 24.6 Consumable Parts The table below lists the consumable parts in the Processor Unit, Sensor Adapters and Monitor Units. Replace the parts before their expected expirations. Unit Part Type Life Processor Unit CPU Fan KTA-555-01 8.5 years EC-3000 Power Fan 109P0612H761... -
Page 329: Color Differentiation Test For S57 Charts
24. MAINTENANCE AND TROUBLESHOOTING 24.7 Color Differentiation Test for S57 Charts The color differentiation checks if the ECDIS monitor can distinguish between the var- ious color-coded areas, lines and symbols. 1. Click the [Chart INFO] and [Chart 1] buttons on the InstantAccess bar to show the [ECDIS Chart 1] menu. - Page 330 24. MAINTENANCE AND TROUBLESHOOTING This page is intentionally left blank. 24-8...
-
Page 331: Alert Management System(Option)
25. ALERT MANAGEMENT SYSTEM (option) 25.1 What is an Alert Management System (AMS)? An AMS warns the navigator, with audio-visual indications, when safety parameters are violated or there is a failure of connected equipment. The AMS also transfers un- acknowledged alerts to the BNWAS. The main functions of the AMS are •... - Page 332 25. ALERT MANAGEMENT SYSTEM (option) Category of alerts Each alert is further put into the category A or category B. Category Description of alert Category A Category A alerts include alerts indicating • Danger of collision • Danger of grounding Category B Category B alerts are alerts where no additional information for decision support is necessary besides the information that is shown at the central...
-
Page 333: Alert Category And Alert Acknowledgement From Connected Equipment, Ams
25. ALERT MANAGEMENT SYSTEM (option) 25.4 Alert Category and Alert acknowledgement From Connected Equipment, AMS Category A alert Acknowledged from the equipment that generated the alert: The alert is acknowl- edged at both the equipment and the AMS and their buzzers stop. Acknowledged from the AMS: The alert is acknowledged at neither the equipment that generated the alert nor the AMS, however their buzzers stop. - Page 334 25. ALERT MANAGEMENT SYSTEM (option) Device states A sensor has two main states, N and A. State N: No active alerts. The device should send a "no-alerts" message with an in- terval of a maximum of 60 seconds. This message informs the AMS that the sensor has no active alerts.
-
Page 335: How An Alert Is Transferred To The Bnwas
25. ALERT MANAGEMENT SYSTEM (option) 25.7 How an Alert is Transferred to the BNWAS Alerts are transferred to the BNWAS in the following sequence. Note: For a DNV class vessel, only category A alerts are transferred. 1) An alert generated by an equipment connected to the AMS is transferred to the BNWAS if it is not acknowledged within 30 seconds. -
Page 336: Change Of Priority For Unacknowledged Warning
25. ALERT MANAGEMENT SYSTEM (option) 25.8 Change of Priority for Unacknowledged Warning IMO MSC302(87) requires that a Warning be changed to an Alarm if it is not acknowl- edged within 60 seconds. The change of priority feature is enabled or disabled during the installation. -
Page 337: 25.11 Alert Priority, Alert State
25. ALERT MANAGEMENT SYSTEM (option) IEC 61924-2 buzzer pattern This buzzer complies with INS regulations. There are two types of buzzer patterns, Emergency/Alarm and Warning. Emergency/Alarm: The buzzer sounds three times in 7-second intervals. Emergency/Alarm generated. 7 seconds Buzzer ON Buzzer muted Time Buzzer OFF... -
Page 338: 25.12 Alert Icons
25. ALERT MANAGEMENT SYSTEM (option) 25.12 Alert Icons The alert icons show the state of all alerts. Icon Alert state Icon description Alert priority: Emergency, Alarm Not acknowledged/Not rectified Red triangle with black loudspeaker in center of triangle. Flashing every 0.5 s. Not acknowledged/Not rectified Red triangle with crossed out black loudspeaker Buzzer temporarily silenced... -
Page 339: 25.13 Ams Mode Operations
25. ALERT MANAGEMENT SYSTEM (option) 25.13 AMS Mode Operations 25.13.1 How to select the AMS mode Select [AMS] with the Display mode button (the leftmost button on the Status bar) to activate the AMS mode. The configuration of the button depends on the monitor con- figuration. -
Page 340: 2Ams Mode Windows
25. ALERT MANAGEMENT SYSTEM (option) 25.13.2 AMS mode windows The AMS mode shows alert information in three windows: [ACTIVE ALERT], [ALERT LOG] and [ALERT LIST]. The windows can be selected with the corresponding but- tons on the Status bar. Alerts can be acknowledged from any window, by clicking the alert. - Page 341 25. ALERT MANAGEMENT SYSTEM (option) Item name Description Priority Filter Filter the list by alert priority, [Emergency], [Alarm], [Warning], [Caution]. Source Filter Filter the list by the source of the alert, [Navigation], [Communi- cation], [External]. Category Filter Filter the list by category, A, B or C. Decision Support box Displays the reason for an alert and troubleshooting tip when an information icon is clicked.
- Page 342 25. ALERT MANAGEMENT SYSTEM (option) ALERT LOG window The [ALERT LOG] window provides a comprehensive list of generated alerts. Item name Description Current Alert box This box shows the name of the active alert that has the highest priority. You can acknowledge the alert by clicking the box. Priority Filter Filter the list by the alert priority, [Emergency].
- Page 343 25. ALERT MANAGEMENT SYSTEM (option) ALERT LIST window The [ALERT LIST] window provides a context-based list of generated alerts, by source and priority. Item name Description Current Alert box This box shows the name of the active alert(s), in order of pri- ority.
- Page 344 25. ALERT MANAGEMENT SYSTEM (option) This page is intentionally left blank. 25-14...
-
Page 345: 26. Autopilot Operations
26. AUTOPILOT OPERATIONS This chapter covers the type approval testing for the following autopilots: • Type Approval TC-3000: YOKOGAWA PT-500A, TOKYO KEIKI PR-6000, EMRI FAP-2000, EMRI FAP-3000. (These Autopilots comply with IEC 62065 Ed.1.0.) • Type Approval TC-3001: TOKYO KEIKI PR-9000. (This Autopilot complies with IEC 62065 Ed. -
Page 346: Controls
26. AUTOPILOT OPERATIONS 26.2 Controls This section provides a brief description of the autopilot controls used with the ECDIS. For detailed information, see the autopilot’s operator’s manual. 26.2.1 EMRI FAP-2000 Control Panel FURUNO GYRO ALARM LIGHT MEDIUM RESET LOADED MANUAL... - Page 347 26. AUTOPILOT OPERATIONS Status indicator - Shows selected mode and state of readiness: • ROUTE: FAP-2000 route steering • TRACK: FAP-2000 control mode • TURN: FAP-2000 track controlled turn • HEADING: FAP-2000 control mode • READY: FAP-2000 in operation Alert indicator and buzzer control: •...
-
Page 348: Emri Fap-3000
26. AUTOPILOT OPERATIONS 26.2.2 EMRI FAP-3000 Steering Control Unit Description PROGRAM NEXT button: Shows next heading, next course, next radius, next rudder limit field. CALL REMOTE CTRL button: Initiates integrated control with external navigation equipment (ECDIS, etc.) CALL COURSE CTRL button: Heading-controlled course change using set radius CALL HEADING CTRL button: Immediate heading-controlled course change using set rud- der angle limit. -
Page 349: Tokyo Keiki Pr-6000
26. AUTOPILOT OPERATIONS 26.2.3 TOKYO KEIKI PR-6000 Steering Control Unit Control Control Mode selection unit Repeater switch Mode selection switch Helm unit Non-follow-up unit Steering wheel Non-follow-up steering lever System selection unit Auto steering control knobs System selection switch HCS unit (see next page) Order rudder angle indicator Course setting knob PS display lamps... - Page 350 26. AUTOPILOT OPERATIONS Bar graph Steering Power System selection Bar graph display Data selection mode indicator indicator indicator indicator Data display Data display indicator No.1 AUTO SET COURSE Group display alarm Rudder limit indicator angle indicator Individual HCS Unit alarm indicator ◄SEL switch CHANGE switch...
- Page 351 26. AUTOPILOT OPERATIONS PILOT WATCH control: Set the amount of course deviation to allow in automatic steering. An alert is generated at the Autopilot when the deviation is more than the val- ue set. RUDDER LIMIT control: Limit the rudder motion to the least necessary rudder angle during AUTO steering.
- Page 352 26. AUTOPILOT OPERATIONS FU Override NFU Controller Starting steering override: 1) Confirm that the Ready lamp in the NFU controller is ON. Override steering 2) Pull out the pin stopper inserted lever in the override NFU controller and turn the lever to the desired direction.
-
Page 353: Tokyo Keiki Pr-9000
26. AUTOPILOT OPERATIONS 26.2.4 TOKYO KEIKI PR-9000 Heading Control Unit (HCU) Description ALARM lamp: Flashes (red) or lights when the HCU receives an alarm. POWER lamp: Lights (green) when the HCU starts. HDG key: Selects the heading sensor used for steering. TC/HC key: Switches between the TC and HC modes, in automatic steering. -
Page 354: Yokogawa Pt-500A
26. AUTOPILOT OPERATIONS 26.2.5 YOKOGAWA PT-500A Steering Control Unit RUDDER RATE ENTER RADIUS LIMIT Auto Steering Unit Description Steering Repeater Compass: Shows heading. Auto Steering Unit: Provides controls for automatic steering functions. Steering Mode Selector: Select NAVI, AUTO, HAND, or RC (Remote Control) steering mode. Non-Follow-Up Steering Lever: Steers the rudder in the direction selected, port or starboard. -
Page 355: Steering Modes
26. AUTOPILOT OPERATIONS 26.3 Steering Modes 26.3.1 EMRI FAP-2000, FAP-3000 The FAP-2000, FAP-3000 receives position, heading and speed data, compares them with the track section to be steered, and applies that information to calculate and com- mand the necessary rudder angle. Hand (manual) steering modes The following hand steering modes are available without the autopilot: Steering wheel, Wing steering control, and Override tiller. -
Page 356: Tokyo Keiki Pr-6000
26. AUTOPILOT OPERATIONS 26.3.2 TOKYO KEIKI PR-6000 Steering functions are available when the ECDIS system is connected to the Autopilot. To use a steering mode, set your Autopilot’s system selection switch to the No.1 po- sition. Hand (manual) steering mode (Steering mode setting: HAND) Set the Mode Selection switch to HAND. - Page 357 26. AUTOPILOT OPERATIONS To start the route steering mode, do the following: 1. Select [GoSea] or [GoAW] with the TCS button on the InstantAccess bar of the ECDIS 2. Set the Mode Selection switch on the Steering Control Unit to RC. 3.
-
Page 358: Yokogawa Pt-500A
26. AUTOPILOT OPERATIONS 26.3.3 YOKOGAWA PT-500A Steering functions are available when the ECDIS system is connected to the Autopilot. To use a steering mode, set your Autopilot’s system selection switch to the FU-1 po- sition. Hand (manual) steering mode (Steering mode setting: HAND) Set the Steering Mode Selector switch to HAND. - Page 359 26. AUTOPILOT OPERATIONS 1. Select [GoSea] or [GoAW] with the TCS button on the InstantAccess bar of the ECDIS. 2. Set the Switch Unit position switch on the Switch Unit to NAVI to start TCS. Non-follow-up steering mode (System setting: NFU) The operator sets the steering mode selector to NFU with the System Selector switch and steers with the Non-Follow-Up steering lever.
-
Page 360: Tokyo Keiki Pr-9000
26. AUTOPILOT OPERATIONS 26.3.4 TOKYO KEIKI PR-9000 The PR-9000 receives position, heading and speed data, compares them with the track section to be steered, and applies that information to calculate and command the necessary rudder angle. Hand (manual) steering mode Manual steering by UID (User Input Device). -
Page 361: Track Control Functions At The Ecdis
26. AUTOPILOT OPERATIONS 26.4 Track Control Functions at the ECDIS Track control functions are available in the Voyage navigation mode. Click the [NAVI] button to get into this mode. [Track Control Status] Preconditions for Track Control Start are missing: AP connection error. Instant Track MANUAL... -
Page 362: How To Select The Ecdis To Control The Autopilot
26. AUTOPILOT OPERATIONS 26.5 How to Select the ECDIS to Control the Autopilot If the ship has more than one ECDIS, you can select the ECDIS to control the Autopi- lot. The ECDIS are connected to the Autopilot via a hardware switch to permit manual switching of the ECDIS. -
Page 363: How To Activate, Deactivate The Track Control System (Tcs) From The Ecdis
26. AUTOPILOT OPERATIONS 26.6 How to Activate, Deactivate the Track Control System (TCS) from the ECDIS 26.6.1 How to activate the TCS The TCS cannot be activated if the route steering preconditions have not been met. A related alert and status message appear on the ECDIS. See section 26.7.2 for the status messages. -
Page 364: Route Steering Related Indications, Alerts And Messages Generated By Ecdis
26. AUTOPILOT OPERATIONS 26.7 Route Steering Related Indications, Alerts and Messages Generated by ECDIS 26.7.1 Route steering related information in Route Information box The [TC] field in the [Route Information] box shows the route steering related informa- tion. See the table below for f the indications that appear in the box. GoAW Appr. -
Page 365: Alerts And Messages When Precondition For Route Steering Are Not Complete
26. AUTOPILOT OPERATIONS 26.7.2 Alerts and messages when precondition for route steering are not complete When you select the GoAW mode or SEA mode and change the steering mode to route steering mode at the Autopilot to activate the route steering, but route steering preconditions are not complete, an alert and a message are given. - Page 366 26. AUTOPILOT OPERATIONS Messages The message in the [Track Control Status] window (at the top of the display) states the reason why the preconditions for the start of track control are not complete. [Track Control Status] Preconditions for Track Control Start are missing: AP connection error.
-
Page 367: Other Route Steering Indications And Alerts
26. AUTOPILOT OPERATIONS 26.7.3 Other route steering indications and alerts Route steering indications in the Route Information box Permanent alerts appear in the [Route Information] box in red in any steering mode. In the example below the [Off Track] value is shown in red when the vessel is outside the channel. -
Page 368: Alerts Given When Approaching A Waypoint
26. AUTOPILOT OPERATIONS 26.8 Alerts Given When Approaching a Waypoint 26.8.1 Track Control System (TCS) testing standard and Autopilot There are two TCS testing standards, IEC 62065 Ed. 1.0 and IEC 62065 Ed. 2.0. The Autopilots that can be connected to this ECDIS conform to the following TCS stan- dards: Ed. - Page 369 26. AUTOPILOT OPERATIONS 90 sec. 30 sec. 30 sec. before WOL before WOL after WOL No ACK No ACK No ACK (1) ECCI (2) CCA (3) Backup released released navigator alarm released IEC 62065 Ed. 2.0 1. The vessel’s position is 240 seconds from the WOL. 2.
- Page 370 26. AUTOPILOT OPERATIONS 6. The CCI is not acknowledged. 7. When the vessel passes the WOL, the ECDIS releases the Course Change Alarm (CCA), which is the Alert "152 Wheel Over Line". 8. The CCA is not acknowledged. 9. 30 seconds after the vessel passes the WOL, the ECDIS outputs the Backup Nav- igator Alarm (contact signal, N/O or N/C) to the BNWAS.
-
Page 371: About The Backup Navigator Alarm
26. AUTOPILOT OPERATIONS 26.8.3 About the Backup Navigator Alarm The Backup Navigator Alarm alerts the bridge to an unacknowledged alarm by trans- ferring the alarm within the TCS to the BNWAS. For unacknowledged alarms that require output of the Backup Navigator Alarm, the TCS sends the Backup Navigator Alarm to the BNWAS. -
Page 372: Route Steering Operations
26. AUTOPILOT OPERATIONS 26.9 Route Steering Operations 26.9.1 How to stop or change a pre-enabled turn in route steering There are two conditions where an automatic turn in a route must be stopped or changed: • The turn cannot be done to the last value. •... -
Page 373: Collision Avoidance Maneuver In Route Steering
26. AUTOPILOT OPERATIONS 26.9.2 Collision avoidance maneuver in route steering Route steering is often interrupted by a collision avoidance maneuver, but there are also several other reasons to interrupt route steering. There are several possibilities to set the collision avoidance or any other maneuver: •... -
Page 374: 2Expected Steering Performance For Turns
26. AUTOPILOT OPERATIONS * The Track Control System can compensate drift up to 45 degrees. If the drift is larger, your ship may go outside the channel limit. 26.10.2 Expected steering performance for turns Mode GoSea (FAP-2000/3000) GoAW (FAP-2000/3000) Environmental Heading control= GoSea+RC (PR-6000 GoAW+RC (PR-6000) -
Page 375: 3Expected Steering Performance Under Critical Failure
26. AUTOPILOT OPERATIONS 26.10.3 Expected steering performance under critical failure Below is a summary of the system behavior in different failures in the GoSEA or GoAW steering mode. Lost heading to Autopilot and/or ECDIS Related Expected system Operator alerts performance action Immediately •... - Page 376 26. AUTOPILOT OPERATIONS Lost speed (IEC 62065 Ed. 1) Associated Expected system Operator alerts performance action • Speed log data, VTG • Acknowledge alerts. sentence lost. Alert • Monitor situation. "901 No FIlter Source of COG/SOG", Alert "902 No Filter Source of CTW/STW"...
- Page 377 26. AUTOPILOT OPERATIONS Low speed Associated Expected system Operator alerts performance action • Alert "159 Low Speed • Acknowledge alerts. Alarm". • Monitor situation. Lost communication between Autopilot and ECDIS and vice versa Associated Expected system Operator alerts performance action Within 15 •...
-
Page 378: 4When Track Control Is Stopped
26. AUTOPILOT OPERATIONS Total lost position (position from ALL GPS navigators is unreliable) Associated Expected system Operator alerts performance action • Alert "290 EPFS1 COM • Acknowledge alerts. Error" (example). • Monitor situation. • The Kalman filter de- tects position jump, etc. Within 30 •... -
Page 379: Appendix 1 Menu Tree
APPENDIX 1 MENU TREE Main Menu General Ship Ship & Ship & Route MENU MAX Speed (0.1 to 80 kn, 22.1) Route Parameters MAX Height (0.0 to 100 m, 16.1) (click) MAX Draught (0.0 to 50 m, 20.0) Route MAX R.O.T* * Set at installation WPT Approach* WPT Prewarning*... - Page 380 APPENDIX 1 MENU TREE (Con’t from previous page) DISP Basic Symbols (Paper Chart, Simplified) Depths (Two Color, Multi Color) Setting Boundaries (Plain, Symbolized) Lightsectors (Limited, Full) Light Popup (OFF, ON) TM Reset (20-99%, 80) Shallow Pattern (None, Diamond) Shallow Hazard (ON, OFF) Chart Standard (Checkbox for each of Unknown Object or Presentation;...
- Page 381 APPENDIX 1 MENU TREE (Con’t from previous page) Chart Set WARNING or CAUTION for Safety Contour*, Areas To Be Avoided, Alert User Chart Danger, Traffic Separation Zone, Inshore Traffic Zone, Restricted Area, Caution Area, Offshore Production Area, Military Setting Practice Area, Seaplane Landing Area, Submarine Transit Lane, Anchorage Area, Marine Farm / Aqua Culture, PSSA Area, Non-official ENC, No Vector Chart, Not Up-to-date, Permit Expired, UKC Limit) Shallow Contour (0-99 m, 10)
- Page 382 APPENDIX 1 MENU TREE Settings Menu File Export Select data to export ( Setting data, Route/User chart, Playback data* ) Settings DB export * Disconnect (Click) AMS to use. File Import Select file to import Select data to import ( Setting data, Route/User chart, Playback data* ) File Maintenance (Restores last-saved route/user chart application and Route/user chart system.) Self Test (Check various components of the system.)
-
Page 383: Appendix 2 Abbreviations,Symbols
APPENDIX 2 ABBREVIATIONS, SYMBOLS Abbreviations Abbreviation Meaning Acquire Activate Adjustment Admiralty Information Overlay Automatic Identification System Antenna April ATON Aid To Navigation August AUTO Automatic Blackbox Bow Cross Range Bow Cross Time Blue Bearing Bottom Tracking Caps Capital (letters) Category CCRP Common Consistent Reference Point Channel... - Page 384 APPENDIX 2 ABBREVIATIONS, SYMBOLS Abbreviation Meaning DEMO Demonstration DISP Display Dead Reckoning English East Estimated Time of Arrival External February FILT Filter Global Positioning System Green Gray Gyro Gyrocompass Heading hour International Hydrographic Organization International Maritime Organization Indication Integrated Navigation System Japanese January July...
- Page 385 APPENDIX 2 ABBREVIATIONS, SYMBOLS Abbreviation Meaning minute Minimum MMSI Maritime Mobile Service Identity Man Overboard Monitor Message North Navigation, Navigator Navtex Navigational Telex Nautical miles Number November NtoM Notice to Mariners October Operation Own Ship Personal Computer PERPENDIC Perpendicular Parallel Index (lines) POSN Position PRIM...
- Page 386 APPENDIX 2 ABBREVIATIONS, SYMBOLS Abbreviation Meaning Statute Miles Speed Over the Ground Speed SPEC Specification STAB Stabilization STBY Stand-by Standard Switch SYNC Synchronization True True Bearing Track Control TCPA Time to Closest Point of Approach Track Control System Target TGT, TGTS Target, Targets True Motion True-G...
- Page 387 APPENDIX 2 ABBREVIATIONS, SYMBOLS Symbols ECDIS symbols Symbol name and description Symbol graphic(s) Own ship - true scaled outline This can be displayed when based on user selection either beam width or length is more than 6 mm. Radar antenna position This symbol indicates location of the radar antenna.
- Page 388 APPENDIX 2 ABBREVIATIONS, SYMBOLS Symbol name and description Symbol graphic(s) Past track - past positions Past positions are drawn as small filled circular sym- bols. Radar targets in acquisition state 5 mm in diameter Tracked radar targets TT: Std or small user selection by Symbol Display 3 mm in diameter Tracked radar targets - alternative TT: Std or small user selection by Symbol Display...
- Page 389 APPENDIX 2 ABBREVIATIONS, SYMBOLS Symbol name and description Symbol graphic(s) Activated AIS targets - dangerous targets Dangerous target symbol is red and it flash until ac- knowledged. If both heading and COG are unknown the orienta- tion is toward top of display. Activated AIS target with neither reported heading nor COG Sarah J...
- Page 390 APPENDIX 2 ABBREVIATIONS, SYMBOLS Symbol name and description Symbol graphic(s) Target past positions Radar target past positions AIS target past positions S arah J S arah J Associated target past positions S arah J S arah J Association targets Association AIS target Association AIS dangerous target AIS aid to navigation (ATON) Real ATON is without "V"...
- Page 391 APPENDIX 2 ABBREVIATIONS, SYMBOLS Symbol name and description Symbol graphic(s) Selected targets Lost targets Lost target symbol is red and it flash until acknowl- edged. Waypoint WPT4 Next waypoint WPT4 AP-13...
- Page 392 APPENDIX 2 ABBREVIATIONS, SYMBOLS Symbol name and description Symbol graphic(s) Routes - Monitor Monitored route leg lines are dashed. Leg lines may indicate planned speed and bearing. W05a Wheel over position 1115/20 Jan 15 deg 1213 Plotted positions Plotted position includes some labels. Type is DR, EP or Fix (Fix is without label).
- Page 393 APPENDIX 2 ABBREVIATIONS, SYMBOLS Symbol name and description Symbol graphic(s) Danger highlight Route Plan, Route Monitor and own ship Chart Alarm search area use danger highlight to indicate violation against user selected dangers. Danger bearing Also called by traditional name clearing line. User defined clearing line symbols are available as part of User Chart.
- Page 394 Symbol Meaning Symbol Meaning Minimize button Screenshot capture (on InstantAccess bar) Access AIS, Navtex Monitor brilliance (FURUNO message processing or Hatteland monitor only); control unit backlighting Access user profile, Color palette selection common settings Information (show program Activate weather display no., operator's manual)
-
Page 395: Appendix 3 Digital Interface
APPENDIX 3 DIGITAL INTERFACE Digital Interface Input sentences: ABK, ACN, ALC, ALF, ALR, ARC, CUR, DBT, DPT, DTM, ETL, GGA, GLL, GNS, HBT, HDT, HTD, MTW, MWV, NRX, OSD, PRC, RMC, ROR, ROT, RPM, RSA, RSD, THS, TRC, TRD, TTM, VBW,VDM, VDO, VDR,VSD, VHW, VTG, XDR, ZDA Output sentences: ABM, ACK, ACN, ALC, ALF, ARC, BBM, DDC, EVE, HBT, HTC, OSD, VBW, VDR, VSD, XTE... - Page 396 APPENDIX 3 DIGITAL INTERFACE Data Sentences Input sentences ABK - UAIS Addressed and binary broadcast acknowledgement $**ABK,xxxxxxxxx,x,x.x,x,x,*hh<CR><LF> 2 3 4 5 1. MMSI of the addressed AIS unit (9 digits) 2. AIS channel of reception (No use) 3. Message ID (6, 8, 12, 14) 4.
- Page 397 APPENDIX 3 DIGITAL INTERFACE ALF - Alert sentence $**ALF,x,x,x,hhmmss.ss,a,a,a,aaa,x.x,x.x,x.x,x,c--c,*hh<CR><LF> 1 2 3 5 6 7 8 9 10 11 12 13 1. Total number of ALF sentences this message (1, 2) 2. Sentence number (1, 2) 3. Sequential message identifier (0 to 9) 4.
- Page 398 APPENDIX 3 DIGITAL INTERFACE CUR - Current $**CUR,A,x,x.x,x.x,x.x,a,x.x,x.x,x.x,a,a,*hh<CR><LF> 1 2 3 4 5 6 7 8 9 1011 1. Validity of data (A=valid, V=not valid) 2. Data set number (0 - 9) 3. Layer number (0.0 - 3.0) 4. Current depth in meters (No use) 5.
- Page 399 APPENDIX 3 DIGITAL INTERFACE ETL - Engine telegraph operation status $**ETL,hhmmss.ss,a,xx,xx,a,x*hh<CR><LF> 2 3 4 5 6 1. Event time (UTC) 2. Message type (O=order A=answerback) 3. Position indicator of engine telegraph 00 = Stop engine 01 = [AH] Dead Slow 02 = [AH] Slow 03 = [AH] Half 04 = Full...
- Page 400 APPENDIX 3 DIGITAL INTERFACE GLL - Geographic position, latitude/longitude $**GLL,llll.lll,a,yyyyy.yyy,a,hhmmss.ss,a,x,*hh<CR><LF> 1. Latitude (0000.00000 - 9000.00000) 2. N/S 3. Longitude (0000.00000 - 18000.00000) 4. E/W 5. UTC of position (No use) 6. Status (A=data valid V=data invalid) 7. Mode indicator (A=Autonomous D=Differential E=Estimated M=Manual input S=Simulator) GNS - GNSS fix data $**GNS,hhmmss.ss,llll.lll,a,IIIII.III,a,c--c,xx,x.x,x.x,x.x,x.x,x.x,a*hh<CR><LF>...
- Page 401 APPENDIX 3 DIGITAL INTERFACE HDT - Heading, true $**HDT, xxx.x,T*hh<CR><LF> 1. Heading, degrees (0.00 to 360.00) 2. True (T) HTD - Heading/Track control data $**HTD,A,x.x,a,a,a,x.x,x.x,x.x,x.x,x.x,x.x,x.x,a,A,A,A,x.x*hh<CR><LF> 2 3 4 5 6 8 9 10 11 12 13 141516 17 1. Override, A = in use, V = not in use 2.
- Page 402 APPENDIX 3 DIGITAL INTERFACE MWV - Wind speed and angle $**MWV,x.x,a,x.x,a,A*hh<CR><LF> 1 2 3 4 5 1. Wind angle, degrees (0.00 - 360.00) 2. Reference (R/T) (R=Relative, T=Theoretical) 3. Wind speed (0.00 - 9999.99) 4. Wind speed units (K=km/h M=m/s N=nm) 5.
- Page 403 APPENDIX 3 DIGITAL INTERFACE PRC - Propulsion remote control $**PRC,x.x,A,x.x,a,x.x,a,a,x*hh<CR><LF> 1 2 3 4 5 6 7 8 1. Lever demand position (-100 to 100, 0=stop) 2. Lever demand status (A=data valid V=data invalid) 3. RPM demand value (-9999.9 to 9999.9) 4.
- Page 404 APPENDIX 3 DIGITAL INTERFACE ROR - Rudder order status $**ROR, x.x, A, x.x, A, a*hh<CR><LF> 3 4 5 1. Starboard (or single) rudder order (-90 to 90.0) 2. Status (A=Valid V=Invalid) 3. Port rudder order (-90.0 to 90.0) 4. Status (A=Valid V=Invalid) 5.
- Page 405 APPENDIX 3 DIGITAL INTERFACE RSA - Rudder sensor angle $**RSA,x.x,A,x.x,A*hhCR><LF> 1 2 3 4 1. Starboard(or single) rudder sensor data (-180 - 180.0, NULL) 2. Starboard(or single) rudder sensor status (A=Vaild N=Data invalid) 3. Port rudder sensor data (-180 - 180.0, NULL) 4.
- Page 406 APPENDIX 3 DIGITAL INTERFACE THS - True heading & status $**THS,xxx.x,a*hh<CR><LF> 1. Heading, degrees True (0.00 to 360.00) 2. Mode indicator (A=Autonomous S=Simulator) TRC - Thruster control data $**TRC,x,x.x,a,x.x,a,x.x, a,a*hh<CR><LF> 1 2 3 4 5 6 7 8 1. Number of thruster, bow or stern (01 to 99) 2.
- Page 407 APPENDIX 3 DIGITAL INTERFACE VBW - Dual ground/water speed $**VBW,x.x,x.x,x,x.x,x.x,x,x.x,x,x.x,x,*hh<CR><LF> 1 2 3 4 5 6 7 8 9 10 1. Longitudinal water speed, knots (-9999.999 - 9999.999) 2. Transverse water speed, knots (-9999.999 - 9999.999, null) 3. Status: water speed, A=data valid V=data invalid 4.
- Page 408 APPENDIX 3 DIGITAL INTERFACE VHW - Water speed and headings $**VHW,x.x,T,x.x,M,x.x,N,x.x,K,*hh <CR><LF> 1 2 3 4 5 6 7 8 1. Heading, degrees (0.00 - 360.00) 2. T=True (fixed) 3. Heading, degrees (0.00 - 360.00) 4. M=Magnetic (fixed) 5. Speed, knots (0.00 - 9999.99) 6.
- Page 409 APPENDIX 3 DIGITAL INTERFACE ZDA - Time and date $**ZDA,hhmmss.ss,xx,xx,xxxx,xx,xx<CR><LF> 1. UTC (000000.00 - 235960.99) 2. Day (01 - 31) 3. Month (01 -12) 4. Year (UTC, 1970 - 2037) 5. Local zone, hours (No use) 6. Loca zone, minutes (No use) Output sentences See input sentences for ACN, ALC, ALF, ARC, HBT, OSD, VBW, VDR, VSD ABM - UAIS Addressed binary and safety related message...
- Page 410 APPENDIX 3 DIGITAL INTERFACE EVE - General event message $ **EVE,hhmmss.ss,c--c,c--c*hh <CR><LF> 1. Event time (000000.00 - 235960.99) 2. Tag code used for identification of source of event (RA0001 - RA0010, EI0001 - EI0016, IN0001 - IN0016, II0001 - II0016) 3.
- Page 411 APPENDIX 3 DIGITAL INTERFACE Serial Interface TD-A TD-B LTC1535 ISOGND RD-A RD-B 110 ohm* * Set with jumper. 470 ohm Switchable open/close. RD-H PC-400 RD-C Processor Unit, Sensor Adapter: IEC 61162-2/1 input/output 470 ohm RD-H PC-400 RD-C Processor Unit, Sensor Adapter: IEC 61162-1 input 10 ohm 10 ohm TD-A...
-
Page 412: Appendix 4 Data Color And Meaning
APPENDIX 4 DATA COLOR AND MEANING Indication Sensor COG/SOG Display example color color GNS-A,D,F,P,R VBW-A VTG-A,D,P THS-A SYSTEM GGA-1,2,3,4,5 GLL-A,D and (status: A) RMC-A,D,F,P,R and (status: A) All values in green. RAIM error in GBS sentence is greater than 10 m and DGPS update interval in GGA, GNS sentence is higher than 10 s. -
Page 413: Appendix 5 Alert List
Meaning Remedy Fan1 Rotation Caution For MU-190/231: Connect- If the error frequently Speed Lowering ed to COM1(Main Monitor). occurs, contact FURUNO Fan1 rotation speed is be- and inform frequency of low threshold. occurrence. Fan2 Rotation Caution For MU-231: Connected to... - Page 414 Warning Internal temperature ex- Please turn off monitor. Inside Monitor ceeds threshold. If the error frequently oc- Monitor: Connected to curs, contact FURUNO and COM2 (Sub Monitor). inform frequency of occur- rence. Fan1 No Warning For MU-190/231: Connect- If the error frequently Rotation ed to COM2 (Sub Monitor).
- Page 415 60 seconds. Sentence Syntax Caution For Sub monitor, connected If the error frequently Error to COM2, value of external- occurs, contact FURUNO ly input sentence is out of and inform frequency of range defined by sentence. occurrence. Main Monitor COM Caution...
- Page 416 APPENDIX 5 ALERT LIST Text Default Meaning Remedy Sensor Adapter 6 Caution Communication error with Check the connection with COM Timeout No.6 sensor adapter is de- No.6 sensor adapter and tected. 30 seconds timeout. network. No.6 sensor adapter is turned off, or there is a prob- lem with network.
- Page 417 FU- RUNO. EC-3000 CPU Fan Caution Rotation speed of CPU fan If the error frequently Rotation Speed in processor unit is below occurs, contact FURUNO Lowering threshold. and inform frequency of occurrence. EC-3000 Fan1 Caution Rotation speed of fan1 in...
- Page 418 APPENDIX 5 ALERT LIST Text Default Meaning Remedy Sensor Adapter 11 Caution Communication error with Check the connection with COM Timeout No.11 sensor adapter is de- No.11 sensor adapter and tected. 30 seconds timeout. network. No.11 sensor adapter is turned off, or there is a prob- lem with network.
- Page 419 APPENDIX 5 ALERT LIST Text Default Meaning Remedy Wheel Over Line Alarm Waypoint is now being ap- Be careful that ship crossed proached. When alert 150 WPT. and 151 are not acknowl- edged, ship crosses WOL. When alert 150 is not ac- knowledged, this is generat- ed instead of alert 151.
- Page 420 APPENDIX 5 ALERT LIST Text Default Meaning Remedy Echo Sounder 2 Caution Input of depth data from Check the connection with COM Error No.2 echo sounder has No.2 echo sounder and net- been discontinued for more work. than set time. (Set at installation) Default: 60 seconds No.2 echo sounder is turned...
- Page 421 APPENDIX 5 ALERT LIST Text Default Meaning Remedy Gyro 5 COM Caution Data from No.5 gyro has Check the connection with Error been discontinued for more No.5 gyro and network. than set time. (Set at installation) Default: 60 seconds No.5 gyro is turned off, or there is a problem with net- work.
- Page 422 APPENDIX 5 ALERT LIST Text Default Meaning Remedy SDME 2 COM Er- Caution Speed data from No.2 Check the connection with SDME has been discontin- No.2 SDME and network. ued for more than set time. (Set at installation) Default: 60 seconds No.2 SDME is turned off, or there is a problem with net- work.
- Page 423 APPENDIX 5 ALERT LIST Text Default Meaning Remedy EPFS 5 COM Error Caution Ship position data from Check the connection with No.5 GPS has been discon- No.5 GPS and network. tinued for more than set time. (Set at installation) Default: 60 seconds No.5 GPS is turned off, or there is a problem with net- work.
- Page 424 APPENDIX 5 ALERT LIST Text Default Meaning Remedy Rudder 2 COM Er- Caution Rudder data from No.2 rud- Check the connection with der sensor has been dis- No.2 rudder sensor and continued for more than set network. time. (Set at installation) Default: 60 seconds No.2 Rudder is turned off, or there is a problem with net-...
- Page 425 APPENDIX 5 ALERT LIST Text Default Meaning Remedy Other Sensor 2 Caution Data from No.2 other sen- Check the connection with COM Error sor has been discontinued No.2 other sensor and net- for more than set time. (Set work. at installation) Default: 180 seconds No.2 other sensor is turned off, or there is a problem...
- Page 426 APPENDIX 5 ALERT LIST Text Default Meaning Remedy Other Sensor 9 Caution Data from No.9 other sen- Check the connection with COM Error sor has been discontinued No.9 other sensor and net- for more than set time. (Set work. at installation) Default: 180 seconds No.9 other sensor is turned off, or there is a problem...
- Page 427 Double Gyro Sta- Warning When connected with Dou- If the error frequently tus Conflict ble Gyro System, instru- occurs, contact FURUNO ment produced by and inform frequency of Yokogawa Electric, two occurrence. gyro has been displayed "Selected" status for 3 sec- onds.
- Page 428 APPENDIX 5 ALERT LIST Text Default Meaning Remedy Water Temp COM Caution Data from water temp. has Check the connection with Error been discontinued for more water temp and network. than set time. (Set at installation) Default: 60 seconds Water temp sensor is turned off, or there is a problem with network.
- Page 429 APPENDIX 5 ALERT LIST Text Default Meaning Remedy Other Sensor 11 Caution Data from No.11 other sen- Check the connection with COM Error sor has been discontinued No.11 other sensor and for more than set time. network. (Set at installation) Default: 180 seconds No.11 other sensor is turned off, or there is a prob-...
- Page 430 APPENDIX 5 ALERT LIST Text Default Meaning Remedy Other Sensor 18 Caution Data from No.18 other sen- Check the connection with COM Error sor has been discontinued No.18 other sensor and for more than set time. network. (Set at installation) Default: 180 seconds No.18 other sensor is turned off, or there is a prob-...
- Page 431 APPENDIX 5 ALERT LIST Text Default Meaning Remedy Other Sensor 25 Caution Data from No.25 other sen- Check the connection with COM Error sor has been discontinued No.25 other sensor and for more than set time. network. (Set at installation) Default: 180 seconds No.25 other sensor is turned off, or there is a prob-...
- Page 432 APPENDIX 5 ALERT LIST Text Default Meaning Remedy SDME Sensor Not Warning Speed data from all avail- Check the connection with Available able SDME has been not all SDME. available for more than 3 seconds. WGS84 Not Used Warning WGS84 is not used for da- Check the operator's manu- tum of EPSF or cannot be al of GPS.
- Page 433 APPENDIX 5 ALERT LIST Text Default Meaning Remedy AIS Target Display Caution 95% of maximum number of The number of AIS target target which can be dis- became 95% of that can be played is used. displayed. Change the dis- play number using filter function.
- Page 434 APPENDIX 5 ALERT LIST Text Default Meaning Remedy Traffic Separation Warning When Traffic Separation Be careful of the object Zone Zone is set to Warning/Cau- mentioned left, on ship's di- tion in chart alert, ship en- rection. tered in check area. Inshore Traffic Warning When Inshore Traffic Zone...
- Page 435 RM Stop - Discon- Alarm Error occurs inside of route If the error frequently oc- nect Sensors monitoring function. curs, contact FURUNO and inform frequency of occur- rence. RM Stop - Other Alarm Required data for route Check the connection with...
- Page 436 However, if it's continually removed, there is a possibility that correct data is not received from sensor. In this case, contact FURUNO. EPFS 2 Sensor Caution Own ship position data from Reset the filter to confirm Banned No.2 GPS is determined ab-...
- Page 437 However, if it's continually removed, there is a possibility that correct data is not received from sensor. In this case, contact FURUNO. EPFS 7 Sensor Caution Own ship position data from Reset the filter to confirm Banned No.7 GPS is determined ab-...
- Page 438 However, if it's continually removed, there is a possibility that correct data is not received from sensor. In this case, contact FURUNO. SDME 3 Sensor Caution Own ship speed data from Reset the filter to confirm Banned No.3 SDME is determined...
- Page 439 However, if it's continually removed, there is a possibility that correct data is not received from sensor. In this case, contact FURUNO. ROT Gyro 1 Caution Heading data from No.1 Reset the filter to confirm Sensor Banned...
- Page 440 APPENDIX 5 ALERT LIST Text Default Meaning Remedy No Filter Source of Warning No valid CTW/STW sensor Check the connection with CTW/STW is available for filter. all GPS. (Banned or connection er- ror) No Filter Source of Warning No valid heading sensor is Check the connection with Heading available for filter.
-
Page 441: Specifications
SPECIFICATIONS OF Electronic Chart Display and Information System (ECDIS) FMD-3200/3300/3200-BB MONITOR UNIT Display type MU-190 (FMD-3200) 19-inch color LCD, 1,280 x 1,024 pixel (SXGA) MU-231 (FMD-3300) 23.1-inch color LCD, 1,600 x 1,200 pixel (UXGA) HD26T21 MMD-MA4-FAGA (FMD-3300) 25.54-inch color LCD, 1,920 x 1,200 pixel (WUXGA) - Page 442 FURUNO FMD-3200/3300/3200-BB 2.16 Other functions Radar overlay, Playback log INTELLIGENT HUB (OPTION) Number of ports 8 ports (10/100/1000BASE-T) Swiching method Store and forward, non-blocking L2 switching Capacitance of switching 16 Gbps Flow Control Full-Duplex (IEEE802.3x flow-controlled at automatic mode) Ring aggregation 8 group max.
- Page 443 FURUNO FMD-3200/3300/3200-BB MC-3030D (digital-out) 8 ports: relay contact, normal open and normal close available Ethernet interface for IEC61162-450 (EC-3000) Port (LAN2) 1000Base-TX, IPv4, 8P8C connector Data sentences Input ABK, ACN, ALC, ALF, ALR, ARC, CUR, DBT, DPT, DTM, ETL, GGA, GLL, GNS, HBT, HDT, HTD, MTW, MWV, NRX, OSD, PRC,...
- Page 444 FURUNO FMD-3200/3300/3200-BB Radar connection box (option) 24 VDC: 0.6 A HUB (HUB-3000/ HUB-100, option) 100-230 VAC: 0.1 A, 1 phase, 50-60 Hz ENVIRONMENTAL CONDITION Ambient temperature -15°C to +55°C Relative humidity 95% or less at 40°C Degree of protection Monitor unit...
-
Page 445: Index
INDEX buzzer, IEC 61924-2 mode ....25-7 buzzer, legacy mode ......25-6 Abbreviations ..........AP-5 buzzer, silencing (temporarily) ....25-6 ACTIVE ALERT window......25-10 category and alert acknowledgement..25-3 description ..........25-1 chart cells (S57) ....... 5-9 display priority order ......25-7 chart object information (S57) .. - Page 446 INDEX functions at ECDIS.......26-17 cell deleting ..........3-22 messages when preconditions not met26-22 cell editing ..........3-21 preconditions not met......26-21 display date ..........5-4 route information box ....26-17 26-20 Check area page......8-4 12-5 route steering indications .....26-20 Check results page ........9-9 steering modes, FAP-2000 ....26-11 Circle report..........10-13 steering modes, PR-6000 ....26-12...
- Page 447 INDEX context-sensitive menu ......2-22 details ..........11-10 hiding............. 2-21 messages ..........11-9 measuring bearing with ......2-21 monitoring ........... 11-10 showing ..........2-21 parameters ..........21-4 EBL, VRM boxes........2-13 returning to monitored route ....11-12 ECDIS Control Unit ........1-3 safe off track..........
- Page 448 INDEX length adjustment........12-4 Routes mode ............12-2 adding waypoints at end of route ...9-10 number of lines to display ......12-2 changing waypoint position ....9-10 orientation ..........12-3 creating new..........9-3 resetting ..........12-3 deleting...........9-21 Passage plan report .........9-25 deleting waypoints........9-11 Permanent warning box ......2-12 exporting FEA-2x07, csv, ASCII data..9-21 Permanent warnings exporting FMD-3xx0, FCR-2xx9 data..9-20...
- Page 449 INDEX SPD page..........18-2 tidal report ........... 10-11 Speed input ..........1-10 User default page........23-13 Split screen ..........1-18 User events ..........19-1 Standard page........... 4-4 User profile..........1-16 Status bar..........2-4 Symbols (ECDIS) ........AP-9 Vector length AIS ............14-10 T&P notices..........