Table of Contents
Advertisement
P R O F E S S I O N A L M E D I C A L P R O D U C T S
ECG HOLTER WITH SOFTWARE
Use and maintenance book
TLC5000 (GIMA 35130)
CONTEC MEDICAL SYSTEMS CO., LTD
No.112 Qinhuang West Street, Economic & Technical
Development Zone, Qinhuangdao, Hebei Province,
PEOPLE'S REPUBLIC OF CHINA
Made in China
Prolinx GmbH Brehmstr. 56, 40239,
Duesseldorf, Germany
Gima S.p.A.
Via Marconi, 1 - 20060 Gessate (MI) Italy
gima@gimaitaly.com - export@gimaitaly.com
www.gimaitaly.com
106kPa
+55˚C
-40˚C
86kPa
0%
0123
%
Advertisement
Table of Contents

Related Manuals for Gima 35130


Summary of Contents for Gima 35130
- Page 1 P R O F E S S I O N A L M E D I C A L P R O D U C T S ECG HOLTER WITH SOFTWARE Use and maintenance book TLC5000 (GIMA 35130) 0123 CONTEC MEDICAL SYSTEMS CO., LTD No.112 Qinhuang West Street, Economic &...
- Page 2 Foreword Please read the User Manual carefully before using this product. The operating procedures specifies in this User Manual should be followed strictly. This manual describes in detail the operation steps must be noted, the procedures may result in abnormal, and possible damage to the product or users, refer to following chapters for details.
- Page 3 Type of protection against electric shock: internally powered equipment. Degree of protection against electric shock: type BF applied part. Working mode: continuous operating device. Protection classification of shell: IP22. Measurement results shall be described by qualified doctors combined with clinical ...
- Page 4 Responsibility of operator The device should be operated by a professionally trained medical staff, and kept by a special person. The operator must carefully read the User Manual before using this product, and strictly follow the operating procedure described in the User Manual. The safety requirements have been fully considered in product designing, but the operator ...
-
Page 5: Table Of Contents
CONTENTS Chapter 1 Introduction ....................... 1 1.1 Environment Condition ..................... 1 1.2 Product Feature ......................1 1.3 Safety ......................... 2 1.4 Maintenance and Cleaning..................6 Chapter 2 Frame Character of Product ..................7 2.1 Sketch Map for every Orientation ................7 2.2 Definition of Keystoke, Interface and Indicator Light .......... - Page 6 4.3 System Set ....................... 22 4.4 Replay Record ......................27 Chapter 5 Malfunction Analysis and Troubleshooting ............. 30 5.1 Daily Maintenance ....................30 5.2 The Problem Related to the Battery ................. 31 5.3 The Problem Related to the Skin and the Electrode ..........33 5.4 The Problem Related to the Cable and the Input Plug ..........
-
Page 7: Chapter 1 Introduction
Chapter 1 Introduction 1.1 Environment Condition The environment requirement of operation, transport and storage for Dynamic ECG Systems: Operation Environment: Environment Temperature: 10 ℃~45 ℃ Relative Humidity: ≤85 % Atmospheric Pressure: 86 kPa~106 kPa Power Supply: DC 3 V Transport and Storage Environment: Environment Temperature: -40 ℃~+55 ℃... -
Page 8: Safety
1.3 Safety The design of Dynamic ECG Systems accords with the international safety standard IEC60601-2-47. Warning: Arbitrary modification to the device is forbidden. Avoid strong vibration and shock when using or moving the device. Doctor must tell the patient monitored by recorder not to do violent movement. Turn off the device before cleaning and disinfection. - Page 9 do not use the device in a humid environment. Maintenance and repair are not allowed during using the device. Other equipment or network is forbidden to connect with the system except the signal input/output part connected to the system accessories. Materials of product accessories should comply with the biological compatibility requirements.
- Page 10 and materials according to the regulations and try to classify the waste for recycling. The ST algorithm has tested for accuary of the ST segment data.The significance of the ST segment changes needs to be determined by a clinician. Type BF applied part USB interface WEEE disposal Covering Protection rate...
- Page 11 Medical Device compliant with Directive 93/42/EEC Authorized representative in the European community Manufacturer Date of manufacture Temperature limit Humidity limit Atmospheric pressure limit Keep in a cool, dry place Keep away from sunlight Fragile, handle with care...
-
Page 12: Maintenance And Cleaning
This side up Imported by Product code Lot number 1.4 Maintenance and Cleaning It is recommended that you check if there is any damage on the recorder or leads wires before monitoring on the patient. If you find any damage, stop using it, and contact the biomedical engineer of the hospital or our Customer Service immediately. -
Page 13: Chapter 2 Frame Character Of Product
Chapter 2 Frame Character of Product 2.1 Sketch Map for every Orientation 2.1.1 Front view Fig.2-1 Front view... - Page 14 2.1.2 Side view Fig.2-2 Side view 2.1.3 Bottom view Fig.2-3 Bottom view...
-
Page 15: Definition Of Keystoke, Interface And Indicator Light
2.2 Definition of Keystoke, Interface and Indicator Light function key: marker/affirmance/choice function key: menu/cancel/turn on/off direction key: left direction key: right direction key: go up direction key: go down Indicator light: (glint every 4 seconds when collecting ECG signal) Show date communication status when connecting with the computer. -
Page 16: Chapter 3 Preparing Work Before Using
Chapter 3 Preparing Work before Using 3.1 Electrode Placement Notice: The placement of electrode is the basic of holter recorder collecting ECG data signal. The quality and position of electrode affect the quality of ECG signal. Please read this chapter carefully before first operation. - Page 17 Deal with the skin When attaching and placing the electrode, we need to deal with the skin at first, and be sure to clean the skin. Use 95 % alcohol to scrub the skin, after the alcohol evaporates, use abrasive paper attached to the electrode to wipe the attached place to remove cuticula on the surface of the skin in order to reduce the resistance from the skin and the disturbance from the EMG.
-
Page 18: Battery Installation And Notice
3.2 Battery Installation and Notice 3.2.1 Open the battery cover according to the direction which the arrowhead on the cover indicates. Follow as Fig.3-2. Fig.3-2 3.2.2 Please insert the batteries properly in the right direction, and then close the cover. Follow as Fig.3-3. - Page 19 3.2.3 The state of battery and working requirements are shown as Table 3-a1. The batteries are full, the device could run in gear. The batteries are insufficient, suggest not record. The batteries are almost drained, please replace the battery immediately. Table 3-a1 When the batteries are almost drained and not replaced, the recorder will show the interface (as Fig.3-4), and turn into protected mode.
- Page 20 recorder from damaging. Under protected mode the device don't run until the device is electricized by USB or the batteries are full. Warning: The batteries should be full when the device collects new information, otherwise the recording time could not last long enough. Notice: Please confirm all electrodes and lead wires are connected well to patient.
- Page 21 The usually American indicator is match up to the usually European indicator one by one, the relationship of them are listed in the following table: usually American usually European...
-
Page 22: Chapter 4 Recorder Operation Explanation
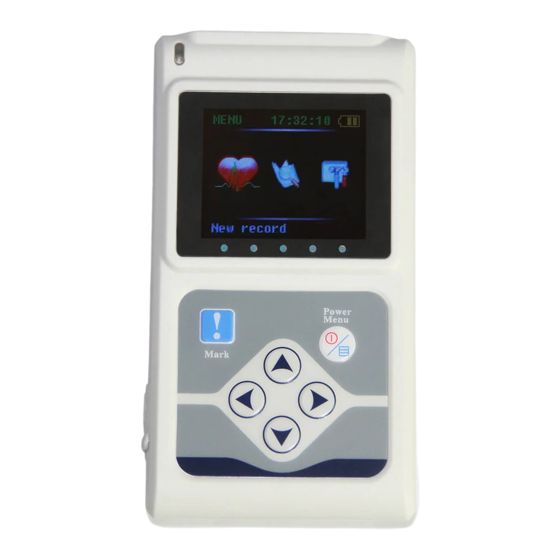
Chapter 4 Recorder Operation Explanation Press for about 3 seconds to turn on the recorder (press for about 3 seconds to turn off the recorder on the main interface), the main interface is shown in Fig.4-1. Fig.4-1 Main interface... -
Page 23: New Record
4.1 New Record to choose on main interface, press to enter new record operation, display interface is as Fig.4-2. On the interface, press to change the gain, press to switch lead status. After recording one time, press if you want to continue to record, here the interface will show the information "Last record will be covered! Are you sure?"... - Page 24 Press to cancel recording and return to the main interface. Press to continue to record and the interface will show the information "Starting record" as Fig.4-4. Fig.4-4 The interface as Fig.4-4 will last 2 seconds, then the recorder enter stand-by mode. The blue indicator on the top left corner of recorder will glitter one time every 4 seconds to show the state in gear.
- Page 25 Press for about 3 seconds to record event marker when recording, in the meanwhile, the beep from recorder indicates you have succeeded in event marker. Press for about 3 seconds when recording if you want to end recording manually, then the recorder will show the information as Fig.4-5 to affirm whether the recording operation will be stopped.
-
Page 26: Review Record
If you confirm that you want to terminate recording, please press for about 3 seconds according to the information shown on the interface, at the same time the screen will display the information as Fig.4-6. This interface will last about 2 seconds, then return to the main interface. Fig.4-6 4.2 Review Record to choose... - Page 27 Lead state waveform display Fig.4-7 Under this interface, use to change lead marker (Ⅰ, Ⅱ, Ⅲ, AVR, AVL, AVF, V1, V2, V3, V4, V5, V6), press to switch between hour, minute and second, the red one shows the option which has been chosen, use to change the value.
-
Page 28: System Set
If the recorder hasn't storage record, there will be a "No record" information on the screen as Fig.4-8, and the interface will return main interface automatically after 2 seconds. Fig.4-8 4.3 System Set to choose on main interface, press to enter the "system set" interface as Fig.4-9. - Page 29 Fig.4-9 to choose the option, use to set the option which has been ① Auto shutdown set chosen or enter the inferior menu, the red one shows the option which has been chosen. ② Keypad tone set The time scope of auto shutdown is 3~98 seconds, if setting 99s, the recorder will open forever. Under this option, you can decide the keypad tone "ON/OFF".
- Page 30 ③ Demo mode Under the item, the demonstration waveform is shown in Fig.4-10. Fig.4-10 Press to switch ECG lead waveform.
- Page 31 ④ System initialization Press to enter the interface as shown in Fig.4-11. Fig.4-11 Notice: Detailed edition information depends on current recorder.
- Page 32 ⑤ Time set Press to enter the initialization interface as shown in Fig.4-12. Press to enter the time set interface as Fig.4-13. Fig.4-12 Fig.4-13 to choose the option, use to change the value, press save the setting and return superior menu. Press to cancel setting and returning superior menu.
-
Page 33: Replay Record
4.4 Replay Record Please remove electrodes from patient, and then connect recorder to PC with USB cable. It is recommended that batteries should be remained in the recorder. The indicator light is on, and the interface displays the information as Fig.4-14 if the connection is normal. Fig.4-14 In "My computer"... - Page 34 Open the disk, you can see a file named ECG_WAVE.BIN (as Fig.4-16). Fig.4-16 Please choose this file of analyse software to perform the replaying operation. Notice: Please refer to the information of chapter 6 for the detail. After replaying, please Safely remove USB Mass Storage Device as Fig.4-17, then pull out USB connecting line to avoid damaging the device.
- Page 35 Notice: The USB interface of recorder is USB2.0, please choose the USB2.0 interface in PC to connect in order to make sure the speed of data communication.
-
Page 36: Chapter 5 Malfunction Analysis And Troubleshooting
Chapter 5 Malfunction Analysis and Troubleshooting 5.1 Daily Maintenance 5.1.1 Maintenance after use Long press to turn off the device. Unplug lead cables, please hold the plug part and do not pull the wire with force. Clean the device and accessories. Place the device in a cool and dry environment. -
Page 37: The Problem Related To The Battery
solvent. Do not use the detergent or germicide containing alcohol (Please do not immerse the lead cables in liquid for disinfection). Bending or knotting will shorten the service life of lead cable. When using it, please straighten the lead cable first. The lead cable should be replaced if it shows broken or corrosion phenomenon. - Page 38 1.The quality of the battery is Change another high-quality poor. or the battery has been put The record time of the new battery. for a long time. recorder can't reach 24 hours. 2. The characteristic and brand Change another new battery. of the battery are different.
-
Page 39: The Problem Related To The Skin And The Electrode
5.3 The Problem Related to the Skin and the Electrode Problem Cause Correction 1. The skin can't be cleaned Clean the skin and attach once well, or the electrode isn't more. attached right. 2. The quality of the one-off The wave is disturbed; electrode poor, new,... -
Page 40: The Problem Related To The Cable And The Input Plug
5.4 The Problem Related to the Cable and the Input Plug Problem Cause Correction Please check if the needles of 1. The recorder isn't connected the plug is curved, broken or The output wave of the well. lack. If the plug is well, please recorder is a straight connect once again. -
Page 41: Other Problems
5.5 Other Problems Problem Cause Correction There is something wrong with the Change another USB cable. USB cable. The communication The USB interface of computer of data is failed. don't match the USB interface of Use 2.0 interface. the recorder. -
Page 42: Chapter 6 Instructions For Analysis Software
Chapter 6 Instructions for Analysis Software Overview PC software name: 12 Channels ECG Holter System_L PC software specification: no PC software version: V5 Version naming rules: V<major version No.>.<minor version No.>.<revised version No.>.<revised version No.> PC software version can be obtained from PC software. ... - Page 43 Start the analysis software for this system. The main interface is shown as (as Fig.6-1). Fig.6-1 Replay HOLTER Recorder Connect the HOLTER recorder with PC. Click the "New" in the menu of "File" or , then input the new patient information.
- Page 44 If the recorder to be used TF memory, please choose the collection file ECG_WAVE.BIN (as Fig.6-2) first. Certainly you could also copy the case history to other place, then choose. If the recorder to be used Flash memory, please turn to Fig.6-2. Fig.6-2 Notice: If the patient takes a pacemaker, choose "Yes"...
- Page 45 After inputting the patient's data, click , and the computer begins to read data from the recorder. The process will finish when prompt as Fig.6-3 show up. Here click enter the interface of arrhythmia analysis (as Fig.6-5), and click to enter the template replay interface (for the analyzed cases) or to the order replay interface (for the not analyzed cases).
- Page 46 Notice: If the patient takes a pacemaker, the pace maker parameters setup interface (as Fig.6-4) will pop up before arrhythmia analysis interface appears. Here doctors need modify the following items according to patient's pace maker parameters. There into the accuracy of pacing pulse analysis relates to the "high"...
- Page 47 Fig.6-5 The left side of the interface (as Fig.6-5) is the waveform display window, showing the waves of all analyses leads. Here need operators choose a meaningful wave to diagnose and adjust the value of ST segment. Look at the picture. The three colored lines from left to right are baseline point, ST segment beginning point, and ST segment ending point.
- Page 48 If the current wave is good, please click the "Accept" button, and then the system enters the arrhythmia analysis (as Fig.6-6) automatically. If the user wants to exit this program, please close direct. If the current wave is not good, please click the "Next Wave" or "Next Segment" button, then the system will show the waves constantly until you click "Accept"...
- Page 49 Fig.6-6 Click the "Stop" button, the system will stop temporarily. User can browse the 12 lead ECG through "←↑→↓" on the keyboard. In the HR trend graph, there is a green symbol line, which represents the place of the current wave. User can go back to a point, change condition ("Leads Analyzed", "Height", "distinguish O"), click "Start", the part starting at the green sign will be analyzed again.
- Page 50 Fig.6-7 When the analysis finished, press "←↑→↓" on the keyboard to go back to certain point to analyze again if necessary. General function explanation of edit module Represent: Arrhythmia analysis module, Template replay module, Order replay module, HRV analysis module, QTD analysis module, HRT module, TWA module, VCG module, VLP module, TVCG module and Parameter definition module.
- Page 51 Move the mouse arrowhead to the side of box, when the arrowhead turn to "↔"or"↕", press the left keypad of mouse and don't set free until drag to the wanted location. Screen interface distributing into the template replay module. (as Fig.6-8) Click Fig.6-8...
- Page 52 The left window is the template window. Every button is a template. The letter in the button represents the type (for example: V means ventricular premature beat, S means atrial premature beat), the percentage means what percentage this kind is in the total. No percentage means no wave.
- Page 53 classifying parameter adjustment function (as Fig.6-9). Fig.6-9...
- Page 54 Parameter name: the name of the parameter to be classified. Number of class: set how many classes the parameter will be classified. It can be increased or decreased by "▲" or "▼" buttons. When it increases 1, the numbers of both the threshold limit value at its right and the boundary in the parameter distribution graph will also increase 1, and the reverse is true.
- Page 55 Fig.6-10 QRS complexes shape: select it to sort the waves according to QRS shape.
- Page 56 Classify all the selected beats by Demix;...
- Page 57 Enter the Demix analyze all the selected beats are shown in the fist module, the density of the wave is more higher and the color is more ducker. Use the balance scroll-box to regulate the color of density of the wave. Click the button "OK" can classify the selected beats. Quick classify Classify by the shape of the Baseline jam, click the button to change the default...
- Page 58 Classify by the shape of the RR Interval, click the button to change the default parameters; Classify by the shape of the RR Interval Ratio, click the button to change the default parameters; Classify by the shape of the QRS’s Area(mv*ms), click the button to change the default parameters.
- Page 59 Right button editor menu Click the right button of mouse, and then an editor menu will be opened. Shortcut key "V", "S", "N", "L" are the shortcut key to put the chosen wave into that class. "Page up", "Page down", "home", "end", "^", "v" mean page up, page down, to the beginning of the page, to the end of the page, up and down.
- Page 60 Control graph display key Remove the ECG in the left window up Remove the ECG in the left window down Remove the ECG in the left window left Remove the ECG in the left window right Amplify the ECG in the left window Lessen the ECG in the left window Cancel the edit operation Recover the edit operation...
- Page 61 Display or hide the microimage Display or hide the time Choose all the ECG in the left window Reverse choice the wave in the left window Cancel choice in the left window...
- Page 62 Order replay module Click the button and enter order replay module. The waves of main analysis lead is displayed in the window as default. The event is the heart beat mark. Fig.6-11...
- Page 63 Event marker, including the blue lines and "Event" in the waveform area and the blue lines in the trend graphic area, shows the operator has press the event button on this position and recorded an event. Put the arrowhead on the ECG and click the right key of the mouse, then appear the menu as Fig.6-12.
- Page 64 Click "Gain" to adjust the wave's gain, viz. Amplification factor. Click "Single lead" to change the lead no. and display the ECG of appointed lead. Click "SV" to display all the strip graph of the appointed kinds in the current ECG. Prompt: The strip graph is a graph that it can plot a single lead ECG wave in a quadrate area and mark the beginning time and average heart rate.
- Page 65 Fig.6-13...
- Page 66 V: Change type into ventricular premature Change type supra ventricular beat premature beat N: Change type to normal beat L: Change type to pause AF: Change type to atrial flutter Af: Change type to atrial fibrillation VF: Change type to ventricular flutter Vf: Change type to ventricular fibrillation O: Change type to interference X: Delete...
- Page 67 Notice: for Max HR, default 6 strip graphs are displayed. If all of that 6 graphs are interference waves or false error, select a graph and delete it. Then the software will automatically analyze and get a new Max HR strip graph and add to the display, as Fig.6-14.
- Page 68 button, show the multi-lead ECG from the starting time (as Fig.6-15). Click Fig.6-15 Notice: in the display interface of the strip graph, double click a graph with the left key of mouse to switch it to the multi-lead cardiogram on the same time.
- Page 69 Click button, show the strip graph of supra ventricular electrocardiogram. Fig.6-16...
- Page 70 button, show the strip graph of ventricular electrocardiogram (as Fig.6-17). Click Fig.6-17 Notice: the strip graph of can be modified on attribute in the selected state, while the strip graph of can only be deleted.
- Page 71 Click the button, enter ST elevation ECG analysis.
- Page 72 Select a lead and click "OK", and in the background window all of the STE strip graphs of this lead, as Fig.6-18. Fig.6-18...
- Page 73 Click button, display ST depression electrocardiogram.
- Page 74 Select a lead and click "OK", and in the background window of all the STE strip graphs of this lead, as Fig.6-19. Fig.6-19 Note: The ST segment analysis can be performed by the software when all leads are using any one of or all calibration signals.
- Page 75 for “STE”(ST elevation) and “STD”(ST depression) analysis functions. Physician can modify the parameters and then repeat the ST segment analysis to this lead. The software has myocardial ischemia analysis function, which can analyze the ST depression events, display the ST depression fragments of all leads in the myocardial ischemia data table (Figure 6-23), and provide a print report.
- Page 76 STLE analysis Click "STLE" item inside of "Arrhythmia" item, show ST adjusting window as Fig.6-20. Fig.6-20 Back: display the former beat waveform; Next: display the next beat waveform; Lead: select a single lead from I to V6 or click "ALL" to display all the ECG waveforms.
- Page 77 Adjust the position of baseline: set the mouse cursor about the line you want to adjust, click the left key of mouse, this line will move to the position of the mouse cursor. Click "OK" after adjusting well, the software will operate all beats ST analysis, and display the analyzing result in the myocardium ischemia table.
- Page 78 Av.HR: Average HR Min HR: minimum HR Max HR: maximum HR V: ventricular premature beat V Couplet: ventricular couplet V Short run: ventricular short run V Long run: ventricular long run V Big: ventricular bigeminy V Trig: ventricular trigeminy S: supra ventricular premature beat S Couplet: supra ventricular couplet S Short run: supra ventricular short run S Long run: supra ventricular long run...
- Page 79 ST Table : display the ST average voltage statistic of each lead for every hour, as Fig.6-22. Fig.6-22 Double click any a data in the row from "I" to "V6" with the left key of mouse to modify it, and click "OK"...
- Page 80 STLE table as Fig.6-23. Fig.6-23 Each row in the table stands for each period of time of ST depression of display lead. The data of table contains: Start time, lasting Length, Av.HR, Max HR, ST, STLE, V, S. User could delete some periods of time in table directly, knock "ok", the changed file will be saved.
- Page 81 User could double click the row in the table, then the order review window will display multi-lead waveform, the beginning time of waveform is the same as "beginning time" of the row as Fig.6-24. Fig.6-24...
- Page 82 After deleting the some periods of time, if user don'' knock "ok" before double click the row in the table, program will remind user to save the changed file or not with the dialog box below. Choosing will save the changed file, choosing will not save.
- Page 83 degree of Ventricular excitability resumptive time, or denote difference degree of Ventricular Refractory period. QT dispersion graph is as Fig.6-25. For increasing precision and reducing error, the system adopts the method that got the mean value, which was based on the each interval produced in the 3 continuous cardiac cycle. The result will show on the right of the interface.
- Page 84 The HR trend graph can help you select the waveform of QTD, which need to be analyzed quickly. Fig.6-25 HRT analysis module. Click button, enter HRT analysis module.
- Page 85 HRT could be quantification expressed by two parameters, the two parameters are TO and TS. Ventricular premature beat causes artery blood pressure brief foul-up. When the adjustable function is natural, this transitory change will be represented by the form of HRT immediately; when the adjustable function is injured, the change will weaken or disappear (as Fig.6-26).
- Page 86 judged condition, the third QRS wave after this position is ventricular premature beat, you can see the RR interval trend graph in the whole HRT occurring term in the left below graph, which have signed the TO, TS segment with red line to make the user more convenient to judge. Click the button in toolbar will display the wave that satisfies...
- Page 87 The three row number below graph express the RR interval the maximal value, the average and minimal value for the corresponding dot. The graph on the right below window is the conclusion as Fig.6-28. Fig.6-28...
- Page 88 Before seeing the whole case report, the option such as "Normal Beats" will show the word "Not Judge". When the result is in the range that "Danger number" indicates, the corresponding result will turn to red to remind the user. T Wave alternation analysis module Click button to enter the T Wave alternation analysis module.
- Page 89 Fig.6-29 The position marked "TWA beginning", "TWA end" is the section of wave that satisfies TWA judged condition. On the left, it is the superposition graph of the singular number wave and dual number wave. The green line is the superposition wave of the singular number, the red line is the superposition wave of the dual number.
- Page 90 single-lead wave of the appointed lead. "HR trend", "RR interval trend" above express the heart rate of TWA segment and the mutative trend of RR interval. Click button in toolbar will display the wave that satisfies last TWA analysis condition, Click the button will display the wave that satisfies next TWA analysis condition.
- Page 91 The user can set the TWA judging standard and the heart beat detecting number. The range for TWA judging standard is 40-100µV, HB detecting number is: 8-128.The purpose of setting is analysis convenience and reducing mistake. Click button to measure RR and PR interval. Put the red point on the wave, pressing the left key and drag to draw an rectangle, then get the measure result;...
- Page 92 Click button to modify the type of QRS wave. Put the mouse pointer which has the blue rectangle on the wave of QRS that need to modify, then you can click the left button to modify the wave. For example: put the blue rectangle on the S that need to modify, click the left button and the S will change to V, then continue click the left button, you will get the O.
- Page 93 Under such situation, the waveform could be modified continuously. Move the mouse to the beginning of the waveform which needs modification, click the right button to choose the start position, then move to the end, click the right button again to make sure the end position. Now the segment can be modified.
- Page 94 Fig.6-30 It is similar to the interface of order replay, but add the azury diagram above the HR trend. It is the RR interval of the current position that displayed. At the same time, there is a red rectangle appear on the multi-channel graph. The waveform that the red rectangle indicates corresponds to the waveform indicated on the RR interval graph.
- Page 95 also can click directly. Use the to roll forwards or backwards and use the turn over the page. During this process, the multi-channel graph and the green line on the HR trend will change at the same time. You will see that there are azury, navy blue, gray and some white lines on the RR interval graph. Their meaning is as follows: The azury is general waveform;...
- Page 96 fibrillation, Normal, interference. At the same time, user also can choose automatic atrial fibrillation analysis ("AF analyze in segment") for this segment. You also can choose the whole automatic atrial fibrillation analysis at the beginning ("AF analyze in all"). Fig.6-31...
- Page 97 button to store ECG of the current time in the print selective queue, as Fig.6-55 Click Click button to delete all of the manually selected ECG segment in the print queue Click button to refresh data. Click button, enter the HRV analysis module. Notice: Click button, the system enters sinus beats HRV analysis.
- Page 98 The frequency domain, time domain and the integration electrocardiogram in 5 minutes. You can print them, can change the starting time by clicking in the below trend graph, an change page by moving the scroll bar in the top right window (as Fig.6-34). Click button to display the all beats HRV analysis results in 5 minutes (as Fig.6-33).
- Page 99 Click button to display sinus beats HRV analysis results in an hour. The frequency domain, time domain and the integration electrocardiogram in one hour. You can print them, can change the starting time by clicking in the below trend graph, an change page by moving the scroll bar in the top right window (as Fig.6-34).
- Page 100 Click button to display the whole process of the sinus beats RR interval histogram (as Fig.6-36). Click button to display the all beats RR interval histogram (as Fig.6-37). Fig.6-36 Fig.6-37...
- Page 101 Click button to display the whole process of the sinus beats RR interval dispersion histogram (as Fig.6-38). Click button to display the all beats RR interval dispersion histogram (as Fig.6-39). Fig.6-38 Fig.6-39...
- Page 102 Click button to display the whole process of the sinus beats RR Interval Poincare (as Fig.6-40). Click button to display the all beats RR Interval Poincare (as Fig.6-41). Fig.6-40 Fig.6-41...
- Page 103 Click button to display the whole process of the sinus beats RR Interval Dispersion Poincare (as Fig.6-42). Click button to display the all beats RR Interval Dispersion Poincare (as Fig.6-43). Fig.6-42 Fig.6-43...
- Page 104 Click button to display the whole process of the sinus beats frequence graph (as Fig.6-44). Click button to display the all beats frequence graph (as Fig.6-45). Fig.6-44 Fig.6-45...
- Page 105 Click button to display the whole process of the sinus beats frequence 3D graph (as Fig.6-46). Click button to display the all beats frequence graph (as Fig.6-47). Fig.6-46 Fig.6-47...
- Page 106 Click button to display the whole process of the sinus beats analysis compositive graphs (as Fig.6-48). Click button to display the all beats analysis compositive graphs (as Fig.6-49). Fig.6-48 Fig.6-49...
- Page 107 Click button to display the whole process of the sinus beats HRD trend graph (as Fig.6-50). Click button to display the all beats arrhythmia trend graph (as Fig.6-51). Fig.6-50 Fig.6-51...
- Page 108 button, display the whole process of the sinus beats HRV data table (as Fig.6-52). Click Click button to display the all beats HRV data table(as Fig.6-53). Fig.6-52 Fig.6-53...
- Page 109 Click button to display the case report, sleeping time setting and additive analysis(as Fig.6-54).
- Page 110 Fig.6-54 Report edit window: The window is used to modify the data of main report and fill in the diagnostic conclusion. Physician: Click the blank under "Physician" to put in the diagnostic conclusion manually or add corresponding words from term library there. Notice: The content under "Physician"...
- Page 111 conclusion. Term library: A professional term library as diagnostic conclusion, where the terms can be added and deleted. Add: Click the input frame, put in the term there and click "Add", the term can be added to the list of term library. Delete: Select a item in the list of term library and click "Delete"...
- Page 112 Click button to display the "Select Printing" window, where the physician can select the required report to print.(as Fig.6-55). Fig.6-55 Report: Select "main report" to report.
- Page 113 ST Table: select "ST Table" in "Order replay" to print. Arrhythmia Table: select "Arrhythmia table" in "Order replay" to print. Flutter & Fib: select "Atrial Fibrillation" report to print. V Run Table: select "V Run Table" to print. Bradycardia: select "Bradycardia Table" to print. STLE Table: select "STLE table"...
- Page 114 Dormancy asphyxia analyze: select dormancy asphyxia analyze report to print, including: the reports of Trend, Multiparameter balance and Dangers analyze. Trend: select various trend graphs to print, including: HR, ST of each lead, T of each lead, VE and SVE. ECG segment selection: Click button to remove the single time in the left frame into the right and wait to print.
- Page 115 Flutter & Fib is not selective to print in the lack of the Atrial Fibrillation analyze. STLE Table is not selective to print in the lack of the STLE analyze. HRV Table is not selective to print if it has not been examined in HRV analyze. Pacing Report is selective to print only for the case with pacing.
- Page 116 Press SHIFT key and knock the ECG at the same time to choose the beginning time and end time, knock "continue "button, the QRS emendation graph about beginning and end positions will appear.
- Page 117 Click "OK" button and enter three-leads VCG graph As Fig.6-56. Fig.6-56...
- Page 118 Click button and enter Set VCG Measurement Point. button and enter Frontal plane X-Y graph (as Fig.6-57). Click Click button and enter Transverse plane X-Z graph (as Fig.6-57). Click button and enter Sagittal plane Z-Y graph (as Fig.6-57). Fig.6-57...
- Page 119 VLP analytical module button and enter VLP analytical module (as Fig.6-58). Click Fig.6-58...
- Page 120 Data statistics The statistical result of VLP analyze is displayed in "wave affirm" interface as following: Total beats: the total number of beats for the selected time in "File conversation" Accepted beats: the total number of beats in "Wave Affirm"; Rejected beats: the number of rejected beats in "Wave Affirm";...
- Page 121 Maximal R-R Limit: set a percentage value, the ECG waveform with RR interval more than average RR interval by this percentage value will be rejected. Minimal R-R Limit: set a percentage value, the ECG waveform with RR interval less than average RR interval by this percentage value will be rejected.
- Page 122 Time-D Click this button to enter the time domain analysis interface. The content of "Statistics data" in this interface is as following: Standard QRS: the time between two erect line in standard unfiltered window.
- Page 123 Total QRS: the time between two erect line in FIR filter window. Under 40 µV: the duration of waves with the amplitude less than 40 µV at the end of QRS waves after filtering and Superposition. Last 40 ms: root meat square of the amplitude in the last 40 ms of QRS waves after filtering and Superposition.
- Page 124 FIR filter: the superposed wave after filtering is displayed in this window. Two erect lines denote the start position and end position of standard QRS wave. Click one with the left key of mouse and it will turn blue which shows it has been selected. Here adjust its position with "←" and "→" on keyboard, meanwhile the data of standard QRS will change, too.
- Page 125 5 uv/div: select the gain 5 uv/div. Freq-D Click this button to enter the interface of frequency domain analysis. The content of data statistics is accordant with time domain analysis in this interface. Standard unfiltered: in "Freq-D" window a single-lead unfiltered superposed wave is display in...
- Page 126 this window. Click the right key of mouse to call up a menu without multiply selection. When the end position of QRS wave is adjusted, 3-D frequency graph will also change. 3-D frequency graph: display 3-D frequency graph of the single-lead superposed wave. Click to print and click to preview the VLP analyze report in VLP analytical module.
- Page 127 button and enter the parameter setting operation (as Fig.6-59). Click Fig.6-59 R-R Pause: A standard of judging pause module; V Width Limit: A stander of judging ventricular premature beat module. A wave whose QRS...
- Page 128 complex time is longer than this parameter will be judged to V. The default is 80ms; SV Prematurity: A parameter of judging V or S; Bradycardia Time: the shortest time limit of bradycardia segment; Bradycardia HR: the highest HR of bradycardia segment; Min R-R Interval: the minimum interval of two heart beats;...
- Page 129 Wireless Device Port: Select a wireless device port; Notice: "Create report files" is un-enabled in default of "Bullzip PDF Printer". If the physician wants to analyze the case again, he can click the "Open Old Case" in the menu of "File"...
- Page 130 Click button to modify information that has been selected in case list; Click button to delete the case which has been selected in case list; Click button to review report files; Double click the item to open the case. Fig.6-61...
- Page 131 Pacing analysis When the data contain pacing signal, the system can identify it automatically and add the pacing analyze function (as Fig.6-64). After recorder replay, the pace maker parameters setting window will appear, about its function, please refer to "replay HOLTER recorder". There are 11 templates windows in the template replay function, as Fig.6-62.
- Page 132 signal on the ECG wave. Fig.6-62 Notice: The blue line under the ECG wave is marker for pacing, enter that it is pacing signal on the ECG wave.
- Page 133 Enter the order replay, click the button and appear the "Chart" dialog box which added the "Pacemaker Table" (as Fig.6-63). Fig.6-63...
- Page 134 Sleep breath pause syndrome analysis First, make sure that the time when the patient begins to use recorder is correct (as Fig.6-64). Fig.6-64...
- Page 135 In case report please fill the correct sleep time and wake time about sleeping time segment (as Fig.6-65). Fig.6-65...
- Page 136 Last, in printing function dialog box , "Trend", "Multiparameter balance", "Dangers analyse" about the option of "Dormancy asphyxia analyze" (as Fig.6-66). Fig.6-66 After confirming, the physician could print dormancy asphyxia analysis report and diagnose.
-
Page 137: Appendix Ⅰ
Appendix Ⅰ When the device is shipped from the factory, the intact packaging should contain the following content, as shown below: Name Quality Host 1 pc Electrodes 1 box Leads 1 set USB2.0 cable 1 pc PC software 1 pc Backpack 1 pc User manual... - Page 138 please contact our company immediately. Please use the accessories provided by our company, otherwise the performance and safety of the device may be affected. If accessories provided by other company need to be used, please first consult the after-sales service of our company, or we will not responsible for any caused damages.
- Page 139 Appendix II Heart rate calculation method: The non-interference heart rate in the ECG picture segment is N, and the heart rate (HR) calculation formula is as follows HR = 60000 / Sum of R-R interval of N heartbeats / N) Arrest recognition method: According to the pause maximum heart rate or minimum RR interval set by the user in the "parameter definition"...
- Page 140 "Report", that is, the number of fragments that occurred in each lead segment of the mouth. This software provides the hourly ST-segment average voltage output of all leads in the "ST-segment data sheet". After using the "Myocardial Ischemia Analysis" function, a total emergency ischemia load table is generated, and the start time and the start time of the ST segment depression segment in each lead of the whole case are counted.
-
Page 141: Appendix Iii Guidance And Manufacture's Declaration
Appendix III Guidance and Manufacture's Declaration... -
Page 146: Appendix Iv Accuracy Of Operating Data
Appendix IV Accuracy of Operating Data The systems having automated ECG analysis is required to fulfill of this table Gross AHA DB MIT DB NST DB CU DB statistics assess assess assess assess actual ment actual actual actual ment ment ment criteri test... -
Page 147: Appendix V Warranty
VEB Couplets 63.19 57.73 Se (G) VEB Couplets 82.66 80.57 +P (G) VEB Short 40.20 19.85 Runs Se (G) VEB Short 77.34 18.56 Runs +P (G) VEB Long 10.30 14.79 Runs Se (G) VEB Long 53.44 7.64 Runs +P (G) Appendix V Warranty In normal use condition that user strictly following the user manual and operation precautions to use, if the device shows any problem, please contact our customer service department. - Page 148 of purchase. In order to facilitate us to provide you with a comprehensive and efficient maintenance service, please be sure to return the warranty card when you need repair service. Our company may adopt remote guidance, express delivery, visiting service or other methods to carry out the maintenance service.
- Page 149 Disposal: The product must not be disposed of along with other domestic waste. The users must dispose of this equipment by bringing it to a specific recycling point for electric and electronic equipment. GIMA WARRANTY TERMS The Gima 12-month standard B2B warranty applies.
Need help?
Do you have a question about the 35130 and is the answer not in the manual?
Questions and answers