Table of Contents
Advertisement
Quick Links
Advertisement
Table of Contents

Subscribe to Our Youtube Channel
Related Manuals for ADTEK AFM-8A


Summary of Contents for ADTEK AFM-8A
- Page 1 AFM-8A High Performance Power Analyzer Operation Manual Rev 1.0 2023-02-22...
- Page 2 CopyRight This manual is copyrighted. Without the written permission of the Company, any of the paragraphs and chapters of this manual shall not be extracted, copied or reproduced and transmitted in any form, or all consequences shall be borne by the off ender. The Company reserves all legal rights.
-
Page 3: Table Of Contents
Table of Contents Chapter 1. Meter overview ..............1 1.1 AFM-8A series function introduction ............1 1.2 AFM-8A series product features ..............2 1.3 AFM-8A series applications ............... 3 Chapter 2 Installation ................4 2.1 Exterior and dimensions ................4 2.2 Meter installation ..................4 2.3 Meter connections and wiring .............. - Page 4 4.4.1 Setting of single event logging function ..........27 4.4.2 Event logging function enable ............28 4.4.3 Event log read ................... 28 4.5 Relay function ..................29 4.5.1 Alarm function setting ................ 30 4.5.2 Alarm function enable ................ 30 4.5.3 Alarm records read ................30 4.6 Digital input(DI) function ................
-
Page 5: Chapter 1. Meter Overview
fi nd the manual at any time. Perfect choice for power SCADA system AFM-8A series can be used as a stand alone meter, but also can be a power monitoring system (SCADA) of the front-end devices, through a variety of communication interface for remote data collection and control. -
Page 6: Afm-8A Series Product Features
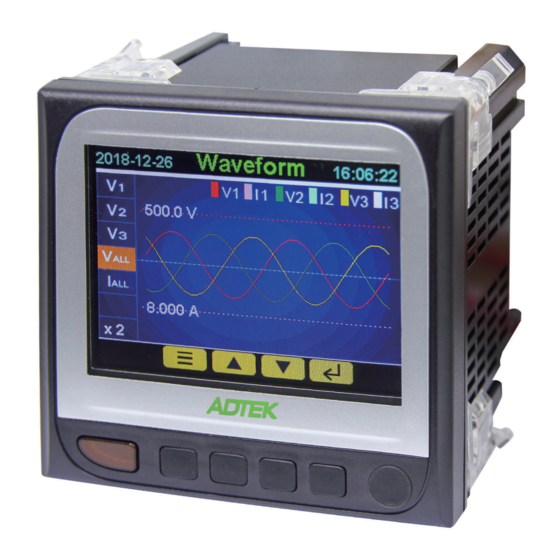
Power quality event logging AFM-8A series in the voltage sag, swell and over current events occur, will record the time of the incident and the trigger conditions. It's up to 50,000 records of power quality events. Waveform records AFM-8A series can record 8 groups of each phase voltage and current waveform data, each cycle has 64 points sampling data of the record, the meter can record before and after the 8 cycle waveform data from trigger conditions establish. -
Page 7: Afm-8A Series Applications
1.3 AFM-8A series applications • Energy management system • Industry automation • Power monitoring • Power grid automation • Intelligent Building • Intelligent switchboard, switchgear • Substation automation... -
Page 8: Chapter 2 Installation
Chapter 2 Installation 2.1 Exterior and dimensions 2.2 Meter installation 2.3 Meter connections and wiring Terminal block 2AO+4DI+4RO 2AO+4DI+4RO+LAN 2AO+8DI 2AO+8DI+LAN... - Page 9 Voltage and current wiring (CT secondary side distinguishes 1A/5A and 333mV) 1 Phase 1P2W(0~1A/5A) 1P3W(0~1A/5A) 1P2W(0~333mV) 1P3W(0~333mV)
- Page 10 3P3W w/o PT 3CT(0~1A/5A) 2CT(0~1A/5A) 1CT(0~1A/5A) 3CT(0~333mV) 2CT(0~333mV) 1CT(0~333mV) 3P3W 2PT 3CT(0~1A/5A) 2CT(0~1A/5A) 1CT(0~1A/5A) 3CT(0~333mV) 2CT(0~333mV) 1CT(0~333mV)
- Page 11 3P4W w/o PT 3CT(0~1A/5A) 1CT(0~1A/5A) 3CT(0~333mV) 1CT(0~333mV) 3P4W 3PT 3CT(0~1A/5A) 1CT(0~1A/5A) 3CT(0~333mV) 1CT(0~333mV)
- Page 12 AUX. Power connection AUX. Power input range: ADH: AC 85~264V / DC 100~300V ADL: DC/AC 20~56V Analog output(AO) / Pulse output (PO) Voltage output: 0~5V / 1~5V / 0~10V , ≥1000Ω Current output: 0~20mA / 4~20mA / 0~10mA ≤530Ω Pulse output: Open Collector(O.C.) 30Vdc / 30mA(max) Relay output (RO) / Digital input (DI)
-
Page 13: Chapter 3 Meter Display And Operation
3.2 Display screen and operation buttons description AFM-8A series display panel is a 3.5 inch TFT-LCD, the resolution is 320 * 240 pixels.The display content and the way will be fl exible according to the actual needs. There are four... -
Page 14: Operation Buttons
3.2.1 Operation buttons The buttons function below the screen will vary depending on the content of the screen,and function icon for the button is displayed at the bottom of the screen. The functions described are as follows: Icon Description Menu key Into quickly index list page Enter / Confi... -
Page 15: Measurement Data Display And Key Operation
Icon Description Load type indication, resistive / capacitive / inductive type. System power 1 ~ 4 quadrant indication. TOU execute indication, the numbers below are represented by left to right respectively: Season / Time table / Segment number Data logging execute indication. Current load indication, each cell represents a 10% load percentage. - Page 16 The measurement parameters are displayed as follows: ↓ → → Phase voltage Line voltage Unbalance ↑ ↓ → → → Current Neutral current Unbalance Current demand ↑ ↓ Active power → Power demand ↑ ↓ Reactive power → Power demand ↑...
- Page 17 Quickly index list: Voltage Voltage L-N Voltage L-L Unbalance Current Current Unbalance Demand Current Power Active Power Reactive Power Apparent Power Demand Power Power Factor Power Factor Harmonic THD Voltage THD Current Individual Energy Energy Summary Active Energy Reactive Energy...
- Page 18 MAX/MIN Phase Voltage Line Voltage Current Active Power Reactive Power Apparent Power Power Factor Frequency Unbalance THD Voltage THD Current Demand Current Demand Power Demand Demand Current Demand Power Phasor Diagram Phasor Diagram Waveforms Waveforms TOU Data Last Month This Month Yesterday Today Event Log...
-
Page 19: Max/Min Data Display And Key Operation
3.4 Max/Min data display and key operation Enter the max/min query page after the parameter list appears on right of screen, press the up and down keys to select the item to be queried then press Press right key to switch the maximum / minimum screen. Press the up and down keys to switch between diff... -
Page 20: Harmonic Data Display And Key Operation
3.6 Harmonic data display and key operation To query the harmonic data can enter from the summary display page or from the quickly index list into the query. THD of voltage or current is shown on one page. 2nd~63rd individual harmonic divided into two page displays. -
Page 21: Phasor Diagram Display And Key Operation
3.7 Phasor diagram display and key operation To query the phasor diagram only can enter from the quickly index list. The phasor diagram has three kinds of page, which can be switched by left and right keys. The contents of the screen in the left side were shown for each phase voltage and current angle, the each phase voltage and current value and the each phase power factor. -
Page 22: Time Of Use (Tou) Data Display And Key Operation
3.9 Time of use (TOU) data display and key operation To query the TOU data only can enter from the quickly index list. After entering the query, fi rst need to select the data for this month, last month, today or yesterday, next select the tariff... -
Page 23: Meter Information And Key Operation
3.11 Meter information and key operation To query the meter information only can enter from the quickly index list. When you select the information in the quickly index list, the right side displays the items of the information. 3.12 Setting display and key operation 3.12.1 Password input To enter the setting function, must enter a set of password, the password is correct to enter the settings... -
Page 24: Setting Menu List
3.12.3 Setting menu list Into each item can be seen detail the parameters items, list as below: Meter Setup Power System Power System PT Primary PT Secondary CT Primary CT Secondary Energy Unit Demand Mode Interval Clock Date Time Display Main Page Rotating Interval Active Bright. - Page 25 Input / Output Relay Setup Analog Output Digital Input DI 1 Function DI 2 Function DI 3 Function DI 4 Function DI 5 Function DI 6 Function DI 7 Function DI 8 Function Debounce Time Pulse Output Pulse Output 1 Output Sourse High Width Pulse Output 2...
- Page 26 COM Port COM Port 1 Interface Modbus Mode Station Address Baud Rate Data Parity COM Port 2 Interface Modbus Mode Station Address Baud Rate Data Parity Power Event & Waveform Enable Power Event Log Capture a Waveform Clear All Waveforms Clear Power Event Logs Rated Voltage Rated Current...
-
Page 27: Parameter Setting Input Key Operation
Reset & Clear Reset Max / Min Value Reset Demand Reset Demand Peak Reset Demand Peak of TOU Clear Energy Reset AO1 Zero / Span Reset AO2 Zero / Span Clear CO Emission Reset Operating Timer Reset Load Timer Reset Auto-Wiring Table Reset Ethernet Parameter Make Meter to Default 3.12.4 Parameter setting input key operation... -
Page 28: Chapter 4 Detailed Functions Description
Chapter 4 Detailed functions description 4.1 Basic Measurements The AFM-8A series meter can measure voltage, current, power, frequency, power factor, demand, etc. 4.1.1 Demand This meter consists of several types of demand calculation: total active power demand, total reactive power demand, total apparent power demand, phase A current demand, phase B current demand, and phase C current demand. -
Page 29: Energy Measurements
4.1.2 Energy measurements The meter provides fully bi-directional, 4-quadrant energy metering. The meter stores all accumulated active, reactive and apparent energy measurements in nonvolatile memory. Energy accumulated was from the last reset until the current moment. 4.1.2.1 Energy metering is full-wave based calculation is used to accumulate energy including fundamental and harmonics. -
Page 30: Max/Min
4.1.3.3 Then confi rm the reactive power value is correct, if correct, select Yes to continue, if not correct, select No, the meter will return to the active power to recalculate or display the message to inform the adjustment of voltage wiring recommendations 4.1.3.4 Finally will show the results, if correct, select Confi... -
Page 31: Harmonics And Power Quality Analysis
For other settings, it gives out the phase angles of V2, V3, I1, I2, I3 corresponding to V1. 4.3.3 Unbalance analysis AFM-8A series meter analyzes the AC sampling values to obtain the values of voltage and current unbalance. 4.4 Event logging function AFM-8A series meter has the function of event logging. -
Page 32: Event Logging Function Enable
Parameter assign: select target parameter for event logging. For example: 1 is frequency, 13 is current average…etc.(see Table4-2) ▼ Table 4-2 Trigger condition and set point: set logging condition, such as more than(>), equal(=), less than(<). For example: if you choose target parameter to be "frequency", condition to be "more than"... -
Page 33: Relay Function
▼ Table 4-3 4.5 Relay function AFM-8A series meter have 4 relays, in addition to RO function can also be used, also as an alarm output. That is when the value of a parameter is higher or lower than the over limit setting value, the alarm will be started, the relay will be output , and the parameter code, value, alarm status and alarm occur time will be recorded in the event log. -
Page 34: Alarm Function Setting
Relay contactor capacity: 5A/250Vac; 5A/30Vdc 4.5.1 Alarm function setting Table 4-4 indicates the fi rst setting of fi rst relay’s settings, there are 12 sets in total with the same format. As long as one of the alarm conditions be triggered, the relay will be activated until all alarm conditions recovery. -
Page 35: Digital Input(Di) Function
4.6 Digital input(DI) function The AFM-8A series meter have four digital input ports and can be expanded up to eight ports(there are no relay function when at eight ports due to the multiplexed pins). The setting operation is completed by setting the corresponding register or from the meter front. -
Page 36: Analog Output(Ao) Function
4.7 Analog output(AO) function AFM-8A series meter provide two AO (analog output) circuits, by meter front or communication settings, select one of the meter parameters for convert output. AO output mode has 0 ~ 20mA, 4 ~ 20mA, 0 ~ 10mA, 0 ~ 10V, 0 ~ 5V and 1 ~ 5V for option, the load capacity as below: 0~10V / 0~5V / 1~5V: Load Resistance ≥... -
Page 37: Pulse Output(Po) Function
4.8 Pulse output(PO) function AFM-8A series meter provide two PO (pulse output) ports, by meter front or communication settings, select one of the meter energy parameters for convert output. The energy parameters are import active energy, export active energy, import reactive energy, export reactive energy and test pulse output. -
Page 38: Po Function Setting
4.8.1 PO function setting Table 4-8 indicates the setting contents and addresses of PO. ▼ Table 4-8 Parameter assign: select target energy parameter for PO convert output. Two ports of PO can be set corresponding output parameters. Pulse divider setting: That is the energy value multiplied by a number to output a pulse. The setting range is an integer from 1 to 9999, unit is 0.1kWh. - Page 39 ▼ Table 4-9 The types of parameters are described below: Basic measurement parameters: Frequency, voltage, current, neutral current, power, power factor, voltage and current unbalance, load type, current demand and power demand. Energy: Import and export of active energy, reactive energy and apparent energy. Harmonic distortion rate: The phase of voltage and current and the average total harmonic distortion rate.
-
Page 40: Data Log Read
Note: Condition setting, recording function enable, etc. must be done before using the data logging function. Any incomplete or incorrect settings will result in the recorded failure. The setting operation is completed by setting the corresponding register. It should be specially explained that the settings of these registers must be set by means of communication. -
Page 41: Time Of Use (Tou) Function
4.10 Time of use (TOU) function User can assign up to 4 diff erent tariff s (sharp, peak, valley and normal) to diff erent time period within a day according to the billing requirements. The meter will calculate and accumulate energy to different tariffs according to the meter’s internal clock timing and TOU settings. -
Page 42: Segment Setting
4.10.4 Segment setting Each TOU schedule consists of various timing segments. The number of segments depends on the segment setting parameter setup. The parameter can be selected from any integer between 1 to 8. User must enter the correct value for the segment setting parameter in accordance to the TOU schedule table. -
Page 43: Power Quality Event Logging And Waveform Capture
TOU, all values from current month TOU will be cleared and reset to 0. 4.11 Power quality event logging and Waveform capture AFM-8A series meter with power quality event logging and waveform capture functions, to provide user with the basis for the analysis of power quality. The 4MB FLASH of the meter to store the data, and ensure the data is not lost when the power is off... -
Page 44: Event Logging Data Format, See Table 4-11
4.11.1 Event logging data format, see Table 4-11 ▼ Table 4-11 Event time: The date and time when the event log was triggered. Trigger source: Event log caused by a voltage sag or voltage swell or over current. Set point: Voltage or current set point. Trigger threshold: The percentage of voltage sag or voltage swell or over current by triggered. - Page 45 4.11.3.2 Voltage swell When any phase of the three phase voltage is higher than the set value (voltage rated value x threshold %), there will be a voltage swell event. When one phase voltage swell happens, the other phase will not respond to voltage swell event logging. Only when all of the phases voltage restore back to normal, a new voltage swell event will be responded.
-
Page 46: Event Log Retrieve
▼ Table 4-13 Waveform capture AFM-8A series meter can record 8 groups of voltage and current waveform data at a sampling rate of 64 points per cycle. It provides the captured waveform of 8 cycles before and after the triggering point (including V1, V2, V3, I1, I2, I3). The triggering condition is settable. -
Page 47: Waveform Capture Triggering Condition
First-In First-Out(FIFO) mode: When the 8 groups data is full, the next trigger condition comes, the new waveform data will starts from the fi rst group, and cover the original data of the fi rst group, record by loop. Fill and Hold mode: When the 8 groups data is full, it does not respond to any waveform triggering condition. -
Page 48: Waveform Capture Retrieve
4.11.7.5 Over current triggering As mentioned in over current event logging, when over current triggering waveform is enabled, both event logging and waveform capture will be implemented at the same time once a over current happens. 4.11.8 Waveform capture retrieve In Modbus address section, only one group of waveform is saved. -
Page 49: Communication Function
4.12 Communication function AFM-8A series meter in addition to the first port of RS-485 communication, also can optional second port of communication, include RS-485 or Ethernet. 4.12.1 The fi rst port of RS-485 communication The setting of RS-485 communication parameters can be completed by setting the corresponding register or from the meter front, see Table 4-15. -
Page 50: The Second Port Of Rs-485 Communication
Note: When set to Master mode, the device address of second port is invalid. 4.12.3 Ethernet communication The second port communication of AFM-8A series meter also can be option Ethernet communication. The setting of Ethernet communication parameters can be completed by setting the corresponding register or from the meter front, see Table 4-16. -
Page 51: Expansion Dio Module Function
4.13 Expansion DIO module function AFM-8A series meter has DI input and RO output function, if the channel number is not enough to use, you can through the second RS-485 port to expand DIO module. -
Page 52: Dio Expansion Module Read And Control
DI start address setting: Set the module's first DI address, as the meter reads the DI status of the starting address. DO start address setting: Set the module's fi rst DO address, as the meter reads or control the DO status of the starting address. Module enable: 0: Disable;1: Enable. - Page 53 In the functions, the DO of the expansion module is the same as the RO function of the meter, but the action mode is diff erent. The DO action mode of the expansion module is the level or pulse output mode. When set to pulse mode, you can set the output pulse width time.
Need help?
Do you have a question about the AFM-8A and is the answer not in the manual?
Questions and answers