Table of Contents
Advertisement
Quick Links
Advertisement
Table of Contents

Related Manuals for Lumel P43


Summary of Contents for Lumel P43
- Page 1 TRANSDUCER OF NETWORK PARAMETERS P43 TYPE USER’S MANUAL...
-
Page 3: Table Of Contents
6. Archive - Power Profile ............30 7. Error Codes ..............30 8. Serial Interfaces ............... 31 9. Examples of P43 Transducer Programming ....... 40 10. Technical Data ..............43 11. Execution Codes ............... 46 12. Maintenance and Guarantee ..........47... -
Page 5: Application
1. APPLICATION The P43 transducer is a programmable digital instrument destined for the measurement and parameter conversion of 3 or 4-wire three-phase power networks, in balanced and unbalanced systems. It ensures the measurement and conversion of measured values into standard analog current signals. Two relay outputs signal the overflow of selected quantities, and the pulse output can be used for the con- sumption monitoring of the 3-phase active energy. -
Page 6: Transducer Set
Transducer output signals are galvanically isolated from the input signal and the supply. Outside the transducer, there are socket-plug 2. TRANSDUCER SET The set of the P43 transducer is composed of: - P43 transducer 1 pc - user’s manual... -
Page 7: Installation
4. INSTALLATION 4.1. Fitting The P43 transducer is adapted to be mounted on a 35 mm rail acc. to EN 60715. The overall drawing and the fitting way are presented on the fig.1. Fig.1 Overall Dimensions and Transducer Fitting Way. - Page 8 4.2. External Connection Diagrams Direct measure- ment in a three-wire network Semi-indirect mea- surement in a three- wire network...
- Page 10 Direct measurement in a four-wire network Semi-indirect measurement in a four-wire network...
-
Page 12: Service
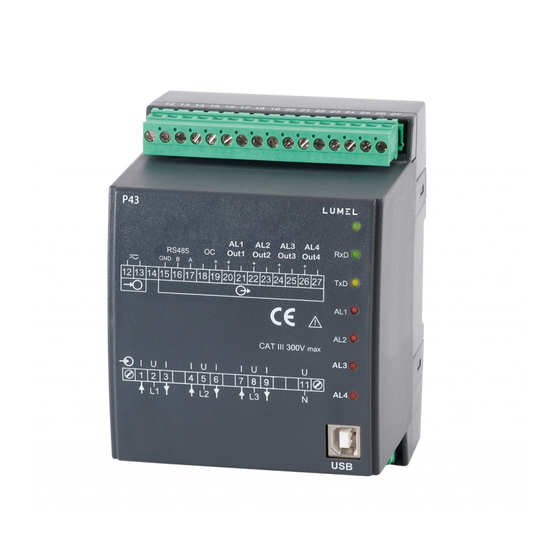
AL2 alarms USB link for configuration Fig. 4 Frontal view of the P43 transducer Messages after Switching the Supply on After switching the supply on, the state diode should light up for a moment in red, and next should light up in green. The recording confirmation in registers is signaled by a short extinction of the state diode. - Page 13 (fig. 4). Installation of COM Port Controllers in the Computer The P43 transducer makes use of the software, which creates in the system, a device of Universal Serial Bus – P43 transducer of network parameters, and connected to it, the virtual COM port named P43 transducer of network parameters.
- Page 14 After the successful ending of the installation, the system will inform about the installation of a new device (fig. 7.). Two new devices ap- pear in the device manager – Transducer P43 and Port COM named: Transducer P43, acc. to the fig. 8.
- Page 15 Transducer Configuration by Means of the LPCon Software The LPCon software is destined for the configuration of the P43 trans- ducer. One must connect the transducer to the PC computer through the PD10 converter or directly through the USB link and after choosing the Option->...
- Page 16 Fig. 9. Configuration of the connection with the P43 transducer After the connection configuration, one must choose from the Device -> Transducers -> P43 menu, and next click the Readout icon in order to read out all parameters. One can also read out parameters individually in each group, clicking the Refresh button.
- Page 17 After choosing the group – transmission parameters, it is possible to configure following elements: a) address – address for the communication with the P43 transducer through the RS-485 interface from the range 1...247. The value 1 is normally set up by the manufacturer.
- Page 18 Setting of Measurement Parameters After choosing the group: ratios, power synchronization, time, follo- wing elements can be configured (fig. 11.): a) current transformer ratio. The multiplier is used to recalculate the current in the transformer primary side. It is set up on 1 by the manufacturer. b) voltage transformer ratio.
- Page 19 Fig. 12. Measurement of the 15 minutes’ active mean power synchro- nized with the clock. d) current time. Time in the form hh:mm:ss. It is set up on 0:00:00 by the manufacturer (also after the supply decay). Erasing of Watt-hour Meters and Extremal Values After choosing the group: erasing of watt-hour meters and extremal Values, following commands are possible to carry out (fig.
- Page 20 Setting of alarm parameters After choosing the group: alarm 1 configuration or alarm 2 configura- tion, it is possible to configure following alarm parameters (fig. 15): a) assignment of the alarm output parameter – kind of signal, on which the alarm acc. to the table 1 has to react, The set of the input quantity for alarms and analog outputs is included in the table 1.
- Page 21 Apparent power of phase L3 Un x In [VA] * Coefficient of active power of phase L3 Coefficient tg of phase L3 3-phase mean voltage Un [V] * 3-phase mean current In [A] * 3-phase active power (P1+P2+P3) 3 x Un x In x cos(0°) [W] * 3 x Un x In x sin(90°) [var] * 3-phase reactive power (Q1+Q2+Q3) 3x Un x In [VA] *...
- Page 22 Exemplary configuration of alarm 1 and 2 is presented on the fig. 15. a) n-on b) n-off c) on d) off Fig. 14. Alarm types: a) n-on, b) n-off c) on d) off.
- Page 23 Other alarm types: h-on – always switched on; h-off – always switched off. Fig. 15. View of the configuration window of analog output Setup of analog output parameters After choosing the group: output 1 or output 2, it is possible to configure following output parameters: assignment of the parameter to the analog output.
- Page 24 working mode of the analog output. Following modes are accessible: normal work lower value, upper value. Both alarms are set up in the normal mode by the manufacturer. An exemplary configuration of the analog output is presented on the fig. 16.e). Fig.
- Page 25 Table 2 Manufac- Parameter description Range/value turer value Ratio of the current 1...10000 transformer Ratio of the voltage 1...4000 transformer - 15 minutes’ walking window (recording in the archive every 15 minutes) - measurement synchronized with the clock every Synchronization of the 15 minutes, walking active mean power:...
- Page 26 Switching delay of the 0...300 alarm 2 Quantity on the con- 0...34 (acc. to the table 1) tinuous No 1 Lower value of the input range in % of the -120.0...120.0% 0.0% rated range of the input No 1 Upper value of the input range in % of the -120.0...120.0% 100.0%...
- Page 27 Upper value of the output range of the 0.01...20.00 mA 20 mA output No 2 normal work, the lower value of the output Manual switching of the range No 2 is set up, analog output 2: normal work the upper value of the output range No 2 is set up.
- Page 28 Minimal and Maximal Values After choosing the group: - minimal and maximal values, minimal and maximal values of individual parameters measured by the transducer in the form of a list are displayed (fig. 18.). Fig. 18. View of the window of the min. and max. value group Archive of power profile After choosing the group: - archive of power profile, following informa- tion is displayed:...
- Page 29 Fig. 19. View of the window of the power profile archive group The detailed description of archive operation is described in chapter 6. Information about the Device After choosing the group – infor- mation about the device, follow- ing information is displayed: The device picture, serial number, program version, and a short de- vice description...
-
Page 30: Archive - Power Profile
6. Archive – Power Profile The P43 transducer is equipped with an archive allowing to store up to 1000 measurements of averaged active power. The averaged active power P can be archived with time intervals 15, 30, 60 minutes syn- chronized with the real time clock (0, 15, 30, 45 minutes –... -
Page 31: Serial Interfaces
- 17 device identifying. 8.3. Register Map of the P43 Transducer In the P43 transducer, data are located in 16-bit and 32-bit registers. Process variables and transducer parameters are located in the reg- ister address space in the way depending on the type of the variable... - Page 32 value type. Bits in 16-bit register are numbered in the way depending on the variable value type. Bits in 16-bit registers are numbered from the younger to the older (b0-b15). 32-bit registers contain numbers of float type in the IEEE-745 standard. Register ranges are set in the table 3.
- Page 33 Synchronization of mean active power: 0 –15 minutes’ walking window (recording synchronized every 15 min with the clock.) 4005 0...3 1 – measurement synchronized every 15 min with the clock. 2 – measurement synchronized every 30 min with the clock. 3 –...
- Page 34 -1200...0...1200 Upper value of the input range in 4022 1200 ] of the rated input range No 1 -2000...0...2000 Lower value of the output range 4023 [10 A] of the output No1 [10 μA] Upper value of the output range 4024 2000 1...2000 [10 A]...
- Page 35 4038 0...65535 Active input energy, two younger bytes* Reactive inductive energy, two 4039 0...15258 older bytes* Reactive inductive energy, two 4040 0...65535 younger bytes* Status register – description 4041 0...65535 below 4042 0...65535 Serial number, two older bytes* Serial number, two younger 4043 0...65535 bytes*...
- Page 36 Status register: Bit 15 – „1” – damage of non-volatile memory Bit 14 – „1” – lack of calibration or erroneous calibration Bit 13 – „1” – error of parameter values Bit 12 – „1” – error of energy values Bit 11 –...
- Page 37 7016 7508 Current of phase L2 7018 7509 Active power of phase fazy L2 7020 7510 Reactive power of phase L2 7022 7511 Apparent power of phase L2 7024 7512 Active power factor of phase L2 Reactive power to active power 7026 7513 ratio of phase L2...
- Page 38 7076 7538 Min. mean 3-phase current 7078 7539 Max. mean 3-phase current 7080 7540 Min. 3-phase active power 7082 7541 Max. 3-phase active power 7084 7542 Min. 3-phase reactive power 7086 7543 Max. 3-phase reactive power 7088 7544 Min. 3-phase apparent power 7090 7545 Max.
- Page 39 3-phase active output energy (number of 7126 7563 register 7564 overfills, setting to zero after exceeding 99999999.9 kWh)* 3-phase active output energy (number of 7128 7564 register 7566 overfills, setting to zero after exceeding 99999999.9 kVarh)* 3-phase reactive capacitive energy 7130 7565 (number of register 7564 overfills, setting...
-
Page 40: Examples Of P43 Transducer Programming
3000 9000 Archived value with number 1000 9. Examples of P43 Transducer Programming Example 1 – Programming an Alarm with Hysteresis Program the operation of the alarm 1 in such a way, that at the value 250 V of the phase 1 voltage, the alarm will be switched on, however switched off at the value 210 V. - Page 41 Example 2 – Programming a Unidirectional Continuous Output Program the continuous output 1 operation in such a way that, at the value 4 A of the mean three-phase current, the value 20 mA was on the output, however at the value 0 A of the mean three-phase current, the value 4 mA was on the output.
- Page 42 For the rated execution 3 x 5 /230 V, one must set values from the table 9 Table 9 Regi- Value Meaning ster 4020 24 – 3-phase power (P) -100 – -100.0% (percentage value with one place after the decimal point multiplied by 10) the lower value of the 4021 -800 rated 3-phase power,...
-
Page 43: Technical Data
10. TECHNICAL DATA Measuring Ranges and Admissible Basic Errors Table 10 Measured Basic Measuring range quantity error Current 1/5A L1...L3 0.02...6 A~ ±0.2% Voltage L-N 2.9...276 V~ ±0.2% Voltage L-L 10... 480 V~ ±0.5% Frequency 45.0...100.0 Hz ±0.2% Active power -1.65 kW...1.4 W...1.65 kW ±0.5% Reactive power... - Page 44 Serial Interface: RS-485: address 1...247; mode: 8N2, 8E1, 8O1, 8N1; baud rate: 4.8, 9.6, 19.2, 38.4 kbit/s, USB: 1.1 / 2.0, address 1; mode 8N2; baud rate 9.6 kbit/s, Transmission Protocol: Modbus RTU Energy Pulse Output: output of OC type, passive acc.
- Page 45 - power factor -1...0...1 - analog outputs -24...-20...0...+20...24 mA - ambient temperature -10...23...+55°C - storage temperature -30...+70°C - relative humidity 25...95% (inadmissible condensation) - admissible peak factor: - current - voltage - external magnetic field 0...40...400 A/m - short duration overload 5 sec. - voltage inputs 2Un (max.1000 V) - current inputs...
-
Page 46: Execution Codes
11. EXECUTION CODES Table 11 TRANSDUCER P43 - X XX X Current input In: 1 A (X/1) ............1 5 A (X/5) ............2 Voltage input (phase/phase-to-phase) U n : 57,7/100 V ............1 230/400 V ............2 Supply voltage: 85...253 V a.c./d.c. -
Page 47: Maintenance And Guarantee
Example of Order: When ordering please respect successive code numbers. The code: P43 - 2 2 1 00 8 means: P43 – transducer of network parameters of P43 type 2 – current input In : 5 A (x/5), 2 – input voltage (phase/phase-to-phase) Un = 3 x 230/400 V, 1 –... - Page 50 According to ISO 9001 and ISO 14001 international requirements. All our instruments have CE mark. For more information, please write to or phone our Export Department Lubuskie Zak³ady Aparatów Elektrycznych LUMEL S.A. ul. Sulechowska 1, 65-022 Zielona Góra, Poland Tel.: (48-68) 329 51 00 (exchange) Fax: (48-68) 329 51 01 e-mail:lumel@lumel.com.pl...
Need help?
Do you have a question about the P43 and is the answer not in the manual?
Questions and answers