
Subscribe to Our Youtube Channel
Related Manuals for SPX Radiodetection PCM+


Summary of Contents for SPX Radiodetection PCM+
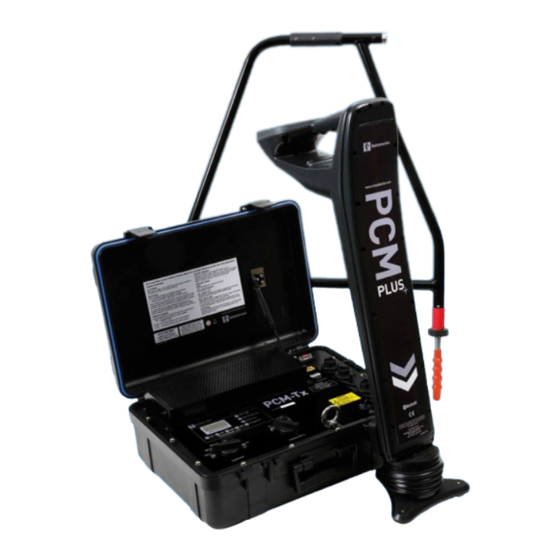
- Page 1 Radiodetection’s world leading Pipeline Current Mapping system Operation Manual Issue 4 October 2009 90/PCMPLUS-APP-ENG/04...
- Page 2 This equipment is NOT approved for use in areas where hazardous gases may be present. SPX and Radiodetection are trademarks of Radiodetection Ltd. and SPX Corporation. Due to a policy Reduce audio level before using headphones to avoid damaging your hearing.
-
Page 3: Table Of Contents
Table of contents Section 5 – Taking Measurements Section 1 – Introduction 5.1 Pipelines and Distribution Systems 1.1 About this manual 5.2 Pipelines and Pipeline defects 1.2 Manual outline 1.3 Overview of the PCM System Section 6 – Applications 6.1 Parallel Pipes Section 2 –... - Page 4 Figure 6.6: Example 3 interpretation Table of figures Figure 6.7: Angled Pipes Example 1 Figure 2.1: Tx Facia Figure 6.8: Parallel Pipes Example 4 Figure 2.2: Frequency Selector Figure 6.9: Parallel Pipes Example 5 Figure 2.3: Rectifier connection to pipeline Figure 7.1: A-Frame Fault-Finding Figure 2.4: PCM connection to pipeline Figure 7.2: A-Frame Fault-Finding...
-
Page 5: Section 1 - Introduction
Section 1 – Introduction 1.1 About this manual Traditional Cathodic Protection (CP) surveys measure the voltage potential of the pipe with respect to the earth This manual provides pipeline surveyors with around it to show that the pipe is protected against comprehensive operating instructions for the PCM corrosion. - Page 6 • Eliminates the need for the operator to perform ‘current spans’ and manual calculations to determine CP currents along the pipeline that require connection to the pipeline. • Is designed for the Pipeline Industry with guidance and support from Gas Industry leaders. •...
-
Page 7: Section 2 - Transmitter Functions
Section 2 – Transmitter Functions 2.2 Frequency Select The PCM TX is a powerful transmitter, capable of sending detectable signals up to 30km (20 miles) from The LCD displays the selected 4Hz output current in the connection point. amps. The PCM Transmitter is housed in a rugged waterproof The three-position rotary case. -
Page 8: Warning Lights And Indicators
2.4 Warning Lights and indicators Switch to a lower current setting until the GREEN Output OK LED illuminates. Allow a few seconds to settle Output voltage indicated by yellow output voltage between selections. level LEDs. If no lights are lit the voltage is below 20V. 2.6 Signal Connection If the 20V LED is lit, the voltage applied is between Warning! Appropriate safety procedures must be... -
Page 9: Figure 2.3: Rectifier Connection To Pipeline
Transmitter to pipeline connections Disconnect both cables for pipeline and anode from the rectifier terminals. Cathodic Protection Rectifier Failure to disconnect cables from rectifier will cause unstable PCM signals, and may cause possible damage Single rectifier providing impressed CP current to single to the PCM transmitter. -
Page 10: Power Supply Connections
Connect the green lead to any large metal object and submerge it in the water. Note: Make sure that the pipeline is not running through the same wet area. Other electrical fixtures can be used to ground the PCM transmitter. However this will cause all electrical cables in the area to carry the PCM Transmitter signal. - Page 11 Vehicle DC to AC Inverter Power supply from a vehicle DC to AC inverter which provides 300W or more at 230V (110V) from 12/24V DC, can also be used. DC Supply This allows the PCM transmitter to be powered from two 12V or one 24V-auto batteries.
-
Page 12: Section 3 - Receiver Operation
Section 3 – Receiver Operation This section provides operating instructions for the Bar Graph: Displays signal strength. receiver. The handheld receiver unit is used to Fault Find 8KFF or ACVG using the Radiodetection locate the pipeline, even in heavily congested areas A-frame. -
Page 13: Software Revision And Calibration Date
3.2 Software revision VIEW: Allows the user to review stored log data. and calibration date ACCE: Selects either SDDA (submersible double depth antenna) or STH (stethoscope) accessories. The current software revision and last calibration date can be accessed on the PCM receiver. -
Page 14: Depth Measurement
Touch Gain Control and Bargraph Taking a Pipeline Current Measurement Control of the gain is via the up and down arrows increase To achieve accurate results the receiver must be kept as or decrease PCM gain level. The lower the gain reading, still as possible and directly over the pipeline while taking the stronger the signal source. - Page 15 Sending readings to a PDA or PC Review Mode When a reading is saved the data is automatically saved Saved data within the PCM can be reviewed. within the locator. If the data is to be sent to a PDA or To review stored logs carry out the following: PC the PDA or PC should have Radiodetection’s PCM •...
-
Page 16: Section 4 - Basic Locating
Section 4 – Basic Locating If the PCM transmitter is connected and switched If the positions of the peak and the null pinpoints on, locate using the ELF or LF frequency modes. If no correspond, it can be assumed that the pinpoint is transmitter is connected use either 50/60Hz to detect precise. -
Page 17: Current Direction
Locate current and 4Hz current measurements can be enables graph of current loss against distance to be taken in the ELF, LF, CPS and 8kHz location frequencies. plotted after downloading to the PC of PDA. On a slope the attachment allows a certain degree of adjustment to help maintain this position. -
Page 18: Using Dbma For Pipeline Current Mapping
The PCM Receiver compensates for depth changes The graphs below show three equal faults and the effects during current measurements, and current readings on a graph showing mA and dBmA. remain constant even when the depth of the pipeline Note that the graph showing mA (Figure 4.8) at first changes. -
Page 19: Figure 4.9: Dbma Fault Graph
Distance Figure 4.9: dBmA fault graph In figure 4.10, the line marked ‘A’ to ‘E’ is the data collected, whilst the line ‘1’ to ‘4’ is the interpreted data. Note that at position ‘A’ the current falls and then returns to almost its original level. -
Page 20: Section 5 - Taking Measurements
Section 5 – Taking Measurements This section demonstrates measurement taking and possible results from surveying various pipe systems. 5.1 Pipelines and Distribution Systems Basic Technique ‘Tie-ins’ and ‘L’ The current will be split between the two lines. i.e. 800 = 700 + 100 The pipeline with the greatest reading indicates where the Figure 5.2: Tie line 2 majority of current is flowing from and is the direction to... -
Page 21: Pipelines And Pipeline Defects
5.2 Pipelines and Pipeline defects Taking Measurements – Distribution Systems Interpretation of Readings and Graphs Below are some typical results, which can be found from using the PCM for CP system diagnosis on a distribution Pipe coating in good condition is shown as very little system. -
Page 22: Section 6 - Applications
Section 6 – Applications This section demonstrates how surveyors can use the PCM system in real-world situations. 6.1 Parallel Pipes New distribution pipe with the old pipe running parallel and about 30cm (12 inches) away. A 1 Amp signal was applied To make the explanation easier the pipe has been divided into section A &... -
Page 23: Figure 6.4: Example 2 Interpretation
Figure 6.4: Example 2 interpretation Figure 6.6: Example 3 interpretation Figure 6.5: Parallel Pipes Example 3 Figure 6.7: Angled Pipes Example 1 Example Example This example (Figure 6.5) demonstrates a typical This example (Figure 6.7) demonstrates a survey on new application where a short piece of parallel pipeline pipeline where the current on one side of the transmitter interfered with the result. -
Page 24: Figure 6.8: Parallel Pipes Example 4
At a distance of about 3km (2 miles) from the transmitter, two readings were obtained, 300mA on the new pipeline and 100mA on the old pipeline. The PCM current arrows pointed towards the PCM Tx indicating that somewhere within the 3km/2 miles the new pipeline had been bonded to the old pipeline. -
Page 25: Section 7 - Pcm + A-Frame
Section 7 – PCM A-Frame This section provides users with operating instructions for the PCM accessory A-Frame. 7.1 About the A-Frame The accessory A-Frame is used with the PCM receiver to precisely pinpoint coating defects and isolation faults. The A-Frame spikes need to make good electrical contact with the ground, preferably with damp, conductive earth. -
Page 26: Comparing Fault Severity
• Retest by taking small movements forwards or backwards until the position is found where the arrows just change direction, and the dB microvolt reading is lowest. This will confirm the fault is directly under the centre of the A-Frame. Turn the A-Frame through 90 degrees so that it is now across the pipeline. -
Page 27: Section 8 - Interpreting Results
Section 8 – Interpreting Results This section provides an overview of interpreting Measurements at Ts, bends, abrupt changes in depth etc. results generated by the PCM Receiver. should be avoided, as there will always be a degree of field distortion at these points. 8.1 Introduction •... -
Page 28: Interpreting Survey Results
8.7 Interpreting survey results Taking a classical situation as shown in Figure 8.1, graph ‘A’ shows the ideal response which is a loss of signal current and a step response, but excludes any effects from fault currents in the ground. Distance In practice, the results obtained require some fault... -
Page 29: For The Pc And Pda
Section 9 – PCM SurveyCERT Software ™ for the PC and PDA System Requirements Radiodetection has engineered the PCM system for interoperability with GPS receivers and industry- standard GIS applications. Pocket PC SurveyCERT is a Radiodetection application for ™ Windows Mobile 6 or earlier. PDA’s and PC’s that can read and chart logged data from Bluetooth. -
Page 30: Section 10 - Appendix
Section 10 – Appendix 10.1 Technical Specifications Peak/Null Features Used to pinpoint target line Receiver Selectable peak & null response Mapping Modes Gain control: Via keypad auto & manual Extra Low Frequency 4Hz+128Hz/98Hz PCM-Tx Transmitter Low Frequency 640Hz/512Hz Frequency Select 8kHz Standard locate frequency from battery powered Radiodetection transmitters... - Page 31 PCM Attachment (A-frame) A-frame for detection of sheath faults on buried pipes and cables. (Includes PCM connection cable). Weight: 1.55kg (3.4lb) Size: 8.5 x 59 x 4.5cm (33 x 39.3 x 1.7 inch) Operation Manual 27...
Need help?
Do you have a question about the Radiodetection PCM+ and is the answer not in the manual?
Questions and answers