
Related Manuals for Bender PEM735


Summary of Contents for Bender PEM735
- Page 1 PEM735 Power quality analyser Software version 2.00.xx Manual PEM735_D00084_02_M_XXEN/06.2020...
- Page 2 Bender GmbH & Co. KG PO Box 1161 • 35301 Grünberg • Germany Londorfer Str. 65 • 35305 Grünberg • Germany Tel.: +49 6401 807-0 © Fax: +49 6401 807-259 Bender GmbH & Co. KG E-Mail: info@bender.de All rights reserved.
-
Page 3: Table Of Contents
Table of Contents 1. Important information ................7 How to use this manual ................... 7 Technical support: Service and support ............ 8 1.2.1 First level support ....................8 1.2.2 Repair service ...................... 8 1.2.3 Field service ......................8 Seminars ....................... 9 Delivery conditions ................... - Page 4 Table of Contents 4.3.2 Front panel mounting ................... 21 Connection of the device ................22 4.4.1 Safety instructions................... 22 4.4.2 Back-up fuses ....................22 4.4.3 Connection of measuring current transformers ........22 Connection details ..................22 Wiring diagram ....................23 Connection diagram voltage inputs ............
- Page 5 Table of Contents 6.3.6 Harmonic voltages ..................51 6.3.7 Interharmonic voltages ................. 54 6.3.8 Mains signalling (ripple control signals) ..........56 6.3.9 Voltage swells ....................58 6.3.10 Voltage sags ...................... 59 6.3.11 Voltage interruptions ..................61 6.3.12 Transient overvoltages .................. 63 7.
- Page 6 Table of Contents 17. Technical data .................. 101 17.1 Standards and certifications ..............104 17.2 Ordering information .................. 104 17.2.1 PEM ........................104 17.2.2 Measuring current transformers ............. 105 18. Glossary and terms ................107 INDEX ......................113 PEM735_D00084_02_M_XXEN/06.2020...
-
Page 7: Important Information
Although great care has been taken in the drafting of this operating manual, it may nev- ertheless contain errors and mistakes. Bender cannot accept any liability for injury to persons or damage to property resulting from errors or mistakes in this manual. -
Page 8: Technical Support: Service And Support
Repair, calibration, testing and analysing Bender products Hardware and software update for Bender devices. Delivery of replacement devices for faulty or incorrectly delivered Bender devices. Extended warranty for Bender devices with in-house repair service resp. replace- ... -
Page 9: Seminars
ZVEI (Zentralverband Elektrotechnik- und Elektronikindustrie e. V.) (German Electri- cal and Electronic Manufacturer's Association) also applies. Conditions of sale and delivery can be obtained from Bender in printed or electronic for- mat. 1.5 Inspection, transport and storage Inspect the dispatch and equipment packaging for damage, and compare the contents of the package with the delivery documents. -
Page 10: Disposal
13 August 2005 must be taken back by the manufacturer and disposed of properly. For more information on the disposal of Bender devices, refer to our homepage at www.bender.de -> Service & support. -
Page 11: Safety Instructions
2.1 General safety instructions Part of the device documentation in addition to this manual is the enclosed " Safety in- structions for Bender products". 2.2 Work activities on electrical installations Only qualified personnel are permitted to carry out the work necessary to install, commission and run a device or system. -
Page 12: Intended Use
As a compact device for front panel mounting it is suitable for replacing analogue indi- cating instruments. The PEM735 can be used in three-phase 4-wire systems, three- phase 3-wire systems and in TN, TT and IT systems (see "Connection diagram voltage in- puts"... -
Page 13: Device Description
Sensitive equipment 3.2 Device features The PEM735 power quality analyser for power quality and energy management is char- acterised by the following features: Class A power analyser, certified according to DIN EN 61000-4-30:2008 Monitoring of the power quality in accordance with EN 50160 ... - Page 14 Device description History memory for minimum and maximum values of current, voltage, energy, power etc. for each month. Inputs and outputs: – 2 digital outputs, – 4 relay outputs, – 8 digital inputs (sampling: 1 kHz) –...
-
Page 15: Versions
– THDU up to the order 40 – Mains signalling – Voltage swells – Voltage sags – Interruptions – Transient overvoltages 3.3 Versions PEM735 100/690 V, 50 Hz; Current input 5 A PEM735 100/690 V, 60 Hz; Current input 5 A PEM735_D00084_02_M_XXEN/06.2020... -
Page 16: Application Example
Device description 3.4 Application example PEM7xx PEM7xx Ethernet Datenbank Modbus TCP Modbus TCP NSHV CP700 1…12 PEM5xx PEM5xx Modbus RCMS 1…12 Modbus TCP Modbus TCP Modbus RTU Modbus RTU RCMS PEM3xx PEM3xx Modbus RTU Modbus RTU Fig. 3.1: Application example PEM735_D00084_02_M_XXEN/06.2020... -
Page 17: Functional Description
Device description 3.5 Functional description The PEM735 power quality analyser is suited for measuring and displaying electrical quantities of electricity networks. The PEM735 can measure currents, voltages, energy consumption and power as well as represent individual harmonic components of cur- rent and voltage for the assessment of voltage and current quality according to EN 50160. - Page 18 Device description PEM735_D00084_02_M_XXEN/06.2020...
-
Page 19: Mounting And Connection
4. Mounting and connection 4.1 Project planning For any questions associated with project planning, please contact Bender: Internet: www.bender.de Telephone: +49-6401-807-0 4.2 Safety instructions Only qualified personnel are permitted to carry out the work necessary to install, commission and run a device or system. -
Page 20: Mounting The Device
Mounting and connection 4.3 Mounting the device 4.3.1 Dimension diagrams Fig. 4.1: Dimension diagram PEM735 (front view) Fig. 4.2: Dimension diagram PEM735 (side view) PEM735_D00084_02_M_XXEN/06.2020... -
Page 21: Front Panel Mounting
Mounting and connection Fig. 4.3: Dimension diagram PEM735 (panel cutout) 4.3.2 Front panel mounting A front-panel cutout of 138 mm x 138 mm is required for the device. 1. Unscrew the screws of the fixing brackets. 2. Slide the fixing brackets along the grooves provided in the enclosure and remove them. -
Page 22: Connection Of The Device
DIN VDE 0100-557 (VDE 0100-557) – Low voltage installations - Part 5: Se- lection and erection of electrical equipment - Chapter 557: Auxiliary circuits. 4.5 Connection details Connect the PEM735 to the supply voltage (terminals A1 and A2 or +/-). Connect terminal "... -
Page 23: Wiring Diagram
Mounting and connection 4.6 Wiring diagram Connect the device according to the wiring diagram. The connections are located on the back of the device. RO13 RO14 RO23 RO24 RO33 RO34 RO43 RO44 Link •l31 10/100M Ethernet DO1+ •l41 DO1- A1/+ DO2+ A2/- DO2-... -
Page 24: Connection Diagram Voltage Inputs
4.7 Connection diagram voltage inputs 4.7.1 Three-phase 4-wire system (TN, TT, IT system) The PEM735 can be used in three-phase 4-wire systems, independent of the type of dis- tribution system (TN, TT, IT system). Fig. 4.5: Connection diagram three-phase 4-wire system (e.g. -
Page 25: Three-Phase 3-Wire System
Mounting and connection 4.7.2 Three-phase 3-wire system The PEM735 can be used in three-phase 3-wire systems. When used in a three-wire system the wiring mode DELTA is required. Fig. 4.6: Connection diagram three-phase-3-wire system (U = 400 V) Fig. 4.7: Connection diagram three-phase-3-wire system (U = 690 V) PEM735_D00084_02_M_XXEN/06.2020... -
Page 26: Connection Via Voltage Transformers
Fig. 4.8: Connection diagram 3-wire system via voltage transformers 4.8 Digital inputs The PEM735 features 8 digital inputs. The inputs are supplied by a galvanically separat- ed DC 24 V voltage. An external circuit providing at least a current of I >... -
Page 27: Digital Outputs Do1
24 V 1PPS Fig. 4.10: Digital inputs (internal connection diagram) Note: PPS = pulse per second, pulse/s 4.9 Digital outputs DO1…2 The PEM735 features two configurable outputs (N/O contacts "solid state relay"). Rated operational max. 30 V DO1+ DO1- voltage... -
Page 28: Relay Outputs Ro1
Mounting and connection 4.10 Relay outputs RO1…4 The PEM735 features four relay outputs. Rated operational AC 250 V or DC 30 V RO13 RO14 voltage RO23 RO24 Rated operational RO33 RO34 current RO43 RO44 Tab. 4.2: Relay outputs 4.11 Modbus TCP (connector pin assignment) -
Page 29: Commissioning And Operation
5. Commissioning and operation 5.1 Getting to know the operating elements PEM735 kvarh ENTER Fig. 5.1: Operating elements Legend to operating elements Element Description kWh LED Pulse output, see "LED display (Energy pulsing)" on page 30 kvarh LED LC display back;... -
Page 30: Led Display (Energy Pulsing)
Tab. 5.1: Legend operating elements 5.2 LED display (Energy pulsing) The PEM735 features two red LEDs on the front side to display active and reactive ener- gy measurements: kWh and kvarh. The LEDs flash each time a certain energy value is reached (1 kWh or 1 kvarh). -
Page 31: Switching On
To switch the device on, follow the steps below: 1. Connect the supply voltage. 2. Set the language The following figure illustrates the language setting schematically so that you can easily set the language when you start working with the PEM735. ENTER (Password) ENTER... -
Page 32: System
The PEM735 can be programmed and queried via Modbus RTU/Modbus TCP. For more details, refer to annex "PEM735-Modbus". In addition, it is possible to integrate the device into Bender's own bus protocol BMS bus (Bender Messgeräte Schnittstelle) via additional communication modules. In this way, communication with (already existing) Bender devices for device parameterisation and visualisation of measured values and alarms can be achieved. -
Page 33: Overview Diagram
Commissioning and operation 5.7 Overview diagram The following diagram will help you navigate through the menus. Main Menu Power Quality > Phasor Diagram ENTER Flicker EN50160 > > > ULn, ULL Voltage Current I1, I2, I3, I4, Iavg > > Waveform U Sum, I Sum, L1, L2, L3 >... - Page 34 Commissioning and operation PEM735_D00084_02_M_XXEN/06.2020...
-
Page 35: Power Quality
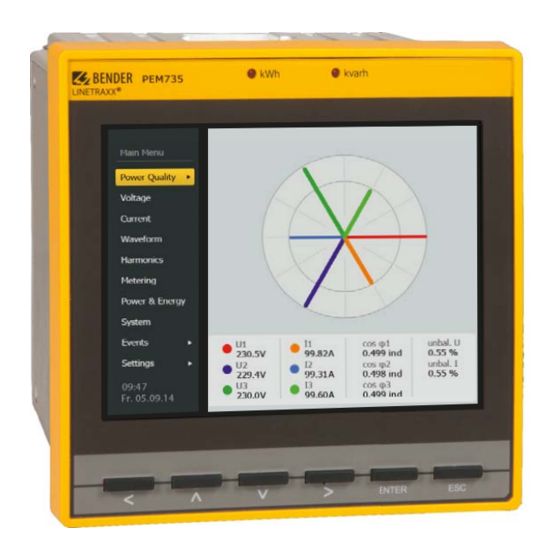
6. Power Quality The PEM735 offers the possibility of evaluating different power quality measurement results directly at the device. Here, both the actual measured values and graphic illus- trations can be displayed. Fig. 6.1: "Power Quality" display (default display screen) In addition to the phasor diagram, an overview of the flicker events and the starting point for the report according to DIN EN 50160 are displayed at the "Power Quality"... -
Page 36: Phasor Diagram
Power Quality 6.1 Phasor diagram The phasor diagram shows the fundamental components of the voltages and currents in relation to each other. The voltages and currents that belong together are depicted in similar colours (light blue and dark blue, light green and dark green, red and orange). In this way, the phase angles between the sinusoidal curves can easily be assigned. -
Page 37: Flicker
Power Quality 6.2 Flicker Flicker can be caused by short-term operating voltage fluctuations. Every occurrence of flicker is recorded for each phase and represented in tabular form on the display. For more detailed description, refer to the standard DIN EN 61000-4-15. Fig. -
Page 38: Report En 50160
Power Quality 6.3 Report EN 50160 The evaluation according to EN 50160 (Voltage characteristics of electricity supplied by public distribution systems) contains the following items: Power Frequency Supply voltage variations Rapid voltage changes Flicker severity ... - Page 39 Power Quality Fig. 6.4: Display "EN 50160" (start page report) The display shows: Display Description Note text Time stamp Observation period for the report Measured values comply with specified threshold values Measured values do not comply with speci- fied threshold values Scroll with arrow buttons;...
-
Page 40: Power Frequency
Power Quality When several reports are stored, navigate through the reports using the buttons. Activate fast automatic scrolling by pressing and holding the arrow button. To navigate through individual parameters in the report, use the buttons. Press "ENTER" to go to the respective subpage. Exit subpage by pressing the "ESC"... - Page 41 Power Quality Fig. 6.5: "Power frequency" (selection of the parameters) Fig. 6.6: "Power frequency" (detailed view) PEM735_D00084_02_M_XXEN/06.2020...
-
Page 42: Supply Voltage Variations
Power Quality The display shows: Display Description Note text Left column: max. ±1 % permissible deviation for 99.5 % of the measured Permissible deviations from the nomi- Limit (%) values (narrow limits) nal frequency (tolerance band) Right column: max. -6 %/ +4 % for all measured values (wide limits) Specifications complied with Partial... - Page 43 Power Quality Fig. 6.7: "Supply voltage variations" (selection of the parameters) Fig. 6.8: "Supply voltage variations" (detailed view) PEM735_D00084_02_M_XXEN/06.2020...
-
Page 44: Rapid Voltage Changes
Power Quality The display shows: Display text Description Note Left column: max. ±10 % per- missible deviation for 95 % of Permissible deviations from the the measured values (narrow Limit (%) nominal voltage U (tolerance band) limits) Right column: -15/+10 % for all measured values (wide limits) Specifications com- plied with... - Page 45 Power Quality Measurement overview Nominal system voltage Rapid voltage changes 5…10 % Basic value r.m.s. value Integration interval 10 ms Observation period 1 week Fig. 6.9: "Rapid voltage changes" (detailed view) The display shows: Display text Description Counts the number of rapid voltage changes for U U1…3 Counts L1…3 EN 50160 does not specify limits for these measured values.
-
Page 46: Flicker Severity
Power Quality 6.3.4 Flicker severity Supply voltage variations cause changes in the luminance of lamps which can create the visual phenomenon called flicker. Above a certain threshold flicker becomes annoy- ing. The annoyance grows very rapidly with the amplitude of the fluctuation. At certain repetition rates even very small amplitudes can be annoying. - Page 47 Power Quality Fig. 6.10: "Flicker severity" (selection of the parameters) Fig. 6.11: "Flicker severity" (detailed view page 1) PEM735_D00084_02_M_XXEN/06.2020...
- Page 48 Power Quality Fig. 6.12: "Flicker severity" (detailed view page 2) The display shows: Display text Description Specifications complied with Specifications complied with? Specifications not complied with Limit Permissible limit Number [%] of the measured values, which must be Tolerance (%) within the tolerance band during a measurement period (≤...
-
Page 49: Voltage Unbalance
Power Quality 6.3.5 Voltage unbalance Under normal operating conditions, during each period of one week, 95 % of the 10 min mean r.m.s. values of the negative phase sequence component (fundamental) of the supply voltage must be within the range of 0…2 % of the positive phase sequence component (fundamental). - Page 50 Power Quality The display shows: Display text Description Specifications complied with Specifications complied with? Specifications not complied with Permissible deviations from the nominal supply Limit (%) voltage (unbalance tolerance band) Number [%] of the measured values, which must Tolerance (%) be within the tolerance band during a measure- ment period.
-
Page 51: Harmonic Voltages
Power Quality 6.3.6 Harmonic voltages Under normal operating conditions, during each period of one week, 95 % of the 10 min mean r.m.s. values of each individual harmonic voltage must be less than or equal to the values given in table 6.1. Resonances may cause higher voltages for an individual har- monic. - Page 52 Power Quality Measurement overview Total harmonic distortion THD (includ- max. 8 % ing harmonics up to the order 40) 95 % of the measured values must be ≤ limit Percentage value Basic value r.m.s. value Integration interval 10 minutes Observation period 1 week Number of measurement intervals 1008...
- Page 53 Power Quality Fig. 6.15: "Harmonic voltages" (detailed view page 2) The display shows: Display text Description Specifications complied with Partial Result Specifications not complied with Total harmonic distortion H2…25 Harmonics 2…25 Limit (%) Permissible limit Measured value of the 95th percentile (P95) during an observation U1…3 P95 Value (%) period 95 % of the measured values H…...
-
Page 54: Interharmonic Voltages
Power Quality Use the buttons to navigate between the individual pages of the interharmonics. Activate fast automatic scrolling by pressing and holding the arrow button. Press the "ENTER" or the "ESC" button to return to the report overview. 6.3.7 Interharmonic voltages An interharmonic voltage is a sinusoidal voltage with a frequency not equal to an inte- ger multiple of the fundamental frequency (e.g. - Page 55 Power Quality Display text Description Note Measured value of the 95th percentile (P95) U1…3 P95 Value (%) Percentage during an observation period U1…3 Max Value (%) Maximum measured value per phase Percentage Total harmonic distortion (interharmonics) Percentage H1…H25 Interharmonics H1…25 Percentage Use the buttons to navigate between the individual pages of...
-
Page 56: Mains Signalling (Ripple Control Signals)
For 99 % of a day the 3 s mean value of the signal voltages must be less or equal to the values given in Fig. 6.17. PEM735 can detect the voltage of the signals for three different frequency ranges. The limits of the voltages for these frequencies are stored in the device according to Fig. - Page 57 Power Quality Fig. 6.18: "Mains signalling" (detailed view page 1) The display shows: Display text Description Note The three frequencies used can Frequency of the ripple control Frequency (Hz) be adjusted via Modbus or the signals web interface. Specifications complied with Partial Result Specifications not complied with Permissible deviations (toler-...
-
Page 58: Voltage Swells
Power Quality Display text Description Note Measured value of the 95th per- U1…3 P95 Value (V) centile (P95) during an observa- Percentage tion period Latest measured value U U1…3 Actual (%) Percentage L1…3 6.3.9 Voltage swells Voltage swells are typically caused by switching operations and load disconnections. The nominal supply voltage U is used as reference. -
Page 59: Voltage Sags
Power Quality The display shows: Display text Description Duration of the swells (ms) Voltage swells u Voltage swell level in % For voltage swell classification, the percentages of the voltage levels u are summarised as follows: u ≥ 200 200 > u ≥ 160 160 >... - Page 60 Power Quality Fig. 6.20: Voltage sags (detailed view on page 1 of 3) For voltage sag classification, the percentages of the voltage levels u are summarised as follows: 90 ≥ u ≥ 80 80 > u ≥ 70 70 > u ≥ 40 40 >...
-
Page 61: Voltage Interruptions
Power Quality Use the buttons to navigate through the individual pages of the voltage sags. Press the "ENTER" or the "ESC" button to return to the report overview. EN 50160 does not specify limits for these measured values. 6.3.11 Voltage interruptions Interruptions are, by their nature, very unpredictable and variable depending on place and time. - Page 62 Power Quality The display shows: Display text Description Counts Number of counts during the observation period Classification of the voltage interruption according to duration 1s ≤ t < 180 s (in this case, it varies between 1 second and 3 minutes) Voltage interruption evaluation On polyphase systems, a voltage interruption begins when the r.m.s.
-
Page 63: Transient Overvoltages
Power Quality 6.3.12 Transient overvoltages Transient overvoltages at the supply terminals are generally caused by lightning (in- duced overvoltage) or by switching in the system. Fig. 6.22: Transient overvoltages The display shows: Display text Description Counts Number of counts during the observation period These settings can only be carried out via the communication interface (see annexes "Modbus"... - Page 64 Power Quality Note 2: The energy content of a transient overvoltage varies considerably according to the origin. An induced overvoltage due to lightning generally has a higher amplitude but lower energy content than an overvoltage caused by switching, because of the generally longer duration of such switching overvoltages.
-
Page 65: Voltage
7. Voltage Overview of the measured voltages U or U as well as the average voltage (U ) from U1…U3 as a bar graph. Fig. 7.1: "Voltage" display Use the buttons to switch between the individual displays. The displayed minimum and maximum values refer to the current month. To reset the minimum and maximum values, press and hold the "ESC"... - Page 66 Voltage PEM735_D00084_02_M_XXEN/06.2020...
-
Page 67: Current
8. Current Overview of measured and calculated currents I as well as the average current (I 0…4 as a bar graph. Fig. 8.1: "Current" display Use the buttons navigate between the displays IL and I0/I4. The displayed minimum and maximum values refer to the current month. To reset the minimum and maximum values, keep the "ESC"... - Page 68 Current PEM735_D00084_02_M_XXEN/06.2020...
-
Page 69: Waveform
9. Waveform In addition to the numeric values, the waveform recorder represents the waves of the measured voltages and currents on the display. Here, a comprehensive view of all volt- ages U and currents I and the consideration of individual waves is possible. L1…3 1…3 Fig. - Page 70 Waveform Press the "ENTER" button to enable full screen display mode: Fig. 9.2: "Waveform" display (full screen display) Fig. 9.3: "Waveform" display (freeze image) PEM735_D00084_02_M_XXEN/06.2020...
- Page 71 Waveform In full screen mode, a freeze image of the latest waves can be generated by pressing the "ENTER" button (stop) to be able to analyse the graph in more detail. Pressing the "EN- TER" button again cancels the freeze image and you return to the full screen display mode.
- Page 72 Waveform PEM735_D00084_02_M_XXEN/06.2020...
-
Page 73: Harmonics
10. Harmonics Overview of the measured harmonics as bar graphs. Use the buttons to switch between the individual displays. There are two possibilities to calculate the individual harmonic distortion (RMS and dis- tortion). This setting can be made directly on the device: Settings >... - Page 74 Harmonics Fig. 10.1: "Harmonics" display (voltages of a phase) Fig. 10.2: "Harmonics" display (currents of a phase) PEM735_D00084_02_M_XXEN/06.2020...
- Page 75 Harmonics Fig. 10.3: "Harmonics" display (currents I4) When "RMS" is selected, the harmonics are displayed as r.m.s. values (V or A). When "Distortion" is selected, the harmonics are displayed as a percentage value. PEM735_D00084_02_M_XXEN/06.2020...
- Page 76 Harmonics PEM735_D00084_02_M_XXEN/06.2020...
-
Page 77: Metering
11. Metering Measured values for voltages, currents, r.m.s. values and fundamentals in tabular form. Use the buttons to switch between the individual displays. Display Parameter Measured values Note Act, Min, Max L1…3 Act, Min, Max L1L2…L3L1 Shows only RMS voltages. Act, Min, Max 1…3 Act, Min, Max... - Page 78 Metering Fig. 11.1: "Metering" display (voltages) Fig. 11.2: "Metering" display (currents) PEM735_D00084_02_M_XXEN/06.2020...
- Page 79 Metering Fig. 11.3: "Metering" display (r.m.s. values) Fig. 11.4: "Metering" display (fundamentals) PEM735_D00084_02_M_XXEN/06.2020...
- Page 80 Metering PEM735_D00084_02_M_XXEN/06.2020...
-
Page 81: Power & Energy
12. Power & Energy Display of the fundamental values of the active and reactive power as numerical values and as vectors in the quadrants Q1…4. The power values are displayed either as total measurement (total) or for each individual conductor L1…3. Fig. - Page 82 Power & Energy Fig. 12.2: "Power & Energy" display (phasor diagram) Set calculation power factor λ convention on the device: Settings > Advanced > PF Convention Set calculation apparent power on the device: Settings > Advanced >S Calculation For explanations on the calculation of the power factor and the apparent power, refer to page 94.
-
Page 83: System
13. System The PEM735 features 8 digital inputs, 2 digital outputs and 4 relay outputs. These are displayed directly on the device. Fig. 13.1: "System" display Inputs (DI) The device features eight digital inputs which are internally operated with DC 24 V. - Page 84 System PEM735_D00084_02_M_XXEN/06.2020...
-
Page 85: Events
14. Events Access to stored events of the recorders (SOE and PQLog). In addition to the time stamp, the event description in clear text format and the associ- ated values are displayed. Fig. 14.1: "Events" display (start page SOE) Press "ENTER" to go back one menu level. Use the buttons to switch between the event and the PQ recorder. - Page 86 Events Fig. 14.2: "Events" display (SOE, page 1 of 205) Fig. 14.3: "Events" display (PQLog) PEM735_D00084_02_M_XXEN/06.2020...
-
Page 87: Settings
15. Settings Here, general information about the device is displayed. In addition, parameters for the device can be set (password protected). Press "ENTER" to go to the"Settings" menu. Use the buttons to navigate between the individual items. To change parameters, press the "ENTER" button for password request. After entering the correct password, press the "ENTER"... -
Page 88: Basic
Settings 15.2 Basic Fig. 15.2: Settings ("Basic" menu item) Before changing the settings, the correct password must be entered (factory setting: 000000). Fig. 15.3: "Settings" display (enter password) PEM735_D00084_02_M_XXEN/06.2020... - Page 89 Settings Press the buttons to change a number. Use the buttons to navigate between the individual digits of the password. Confirm the password with the "ENTER" button. You can set the password yourself (Settings > Others > Password). After the password has been entered successfully, changes can be made to the settings. The currently selected parameter is highlighted in black.
-
Page 90: Ethernet
Settings 15.2.1 Ethernet The settings for the Ethernet interface can be defined in this menu. The following pa- rameters have to be set: IP address Subnet mask Gateway Fig. 15.5: "Settings" display (Ethernet) Press "ENTER" to enter the setting mode (after successful password entry). Select the field to be edited (highlighted in black) using the arrow buttons. - Page 91 Settings Fig. 15.6: "Settings" display Ethernet, change settings) PEM735_D00084_02_M_XXEN/06.2020...
-
Page 92: Com (Communication Interface)
Settings 15.2.2 COM (communication interface) PEM735 features two communication interfaces the settings of which can be made di- rectly on the device. Fig. 15.7: "Settings" display (COM) The display shows: Display text Description COM1: time source or Modbus Protocol COM2: gateway or Modbus... -
Page 93: Advanced
Settings 15.2.3 Advanced In the advanced settings, the calculation method for the power factor λ and apparent power S can be defined. In addition, the calculation settings for the harmonics are made here. Fig. 15.8: "Settings" display (Advanced) The display shows: Display text Description Note... - Page 94 Settings Explanation of power factor λ conventions: Reactive power import Quadrant 2 Quadrant 1 Power factor (-) Power factor (+) Active power export (-) Active power import (+) Reactive power import (+) Reactive power import (+) Active power import Quadrant 3 Quadrant 4 Power factor (-) Power factor (+)
-
Page 95: Time (Setting Date And Time)
Settings 15.2.4 Time (setting date and time) Fig. 15.10: "Settings" display (Time) The display shows: Display text Description Note Time Local time Indication in hh:mm:ss Time Zone Global time zone Relative to GMT Date Current date DD-MM-YYYY, MM-DD-YYYY, YYYY-MM- Date Format Date format The clock is automatically set by a connected CP700. -
Page 96: Others
Settings 15.2.5 Others The display properties and the device language as well as a new password can be set in this menu. Setting a password: Press the buttons to change a number. Use the buttons to navigate between the individual digits of the password. - Page 97 Settings Display text Description Note Language Display language German, Russian, English six-digit, Password Set and confirm new password one number 0…9 per digit When LCD Timeout is set to 0 min , the background lighting remains permanently on (max 24 h). PEM735_D00084_02_M_XXEN/06.2020...
- Page 98 Settings PEM735_D00084_02_M_XXEN/06.2020...
-
Page 99: Other
16. Other 16.1 Resetting to factory settings If necessary, the device can be reset to the state upon delivery. Factory settings: Press and hold the "<" and "ESC" buttons simultaneously for 3 s and then confirm the dialogue box (English). Previous successful software updates remain unchanged. -
Page 100: Data Export Via Ftp
can be downloaded from the device via FTP. FTP access is read-only; changes or mem- ory deletions are not possible. FTP access Server: IP address of the PEM735 User name: anonymous (cannot be changed) ... -
Page 101: Technical Data
17. Technical data Insulation coordination Measuring circuit Rated insulation voltage............................600 V Overvoltage category................................III Pollution degree.................................2 Supply circuit Rated insulation voltage............................300 V Overvoltage category.................................II Pollution degree.................................2 Supply voltage Rated supply voltage ........................AC/DC 95…250 V Frequency range of ..........................DC, 47…440 Hz Power consumption ............................. - Page 102 Technical data Transformation ratio of the measuring current transformer, secondary..............1…5 A Transformation ratio of the measuring current transformer, primary ............1…30,000 A Accuracies Phase voltage .........................±0.1 % L1-N L2-N L3-N Current ...................................±0.1 % Neutral current ..............................±0.1 % Frequency .................................±0.005 Hz Phasing ..................................
- Page 103 Technical data Switching elements 2 electronic outputs (DO) ..........................max. 30 V ..............................50 mA 4 relay outputs (RO)..........................4 x N/O contacts Operating principle ......................N/O operation Rated operational voltage .....................AC 250 V, DC 30 V Rated operational current ........................3 A Minimum contact rating ..................
-
Page 104: Standards And Certifications
Technical data 17.1 Standards and certifications PEM735 was designed in accordance with the following standards: EN 50160 Voltage characteristics of electricity supplied by public distribution networks DIN EN 61000-4-30:2008 (VDE 0847-4-30) Electromagnetic compatibility (EMC) Part 4-30: Testing and measurement techniques – Power quality measurement meth-... -
Page 105: Measuring Current Transformers
Technical data 17.2.2 Measuring current transformers All measuring devices of the PEM series can be operated with standard measuring cur- rent transformers (1 A or 5 A). It must be ensured that the measuring device as well as the used measuring current transformers are of class 0.5 S or higher to comply with an accuracy class (e.g. - Page 106 Technical data Primary Secondary Accuracy Type Model Art. No. current (A) current (A) WL4001 CL.0.5 CTB41 B98086025 WL4005 CL.1 CTB41 B98086026 WL4005 CL.0.5 CTB41 B98086027 WL4001 CL.1 CTB41 B98086028 WL5005 CL.1 CTB41 B98086029 WL5005 CL.0.5 CTB41 B98086031 WL5001 CL.1 CTB41 B98086032 WL5001 CL.0.5 CTB41...
-
Page 107: Glossary And Terms
18. Glossary and terms Abbreviation/ Long form Description Term Communication interface 1 (Modbus or time source) COM1, COM2 Communication Communication interface 2 (Modbus or gate- way) Digital Input Digital input (2.4 mA, DC 24 V) Digital Output Digital output (max. 50 mA, max. 80 V) Square root of the arithmetic mean of the squares of the instantaneous values of a quantity r.m.s. - Page 108 Glossary and terms Abbreviation/ Long form Description Term Long-term flicker (2-hour value, cubic average perceptibility unit value from 12 P long term Pulse Per Second Pulse per second Power Quality perceptibility unit Short-term flicker; 10-minute value short term Reactive power root mean square r.m.s.
- Page 109 Glossary and terms Abbreviation/ Long form Description Term Starts when the U voltage of at least one channel is above the swell threshold; ends when the U voltage on all measured channels is Voltage swell (polyphase sys- equal to or below the swell threshold minus the tem) hysteresis voltage;...
- Page 110 Glossary and terms Abbreviation/ Long form Description Term Total Odd Harmonic TOHD Total odd harmonic distortion Distortion Short-term alterations superimposed to the Transients supply voltage, can be recorded up to ±750 V Zero sequence component Zero sequence component (ratio expressed as a percentage);...
- Page 111 Glossary and terms Abbreviation/ Long form Description Term r.m.s. value, refreshed every half-cycle (r.m.s. Half-cycle r.m.s. value measured over one cycle, commencing at rms(1/2) voltage a fundamental zero crossing) Interharmonic between the (n-1)th and nth har- Interharmonics monic PEM735_D00084_02_M_XXEN/06.2020...
- Page 112 Glossary and terms PEM735_D00084_02_M_XXEN/06.2020...
-
Page 113: Index
INDEX - Create screenshot 99 - Language 96 - LCD Timeout 96 Distortion 73 Active energy 81 Advanced settings 93 Apparent power calculation 94 Energy pulsing Application example 16 - LED display 30 Area of application 13 Ethernet 90 Automatic scrolling 40 Events 85 Back-up fuses 22 Factory settings 99... - Page 114 INDEX Settings 87 Setup 87 Measured quantities 14 SOE 85 Measuring current transformers 22 Start page 35 Menu overview 33 Supply voltage Metering 77 - variations 42 Modbus TCP (connector pin assignment) 28 Support 8 Mounting 19 Switching on (commissioning) 31 System 32 Operating elements 29 Output...
- Page 116 Genehmigung des Herausgebers. only with permission of the publisher. Subject to change! Änderungen vorbehalten! Bender GmbH & Co. KG Bender GmbH & Co. KG PO Box 1161 • 35301 Grünberg • Germany Postfach 1161 • 35301 Grünberg • Deutschland Londorfer Str.
Need help?
Do you have a question about the PEM735 and is the answer not in the manual?
Questions and answers