
Subscribe to Our Youtube Channel
Related Manuals for Bender PEM735


Summary of Contents for Bender PEM735
- Page 1 Manual PEM735 Universal measuring device 100…690 V, 50 Hz Software version 2.00.xx PEM735_D00084_00_M_XXEN/02.2015 B 9310 0735...
- Page 2 Postfach 1161 • 35301 Gruenberg • Germany Bender GmbH & Co. KG Tel.: +49 6401 807-0 All rights reserved. Fax: +49 6401 807-259 Reprinting only with permission E-Mail: info@bender.de of the publisher. Subject to change! www.bender.de Photos: Bender and bender systembau archives.
-
Page 3: Table Of Contents
Table of Contents 1. Making effective use of this document ..........7 How to use this manual ................... 7 Technical support: Service and support ............ 8 Seminars ....................... 9 Delivery conditions, guarantee, warranty and liability ......9 2. Safety ...................... 11 Intended use ..................... - Page 4 Table of Contents Wiring diagram ....................22 Connection diagram voltage inputs ............23 4.7.1 Three-phase 4-wire system (TN, TT, IT system) ........23 4.7.2 Three-phase 3-wire system ................23 4.7.3 Connection via voltage transformers ............24 Digital inputs ..................... 25 Digital outputs DO1…2 ................
- Page 5 Table of Contents 7.3.10 Dips ........................62 7.3.11 Interruptions ..................... 64 7.3.12 Transient Overvoltages ................. 66 8. Voltage ....................69 9. Current ....................71 10. Waveform .................... 73 11. Harmonics ................... 77 12. Metering ....................81 13. Power & Energy .................. 85 14.
-
Page 7: Making Effective Use Of This Document
Although great care has been taken in the drafting of this operating manual, it may nev- ertheless contain errors and mistakes. Bender cannot accept any liability for injury to persons or damage to property resulting from errors or mistakes in this manual. -
Page 8: Technical Support: Service And Support
Repair, calibration, testing and analysing Bender products Hardware and software update for Bender devices. Delivery of replacement devices for faulty or incorrectly delivered Bender devices. Extended warranty for Bender devices with in-house repair service resp. replace- ... -
Page 9: Seminars
**Mo-Thu 7.00 a.m. - 8.00 p.m., Fr 7.00 a.m. - 13.00 p.m 1.3 Seminars Bender would be happy to provide training in respect of the use of the universal meas- uring device. Current dates of training courses and workshops can be found on the Internet at http:/ /www.bender-de.com ->... - Page 10 Making effective use of this document PEM735_D00084_00_M_XXEN/02.2015...
-
Page 11: Safety
As a compact device for front panel mounting, it is suitable to replace analogue indicat- ing instruments. PEM735 is suitable for 2, 3 and 4-wire systems and can be used in TN, TT and IT systems. The current measurement inputs of the PEM are connected via exter- nal …/1 A or …/5 A measuring current transformers. - Page 12 All work activities on electrical installations as well as installation DANGER activities, commissioning activities and work activities with the device in operation may only be carried out by electrically skilled persons! Only use Bender devices: – As intended – In perfect working order –...
-
Page 13: Device Description
Sensitive equipment 3.2 Device features The universal measuring device PEM735 for power quality and energy management is characterised by the following features: Class A power analyser, certified according to DIN EN 61000-4-30 Monitoring the power quality in accordance with DIN EN 50160 ... - Page 14 Device description Password protection History memory for minimum and maximum values of current, voltage, energy, power etc. for each month. Inputs and outputs: – 2 digital outputs, – 4 relay outputs, – 8 digital inputs (sampling: 1 kHz) –...
-
Page 15: Versions
– Harmonic voltage for harmonics up the order 63 in % or r.m.s. value – Interharmonic voltage for harmonics up to the order 63 in % or r.m.s. value – Mains signaling – Swell overvoltages – Dips – Interruptions – Transient overvoltages 3.3 Versions PEM735 100/690 V; Current input 5 A PEM735_D00084_00_M_XXEN/02.2015... -
Page 16: Application Example
Device description 3.4 Application example PEM7xx PEM7xx Ethernet Fileserver Modbus TCP Modbus TCP NSHV CP700 1…12 PEM5xx PEM5xx Modbus RCMS 1…12 Modbus TCP Modbus TCP Modbus RTU Modbus RTU RCMS PEM3xx PEM3xx Modbus RTU Modbus RTU Fig. 3.1: Application example PEM735_D00084_00_M_XXEN/02.2015... -
Page 17: Description Of Function
Device description 3.5 Description of function The digital universal measuring device PEM735 is suited for measuring and displaying electrical quantities of electricity networks. The PEM735 can measure currents, voltag- es, energy consumption and power as well as representing individual harmonic com- ponents of current voltage for the voltage and current quality assessment in accordance with DIN EN 50160. - Page 18 Device description PEM735_D00084_00_M_XXEN/02.2015...
-
Page 19: Installation And Connection
Installation and connection 4. Installation and connection 4.1 Project planning For any questions associated with project planning, please contact Bender: Internet: www.bender-de.com Telephone+49-6401-807-0 4.2 Safety instructions Only electrically skilled persons are allowed to connect and commission the device. Such persons must have read this manual and understood all instructions relating to safety. -
Page 20: Front Panel Mounting
Installation and connection Fig. 4.2: Dimension diagram PEM735 (side view) Fig. 4.3: Dimension diagram PEM735 (panel cutout) 4.3.2 Front panel mounting A front-panel cutout of 138 mm x 138 mm is required for the device. 1. Loosen the screws of the fixing brackets. -
Page 21: Connection Of The Device
Installation and connection 5. Tighten the screws of the brackets. 6. Check the device to ensure that it is firmly installed in the front panel. The device is installed. 4.4 Connection of the device 4.4.1 Safety instructions Danger of electric shock! Follow the basic safety rules when working with electricity. -
Page 22: Connection Details
Installation and connection 4.5 Connection details Connect the PEM735 to the supply voltage (terminals A1 and A2 resp. +/-). Con- nect terminal " " to the protective conductor. Power protection by a 6 A fuse. If being supplied from an IT system, both lines ... -
Page 23: Connection Diagram Voltage Inputs
4.7 Connection diagram voltage inputs 4.7.1 Three-phase 4-wire system (TN, TT, IT system) The universal measuring device PEM735 can be used in three-phase-4-wire systems, in- dependent of the type of distribution system (TN, TT, IT system). Fig. 4.5: Connection diagram three-phase 4-wire system (e.g. -
Page 24: Connection Via Voltage Transformers
Fig. 4.6: Connection diagram three-phase-3-wire system 4.7.3 Connection via voltage transformers The coupling of the voltage transformers allows the use of the measuring device in me- dium and high-voltage systems. The transformation ratio can be adjusted in the PEM735 (1…1.000.000). PEM735_D00084_00_M_XXEN/02.2015... -
Page 25: Digital Inputs
Fig. 4.7: Connection diagram 3-wire system via voltage transformers 4.8 Digital inputs The universal measuring device PEM735 provides 8 digital inputs. The inputs are sup- plied by a galvanically isolated DC 24 V voltage. An external circuit providing at least a current of I >... -
Page 26: Digital Outputs Do1
1PPS Fig. 4.9: Digital inputs (internal connection diagram) Note: PPS = pulse per second, pulse/s 4.9 Digital outputs DO1…2 The universal measuring device PEM735 features two configurable outputs (N/O con- tacts „"Solid State Relay"). Rated operational max. 30 V DO1+... -
Page 27: Relay Outputs Ro1
Installation and connection 4.10 Relay outputs RO1…4 The universal measuring device PEM735 features four relay outputs. Rated operational 250 V AC/DC RO13 RO14 voltage RO23 RO24 Rated operational RO33 RO34 current RO43 RO44 Tab. 4.2: Relay outputs 4.11 Modbus TCP (connector pin assignment) - Page 28 Installation and connection PEM735_D00084_00_M_XXEN/02.2015...
-
Page 29: Commissioning
The universal measuring device PEM735 can be programmed and queried via Modbus RTU/Modbus TCP. For details refer to the Annex "PEM735-Modbus". In addition, it is possible to integrate the device into Bender's own bus protocol BMS bus (Bender Messgeräte Schnittstelle) via additional communication modules. In this way, communication with (already existing) Bender devices for device parameterisation and visualisation of measured values and alarms can be achieved. - Page 30 Commissioning Help and examples of system integration can be found on the Bender homepage www.bender.de or you can contact our Bender Service for personal advice (see chapter " 1.2 Technical support: Service and support"). PEM735_D00084_00_M_XXEN/02.2015...
-
Page 31: Operation
Operation 6. Operation 6.1 Getting to know the operating elements PEM735 kvarh ENTER Fig. 6.1: Operating elements Legend to operating elements Element Description LED kWh Pulse output, see "LED indication (Energy pulsing)" on page 32. LED kvarh LC display Back;... -
Page 32: Led Indication (Energy Pulsing)
Operation switch to the submenu "ENTER" but- "freeze" waveform recorder depending on the submenu other function (information on the display) Leave submenu; "Unfreeze" waveform recorder "ESC" button depending on the submenu other function (information on the display) Tab. 6.1: Legend to operating elements 6.2 LED indication (Energy pulsing) The universal measuring device features two red LEDs on the front side to display active and reactive energy measurements: kWh and kvarh. -
Page 33: Overview Diagram
Operation 6.3 Overview diagram The following diagram will help you navigate through the menus. Main Menu Power Quality > Phasor Diagram ENTER Flicker EN50160 > > > ULn, ULL Voltage Current > > I1, I2, I3, I4, Iavg Waveform > >... - Page 34 Operation PEM735_D00084_00_M_XXEN/02.2015...
-
Page 35: Power Quality
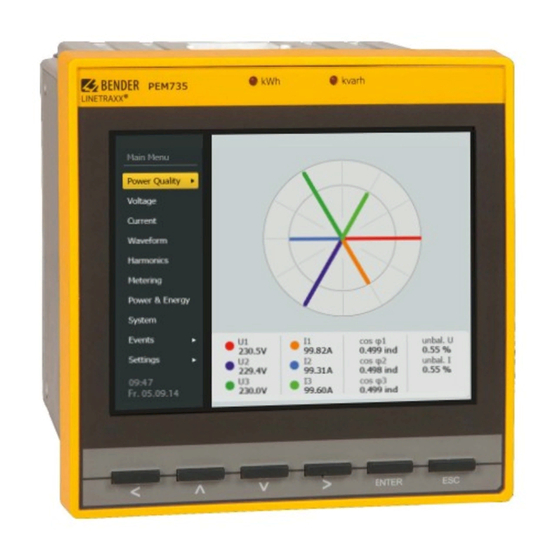
Power Quality 7. Power Quality The PEM735 offers the possibility of evaluating different power quality measurement results directly at the device. Here, both the actual measured values and graphic illus- trations can be displayed. Fig. 7.1: Display "Power Quality" (default display screen) In addition to the phasor diagram, an overview of the flicker events and the starting point for the report (according to DIN EN 50160) are displayed under the menu "Power... -
Page 36: Phasor Diagram
Power Quality 7.1 Phasor diagram The phasor diagram shows voltages and currents in relation to each other. The voltages and currents that belong together are depicted in similar colours (light-blue and dark- blue, light-green and dark-green, red and orange). In this way, the phase angles be- tween the sinusoidal curves can easily be assigned. -
Page 37: Flicker
Power Quality 7.2 Flicker Flicker can be caused by short-term operating voltage fluctuations. Every occurrence of flicker is recorded for each phase and represented in tabular form on the display. For detailed description refer to the standard DIN EN 61000-4-15. Fig. -
Page 38: Din En 50160 Report
Power Quality The display shows: Display text Description Note Actual measured value Maximum measured value over an observation period P short-term PST, short-term flicker 10-minute value P long-term Plt, long-term flicker 2-hour value, cubic average of 12 Pst Timestamp of the maximum Timestamp value. - Page 39 Power Quality The DIN EN 50160 report clearly represents the measured values of frequencies, voltag- es, waveforms and the symmetry of the line voltages directly at the device. Since there are a large number of measurement values, you have to switch between the different display representations using the arrow buttons.
-
Page 40: Power Frequency
Power Quality The display shows: Display text Description Note Timestamp Observation period for the report Measured values comply with the specified threshold values Measured values do not comply with the specified threshold values Scroll with arrow buttons; Results are shown on several sub- Detail Press "ENTER"... - Page 41 Power Quality Measurement overview 50 Hz ± 1 % (during min. 99.5 % of a year) 49.5…50.5 Hz –6/+4 % (for all measured values of a year) 47…52 Hz Basic value Mean value Integration interval 10 s Observation period 1 week Number of intervals 60480 Fig.
- Page 42 Power Quality Fig. 7.6: "Power Frequency" (subpage) The display shows: Display text Description Note Left column: max. ±1 % permissible Permissible deviations from deviation for 99.5% of the measured Limit (%) the nominal frequency (toler- values (narrow limits) ance band). Right column: max.
-
Page 43: Supply Voltage Variations
Power Quality 7.3.2 Supply Voltage Variations The voltage must not differ from the nominal voltage U by more than 10% during 95% of the observation time (= one week) (narrow limits). All measured values of a year must be in the interval of 195.5…253.0 V (wide limits). - Page 44 Power Quality Fig. 7.7: Supply voltage variations (selection of the parameters) Fig. 7.8: Supply voltage variations (subpage) PEM735_D00084_00_M_XXEN/02.2015...
-
Page 45: Rapid Voltage Changes
Power Quality The display shows Display text Description Note Left column: max. 10 % per- missible deviation for 95 % of Permissible deviations from the the measured values (narrow nominal voltage U (tolerance Limit (%) limits) Right column: -15/+10 % for band) all measured values (wide lim- its) - Page 46 Power Quality Measurement overview 230 V Rapid voltage changes 5…10 % Basic value r.m.s. value Integration interval 10 ms Observation period 1 day Fig. 7.9: Rapid voltage changes (subpage) The display shows Display text Description Counts the number of rapid voltage changes for U U1…3 counts L1…3 DIN EN 50160 does not specify limits for these measured values.
-
Page 47: Flicker Severity
Power Quality 7.3.4 Flicker Severity (according to DIN EN 50160) Voltage fluctuations cause changes in the luminance of lamps which can create the vis- ual phenomenon called flicker. Above a certain threshold flicker becomes annoying. The annoyance grows very rapidly with the amplitude of the fluctuation. At certain rep- etition rates even very small amplitudes can be annoying. - Page 48 Power Quality Fig. 7.10: Flicker severity (selection of the parameters) Fig. 7.11: Flicker severity (subpage1) PEM735_D00084_00_M_XXEN/02.2015...
- Page 49 Power Quality Fig. 7.12: Flicker severity (subpage 2) The display shows: Display text Description Limit Permissible limit Number [%] of the measured values, which must be in the Tolerance (%) tolerance band within one measurement period (≤ 1) Measured flicker value of the 95 percentile (P95) during U1…3 P95 value an observation period...
-
Page 50: Voltage Unbalance
Power Quality 7.3.5 Voltage Unbalance (according to DIN EN 50160) Under normal operating conditions, during each period of one week, 95 % of the 10 min mean r.m.s. values of the negative phase sequence component (fundamental) of the supply voltage must be within the range of 0…2 % of the positive phase sequence component (fundamental). - Page 51 Power Quality Measurement overview Voltage unbalance (ratios of the negative to the positive 2 % , in special cases 3 % phase sequence component) 95 % of the measured values in the meas- Percentage urement period Basic value r.m.s. value Integration interval 10 minutes Observation period...
-
Page 52: Harmonic Voltage
Range of measured values for Unbalance u2 unbalance u2 Range Measurement interval: 10 min mean values PEM735 can determine the unbalance for the zero sequence and the negative se- quence component. Unbalance u = (negative sequence/positive sequence component) x 100 % Unbalance u = (zero sequence/positive sequence component) x 100 % 7.3.6... - Page 53 Power Quality Under normal operating conditions, during each period of one week, 95% of the 10 min mean r.m.s. values of each individual harmonic voltage must be less than or equal to the values given in table 7.1 . Resonances may cause higher voltages for an individual har- monic.
- Page 54 Power Quality Measurement overview Total harmonic distortion THD (including max. 8 % harmonics up to the order 40) 95 % of the measured values must be Percentage smaller than or equal to the limit. Basic value r.m.s. value Integration interval 10 minutes Observation period 1 week...
- Page 55 Power Quality Fig. 7.15: Harmonic voltage (subpage 2) The display shows: Display text Description Total harmonic distortion H1…25 Harmonics 1…25 Limit (%) Permissible limit U1…3 P95 Value (%) Measured value of the 95 percentile (P95) during an observation period Number of measured values [%] within the tolerance band of one U1…3 Actual (%) measurement period Specifications complied with? (Pass: Specifications complied with.
-
Page 56: Interharmonic Voltage
Power Quality 7.3.7 Interharmonic Voltage according to DIN EN 50160 An interharmonic voltage is a sinusoidal voltage with a frequency not equal to an inte- ger multiple of the fundamental frequency (e. g. f = 50 Hz). Interharmonic voltages at closely adjacent frequencies can appear at the same time forming a wide band spectrum. -
Page 57: Mains Signaling (Ripple Control Signals)
Power Quality The display shows: Display text Description Note U1…3 Avg Value (%) Ø -measured value per phase Percentage Measured value of the 95 percentile (P95) dur- U1…3 P95 Value (%) Percentage ing an observation period U1…3 Max Value (%) Maximum measured value per phase Percentage Use the... - Page 58 Fig. 7.17. PEM735 can detect the voltage of the signals in three different frequency ranges. The limits of the frequency ranges can be specified by the user. The frequency range is lim- ited to 3 kHz.
- Page 59 Power Quality Fig. 7.18: Mains signaling (subpage 1) Fig. 7.19: Mains signaling (subpage 2) PEM735_D00084_00_M_XXEN/02.2015...
- Page 60 Power Quality The display shows: Display text Description Note Signaling voltage Frequency of the ripple control The three frequencies used can frequency (Hz) signals be adjusted via Modbus. Permissible deviations (toler- Limit (%) ance band) Number [%] of the measured values, which must be in the Tolerance (%) tolerance band within one...
-
Page 61: Swell Overvoltages
Power Quality 7.3.9 Swell Overvoltages Voltage swells are typically caused by switching operations and load disconnections. The nominal supply voltage U is used as reference. The swell start threshold is equal to 110 % of U , the hysteresis is 2 %. In addition to the threshold, the duration of the voltage swell is also determined. -
Page 62: Dips
Power Quality The display shows: Display text Description Time (ms) Voltage swell level in % of the sliding value (U ) or of the nominal Voltage swell u value (U For voltage swells classification the percentages of the voltage levels u are summarized as follows: u ≥... - Page 63 Power Quality Fig. 7.21: Dips (subpages 1 of 3) For voltage dips classification the percentages of the voltage levels u are summarized as follows: 90 ≥ u ≥ 80 80 > u ≥ 70 70 > u ≥ 40 40 > u ≥ 5 5 >...
-
Page 64: Interruptions
Power Quality Note: If the "Sliding Reference Voltage U " detection method is used, the calculation should be made using a first order and a constant set to one minute. = 0.9967 x U + 0.0033 x U sr(n) sr(n-1) (10/12)rms Use the buttons to navigate through the individual pages of... - Page 65 Power Quality t < 1 s 1 s ≤ t < 180 s (3 minutes) 180 s ≤ t The display shows: Display text Description Counts Quantity Classification of voltage interruption according to duration 1s ≤ t < 3 min (in this case it varies between 1 second and 3 minutes) Voltage interruption evaluation On polyphase systems, a voltage interruption begins when the r.m.s.
-
Page 66: Transient Overvoltages
Power Quality 7.3.12 Transient Overvoltages according to DIN EN 50160 Transient overvoltages at the supply terminals are generally caused by lightning (in- duced overvoltage) or by switching in the system. Fig. 7.23: Transient overvoltages The display shows: Display text Description Counts Number of counts during the observation period. - Page 67 Power Quality DIN EN 50160 does not specify limits for these measured values. Note 1: The rise time can cover a wide range from milliseconds down to much less than a microsecond. However, for physical reasons, transients of longer durations usually have much lower amplitudes.
- Page 68 Power Quality PEM735_D00084_00_M_XXEN/02.2015...
-
Page 69: Voltage
Voltage 8. Voltage Overview of the voltages measured U or U as well as the average voltage ØU (U from U1…U3 as a bar graph. Fig. 8.1: Display "Voltage" (voltage measurement) Use the buttons to switch between the individual displays. To reset the minimum and maximum values, keep the "ESC"... - Page 70 Voltage PEM735_D00084_00_M_XXEN/02.2015...
-
Page 71: Current
Current 9. Current Overview of measured and calculated currents I as well as the 0…4 average current ØI (I ) as a bar graph. Fig. 9.1: Display "Current" (current measurement) Use the buttons navigate between the displays IL and I0/I4. To reset the maximum value, keep the "ESC"... - Page 72 Current PEM735_D00084_00_M_XXEN/02.2015...
-
Page 73: Waveform
Waveform 10. Waveform In addition to the numeric values, the waveform recorder represents the waveforms of the measured voltages and currents on the display. Here, a comprehensive view of all voltages U and currents I and the consideration of individual waves is possible. L1…3 1…3 Fig. - Page 74 Waveform Use the "ENTER" button to enable full screen display: Fig. 10.2: Display "Waveform" (full screen display) Fig. 10.3: Display "Waveform" (frozen) PEM735_D00084_00_M_XXEN/02.2015...
- Page 75 Waveform In full screen mode the latest waves can be "frozen" using the "Enter" button so that you can analyse the graphs in more detail. By pressing the "Enter" button once more, the display will unfreeze and return to the full screen display mode. Leave the frozen display mode and return directly to the standard mode by pressing the "ESC"...
- Page 76 Waveform PEM735_D00084_00_M_XXEN/02.2015...
-
Page 77: Harmonics
Harmonics 11. Harmonics Overview of the measured harmonics as bar graphs. Use the buttons to na- vigate between the individual displays. There are two possibilities to calculate the harmonic distortion. This setting can be car- ried out directly on the device. Settings >... - Page 78 Harmonics Fig. 11.1: Display "Harmonics" (voltages of one phase) Fig. 11.2: Display „Harmonics“ (currents of one phase PEM735_D00084_00_M_XXEN/02.2015...
- Page 79 Harmonics Fig. 11.3: Display „Harmonics“ (currents I4) Settings > Advanced: Harmonics Calc. Type Sub_Group a Settings > Advanced > Current K Harmonic. Calc.: RMS or distortion Settings > Advanced > Voltage K Harmonic. Calc.: RMS or distortion When "RMS" is selected, the harmonics are displayed as r.m.s. values (V or A). When "Distortion"...
- Page 80 Harmonics PEM735_D00084_00_M_XXEN/02.2015...
-
Page 81: Metering
Metering 12. Metering Measured values for voltages, currents, r.m.s. values and fundamentals in tabular form. Use the buttons to navigate between the individual displays. Display Parameters Measured values Note Actual, min, max L1…3 Actual, min, max only shows r.m.s. L1L2…L3L1 voltages Actual Actual... - Page 82 Metering Fig. 12.1: Display „Metering“ (voltages) Fig. 12.2: Display: "Metering" (currents) PEM735_D00084_00_M_XXEN/02.2015...
- Page 83 Metering Fig. 12.3: Display: "Metering" (r.m.s. values) Fig. 12.4: Display "Metering" (fundamentals) PEM735_D00084_00_M_XXEN/02.2015...
- Page 84 Metering PEM735_D00084_00_M_XXEN/02.2015...
-
Page 85: Power & Energy
Power & Energy 13. Power & Energy Presentation of the active and reactive power as measured values and as vectors in the quadrants Q1…4. The power values are displayed either as total measurement (Sum) or for each individual conductor L1…3. Fig. - Page 86 Power & Energy Explanation of power factor λ rules: Reactive power import Quadrant 2 Quadrant 1 Power factor (-) Power factor (+) Active power export (-) Active power import (+) Reactive power import (+) Reactive power import (+) Active power import Quadrant 3 Quadrant 4 Power factor (-)
-
Page 87: System
System 14. System PEM735 features 8 digital inputs, 2 digital outputs and 4 relay outputs. These are dis- played directly on the device. Fig. 14.1: Display "System" Inputs The device features eight digital inputs which are internally operated with DC 24 V. - Page 88 System PEM735_D00084_00_M_XXEN/02.2015...
-
Page 89: Events
Events 15. Events Access to stored events of the SOE (Sequence Of Events) and the PQ (Power Quality) re- corder. In addition to the timestamp, an event description in clear text format and the associat- ed value are displayed. Fig. 15.1: Display "Events" (event log start page) Press "ENTER"... - Page 90 Events Fig. 15.2: Display "Events" (event log, page 1 of 3) Fig. 15.3: Display "Events" (PQ log) PEM735_D00084_00_M_XXEN/02.2015...
-
Page 91: Settings
Settings 16. Settings Here, general information about the universal measuring device is displayed. In addi- tion, parameters for the device can be set here (password protected). Fig. 16.1: Display "Settings" Press "ENTER" to go to the "Settings" menu. Use the buttons to navigate between the individual items. -
Page 92: Info
Settings 16.1 Info Fig. 16.2: Settings ("Info" view) You cannot carry out settings in the Info view. This page is only for information purpos- 16.2 Basic Fig. 16.3: Settings (menu item: "Basic") PEM735_D00084_00_M_XXEN/02.2015... - Page 93 Settings Before changing the settings you have to enter the correct password (factory setting: 000000). Fig. 16.4: Settings (password entry) You can change the value of a digit using the buttons. Use the buttons to navigate between the individual digits of the password Confirm the password with the "Enter"...
-
Page 94: Ethernet
Settings After successful password entry you can change the settings. The currently selected pa- rameter is highlighted in black. Fig. 16.5: Settings (selected parameter) You can jump from one field to another using the arrow buttons. To change the settings, you have to enter the currently selected field (highlighted in black) using the "Enter"... - Page 95 Settings Fig. 16.6: Display "Settings" (Ethernet) Press "ENTER" to enter the setting mode (after successful password entry). Select the field to be edited (which is displayed on a black background) using the arrow buttons. Activate the field with the "Enter" key. The field that can be edited is marked and can be set using the arrow buttons.
-
Page 96: Com (Communication Interface)
Settings Fig. 16.7: Display "Settings"(Ethernet), change settings 16.2.2 COM (communication interface) PEM735 features two communication interfaces the settings of which can be carried out directly at the device. Fig. 16.8: Display "Settings" (COM) PEM735_D00084_00_M_XXEN/02.2015... -
Page 97: Advanced (Advanced Settings)
Settings The display shows: Display text Description COM1: Timing or Modbus Protocol COM2: Gateway or Modbus Unit ID Baud rate 38400, 19200, 9600, 4800, 2400, 1200 Parity Parity 8N1, 8E1, 8O1, 8N2, 8E2, 8O2 16.2.3 Advanced (advanced settings) In advanced settings you determine the calculation method for the power factor λ and apparent power S, and the calculation settings for the harmonics. - Page 98 Settings The display shows: Display text Description Note IEC, IEEE, -IEEE; see PF convention Power factor λ Fig. 13.3 S calculation Calculation method apparent power Vector or scalar Value of the harmonic related to the % of FUND HD calculation fundamental or the r.m.s.
- Page 99 Settings Explanation of power factor λ rules: Reactive power import Quadrant 2 Quadrant 1 Power factor (-) Power factor (+) Active power export (-) Active power import (+) Reactive power import (+) Reactive power import (+) Active power import Quadrant 3 Quadrant 4 Power factor (-) Power factor (+)
-
Page 100: Time (Setting Time And Date)
Settings 16.2.4 Time (setting time and date) Fig. 16.11: Display "Settings" (time) The display shows: Display text Description Note Time Local time Relate to GMT Time zone Time zone Relative to GMT DATE Current date Date format Date format YYMMDD, DDMMYY, MMDDYY Note: The clock is automatically set by a connected CP700. -
Page 101: Others
Settings 16.2.5 Others You can use this menu to set the display properties and the polarity for the measuring current transformers. Fig. 16.12: Display "Settings" (Others) The display shows: Display text Description Note To set the time after which the LCD Timeout background lighting automati- 0…60 minutes... - Page 102 Settings PEM735_D00084_00_M_XXEN/02.2015...
-
Page 103: Technical Data
Technical data 17. Technical data Insulation co-ordination Measuring circuit Rated insulation voltage............................600 V Overvoltage category................................III Pollution degree.................................2 Supply circuit Rated insulation voltage............................300 V Overvoltage category.................................II Pollution degree.................................2 Supply voltage Rated supply voltage U ..........................95…250 V Frequency range of U ..........................DC, 44…440 Hz Power consumption ............................. - Page 104 Technical data Accuracies (v. M. of measured value/v. S. of full scale value) Phase voltage U .......................± 0.1 % v. M. L1-N L2-N L3-N Current ..........................±0.1 % v. M./+0.05% v.S . Neutral current I ...............................0.5 % v. S. Frequency ................................ ± 0.005 Hz Phasing ..................................
-
Page 105: Standards And Certifications
Degree of protection, front ............................IP52 Weight .................................≤ 2000 g 17.1 Standards and certifications PEM735 was designed in accordance with the following standards: DIN EN 50160 Merkmale der Spannung in öffentlichen Elektrizitätsversorgungsnetzen (Voltage char- acteristics of electricity supplied by public distribution networks) DIN EN 61000-4-30 VDE 0847-4-30 Elektromagnetische Verträglichkeit (EMV) - Page 106 Technical data PEM735_D00084_00_M_XXEN/02.2015...
-
Page 107: Glossary And Terms
Glossary and terms 18. Glossary and terms Abbreviation Long form/Description Term COMM Communication Digital Input (2.4 mA, DC 24 V) Voltage magnitude specified for the purpose of detecting the start and Dip Threshold end of a voltage dip Present Demand Digitaler output (max. - Page 108 Glossary and terms Abbreviation Long form/Description Term Megabyte Active Power (kW) Measured value of the 95 percentile (P95) during an observation period (95 % of the values are less than or equal to this measured value) Percentile Percentile rank divides the set of data into 100 equal parts. Long-term flicker (perceptibility unit long term), 2-hour value, cubic average value from 12 P Pulses Per Second...
- Page 109 Glossary and terms Abbreviation Long form/Description Term SYNC DI Demand Sync Input (digital input demand synchronisation) TEHD Total Even Harmonic Distortion Total Harmonic Distortion TOHD Total Odd Harmonic Distortion Unidirectional impulse of either polarity or a damped oscillatory wave Transient with the first peak occurring in either polarity Zero sequence component Zero sequence component (ratio expressed as a percentage)
- Page 110 Glossary and terms Abbreviation Long form/Description Term Residual voltage: Minimum value of U {class A} recorded during rms(1/2) a voltage dip or interruption; the residual voltage is expressed as a value in volts, or as a percentage or per unit value of the declared input voltage.
- Page 111 Glossary and terms Abbreviation Long form/Description Term Begins when the U voltage rises above the swell threshold; ends Voltage swell when the U voltage is equal to or below the swell threshold minus (single-phase the hysteresis voltage. Typically, the swell threshold is > 110 % of U system) typically, the hysteresis is equal to 2 % of U Waveform...
- Page 112 Glossary and terms PEM735_D00084_00_M_XXEN/02.2015...
-
Page 113: Index
INDEX Digital inputs 25 Digital output 26 (Energy Pulsing) Digital outputs 103 - LED indication 32 Dimension diagram 19 Dips 62 Display mode - Standard display 33 Active power 85 Display properties 101 Advanced 97 Advanced settings 97 Apparent power, calculation 86 Application example 16 Ethernet 94 Area of application 13... - Page 114 INDEX LED indication 32 Safety instructions 11 Seminars 9 Service 8 Setpoints 14 Mains signalling 57 Settings 91 Measuring current transformers 21 Setup Measuring quantities 14 - Setting possibilities 91 Memory Supply Voltage Variations 43 - Event 103 Support 8 - Power Quality 103 Metering 81 Modbus...
- Page 116 Bender GmbH & Co. KG Postfach 1161 • 35301 Gruenberg • Germany Londorfer Str. 65 • 35305 Gruenberg • Germany Tel.: +49 6401 807-0 Fax: +49 6401 807-259 E-Mail: info@bender.de www.bender.de Photos: Bender and bender systembau archives.
Need help?
Do you have a question about the PEM735 and is the answer not in the manual?
Questions and answers