
Subscribe to Our Youtube Channel
Related Manuals for Hioki 3197


Summary of Contents for Hioki 3197
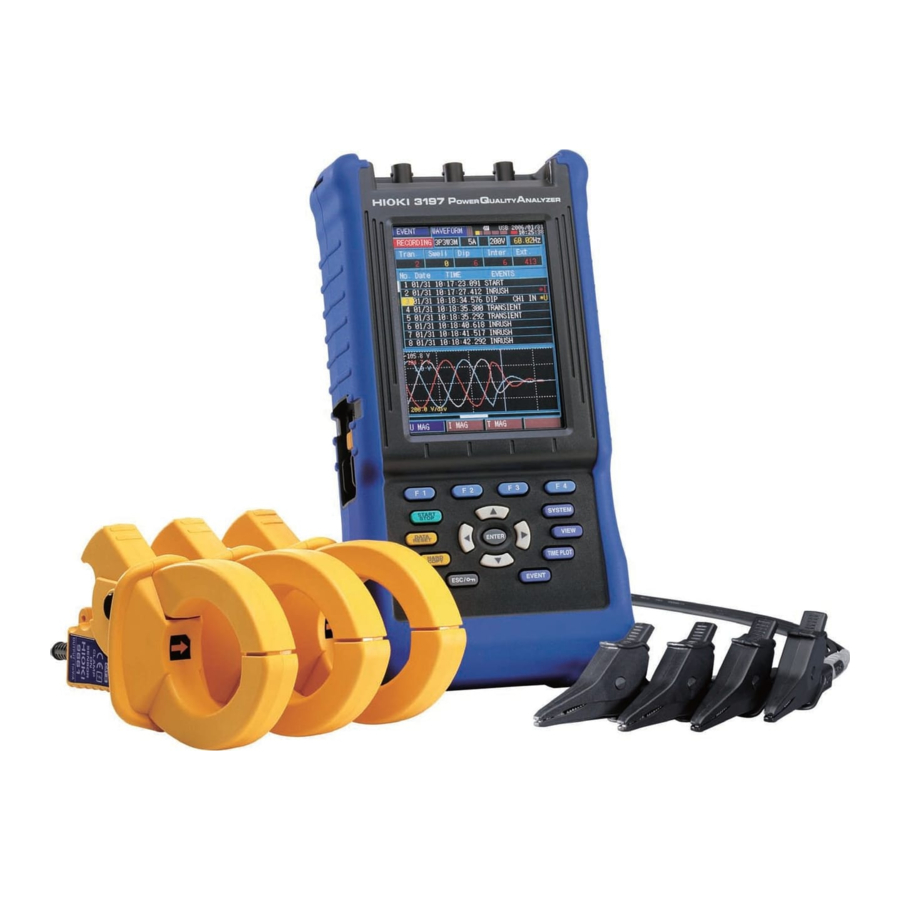
- Page 1 Instruction Manual 3197 POWER QUALITY ANALYZER May 2012 Revised edition 7 3197A981-07 12-05H...
-
Page 3: Table Of Contents
Contents Contents Introduction.................1 Confirming Package Contents............2 Safety Information ..............4 Operating Precautions..............7 Operating Procedure Descriptions in this Manual ....12 Chapter 1 Overview ____________________________________13 1.1 Product Overview ............13 1.2 Features ..............14 1.3 Measurement Flowchart ..........17 Initial instrument preparations ...........19 Install and connect the instrument, and turn the power on ..19 ... - Page 4 Contents Install the 9459 Battery Pack ............ 39 Charge the 9459 Battery Pack ..........40 3.2 Connecting the AC Adapter ........41 3.3 Connecting the Voltage Cords ........42 3.4 Connecting Clamp Sensors ........44 3.5 Turning the Power On and Off ........46 3.6 Other Preparations ............
- Page 5 Contents 4.5 Changing Instrument System Settings [SYSTEM] ..............72 Displaying the Instrument's Version Number (Version) .....72 Changing the Display Language (Language) ......73 Changing Screen Colors (Color) ..........73 Enable or Disable Beep Sounds (Beep) ........74 Setting the LCD Backlight Timeout (Backlight) ......74 ...
- Page 6 Contents Displaying an Energy Consumption Graph [ENERGY] ..107 6.3 Viewing Anomalous Phenomena (EVENT screen) . 108 Viewing the [RMS WAVE] Screen .......... 108 Viewing the [INRUSH] Screen ..........109 Detection Methods and Recording Contents of Events ..110 ...
- Page 7 Appendix 1 Interval and Recording Time Settings ......A1 Appendix 2 Relation Between Graph Divisions and Time ..... A5 Appendix 3 3197 Data-header Composition........A7 Appendix 4 Displayed and Measurement Ranges ......A8 Appendix 5 Power Range Structure ..........A9 Appendix 6 Clamp Sensor Combined Accuracy......
- Page 8 Contents...
-
Page 9: Introduction
Introduction Introduction Thank you for purchasing the HIOKI Model 3197 Power Quality Ana- lyzer. To obtain maximum performance from the instrument, please read this manual carefully, and keep it handy for future reference. In this document, the “instrument” means the Model 3197 Power Quality Analyzer. -
Page 10: Confirming Package Contents
Accessories Model 3197 Power Quality Analyzer Instruction Manual......1 Measurement Guide ......1 PC application program for Model 3197 9418-15 AC Adapter (CD) ..........1 (AC power cord included) ....1 Install these on the instrument before oper- ... -
Page 11: 9418-15 Ac Adapter
Confirming Package Contents Options For the details, contact your supplier or Hioki representative for details. Clamp-On Sensor Products (voltage-output type) 9660 9661 9669 9694 9695-02 9695-03 Clamp-On Sensors (Arms current 1000 rating) Accessory: Model 9219 Connection Cable (for Models 9695-02 and -03) -
Page 12: Safety Information
Safety Information Safety Information This instrument is designed to comply with IEC 61010 Safety Stan- dards, and has been thoroughly tested for safety prior to ship- ment. However, mishandling during use could result in injury or death, as well as damage to the instrument. However, using the instrument in a way not described in this manual may negate the provided safety features. - Page 13 Safety Information Other Symbols Indicates the prohibited action. (p. ) Indicates the location of reference information. Indicates quick references for operation and remedies for trouble- shooting. Indicates that descriptive information is provided below. Screen labels such as menu items, setting items, dialog titles and buttons are indicated by square brackets [ ].
- Page 14 Safety Information Measurement categories This instrument complies with CAT III (600 V) and CAT IV (300 V) safety require- ments. To ensure safe operation of measurement instruments, IEC 61010 establishes safety standards for various electrical environments, categorized as CAT II to CAT IV, and called measurement categories.
-
Page 15: Operating Precautions
• Before using the instrument the first time, verify that it operates nor- mally to ensure that the no damage occurred during storage or ship- ping. If you find any damage, contact your dealer or Hioki representative. • Before using the instrument, make sure that the insulation on the L9438-55 Voltage Cord and clamp sensor leads is undamaged, and that no bare conductors are improperly exposed. - Page 16 • Do not allow the instrument to get wet, and do not take measure- ments with wet hands. This may cause an electric shock. • Never modify the instrument. Only Hioki service engineers should disassemble or repair the instrument. Failure to observe these precautions may result in fire, electric shock, or injury.
- Page 17 Before Turning Power On Battery Pack Operation • For battery operation, use only the HIOKI Model 9459 Battery Pack. We cannot accept responsibility for accidents or damage related to the use of any other batteries.
- Page 18 Operating Precautions Input and Measurement Precautions • The maximum input voltage is as follows: Voltage input section: 780 Vrms, 1103 V peak.Current input sec- tion: 1.7 Vrms, 2.4 V peak Attempting to measure voltage in excess of the maximum input could destroy the instrument and result in personal injury or death.
- Page 19 Never use abra- sives or solvent cleaners. • Hioki shall not be held liable for any problems with a computer system that arises from the use of this CD, or for any problem related to the...
-
Page 20: Operating Procedure Descriptions In This Manual
Operating Procedure Descriptions in this Manual Operating Procedure Descriptions in this Manual Indicates items you can Indicates the screens you can select by the cursor keys, Operating keys select by pressing the key. and the current selection. Indicates items you can select from the pull-down menus, and their descriptions. -
Page 21: Chapter 1 Overview
In addition, utilizing remote computer control, abnormal events at a remote site can be noticed as soon as they occur. Measurement data recorded in internal memory can be transferred to a computer for analysis by PC application program for Model 3197. Power Quality Deterioration... -
Page 22: Features
1.2 Features 1.2 Features Supports various power line wiring configurations Measures three channels of voltage and current. With just one instrument, measure voltage, current and power on single- phase 2-wire, single-phase 3-wire, three-phase 3-wire and three-phase 4-wire systems. Neutral current in three-phase 4-wire systems is available by calculation. Vector multi-meter function Measurement line wiring connections can be checked from the initial screen. - Page 23 1.2 Features Simultaneous measurement of various power quality parameters The following power quality parameters can be simultaneously mea- sured and recorded. • Transient overvoltage (impulse) • Voltage swells, voltage dips, interruptions, frequency, voltage, voltage waveform peaks, current, current waveform peaks, active power, apparent power, reactive power, power factor, displacement power factor, voltage unbalance factor, harmonic voltage, harmonic current, harmonic power, fundamental voltage phase difference, fundamental...
- Page 24 Hand-held design The instrument weighs only 1.2 kg, and the rubber grip makes it comfort- ably hand portable. USB 2.0 interface and PC application program for Model 3197 are included The instrument can be remotely controlled, and data can be transferred and analyzed on a computer using the supplied USB cable and special- purpose PC application programs.
-
Page 25: Measurement Flowchart
1.3 Measurement Flowchart 1.3 Measurement Flowchart First Steps Upon Unpacking Flow process descriptions are also on page 19 to page 21 . See: 3.1 (p. 37) Install & Connect See: "Instrument Installation" (p. A7) 3.2 (p. 41) 3.3 (p. 42) Install the Connect the 3.4 (p. - Page 26 Connect the instrument to a computer View instaneous data using the supplied USB cable. Then us- View recorded time series data ing the supplied PC application program for Model 3197, transfer recorded data View recorded anomaly waveforms for analysis. Finish Turn the power off...
-
Page 27: Initial Instrument Preparations
1.3 Measurement Flowchart Initial instrument preparations Apply the appropriate label to the input terminals (p. 37) Apply the appropriate labels to the voltage measurement and clamp sensor leads (p. 38) Attach the strap (p. 38) Install the 9459 Battery Pack (p. 39), and charte it (p. 40). Install and connect the instrument, and turn the power on Install this instrument Refer to "5.1 Pre-Operation Inspection"... -
Page 28: Confirming Instrument Settings And Connecting To The Lines To Be Measured
1.3 Measurement Flowchart Confirming Instrument Settings and Connecting to the Lines to be Measured Make the required settings before connecting (p. 57). Select the appropriate wiring configura- tion and clamp sensor model settings. Select the appropriate wiring con- figuration and clamp sensor model settings (p. -
Page 29: Start Recording And Analyze Recorded Measurement Data
Verify detailed event wave- anomalies forms, graphs and the num- (when an event ber of occurrences. occurs) (p. 31) Using remote control cable View on Transfer data a computer Analyze data Computer (p. 127) 3197 See the references for details... - Page 30 1.3 Measurement Flowchart...
-
Page 31: Names And Functions Of Parts And Basic Setup
2.1 Panel and Operating Keys Names and Functions of Parts Chapter 2 and Basic Setup 2.1 Panel and Operating Keys Front Panel Display Screen 4.7-inch STN color Operating Keys (p. 25) POWER LED (green) This LED flashes when the power switch is on, operating from the AC adapter or battery. - Page 32 2.1 Panel and Operating Keys Left Side Strap Hole (p. 38) AC Adapter socket Connect the supplied Model 9418-15 AC Adapter. (p. 41) CHARGE LED (red) This LED lights when the battery is charging. (p. 40) POWER Switch Turns the instrument on and off. Power Off Power On (p.
- Page 33 2.1 Panel and Operating Keys Operating Keys Display screen selection Operating Functions Function selection Switch screens Start/stop recording The screen switches each Data reset time you press a key See: "2.3 Screen Configura- Saving screen image tions"(p. 28) Accept settings Moving the screen cursor Making Settings Cancel settings / Enable or Disable the key operations...
- Page 34 2.1 Panel and Operating Keys Rear Panel Serial No. Shows the serial No.. Do not remove this label, as it is required for product support. Stand Battery information This is accessible by opening the stand. Battery Compartment The supplied Model 9459 Bat- tery Pack installs here.
-
Page 35: Basic Operations
2.2 Basic Operations 2.2 Basic Operations Switching Screens The screen switches every time you press the SYSTEM, VIEW, TIMEPLOT, or EVENT key. Screen Type Display Contents System WIRING MEASURE REC&EVENT SYSTEM View WAVEFORM VECTOR HARMONICS Time Plot DIP/SWELL DEMAND ENERGY Event WAVEFORM DETAIL... -
Page 36: Screen Configurations
2.3 Screen Configurations 2.3 Screen Configurations SYSTEM (Setting Conditions and System Settings) Make the necessary settings before measuring. The displayed screen changes each time you press [WIRING] [MEASURE] Correct Wiring Diagram Connection Check Make basic settings for measurement. You can View the selected system wiring diagram while set the measurement frequency, wiring config- connecting the voltage cords and clamp sen-... - Page 37 2.3 Screen Configurations VIEW (View Measurement Results) Shows instaneous measurement results. The displayed screen changes each time you press [WAVEFORM] [VECTOR] Voltage waveform Current waveform This screen displays voltage and current wave- This screen displays a voltage and current vec- tor diagram.
- Page 38 2.3 Screen Configurations TIME PLOT (Viewing Time Series Graphs) Displays recording state and recorded results as a fluctuation graph. The displayed screen changes each time you press [RMS] [DIP/SWELL] Various calculated rms values are displayed in a Calculated rms voltage for one waveform shift- time series graph with maximum, minimum and ed by one-half cycle is displayed as a time se- average values during every interval.
- Page 39 2.3 Screen Configurations EVENT (Viewing Anomalous Events) Displays power anomaly detection results. The displayed screen changes each time you press [DETAIL] [WAVEFORM] Event Monitor Event List Event occurrences are monitored and contents Each row of the Event List may include multi- displayed in a list.
-
Page 40: Common Screen Elements
2.4 Common Screen Elements 2.4 Common Screen Elements Common Display Area Power Supply Indicators "Switching Screens"(p. 27) This area appears on all screens. Key Lock Indicator Internal Mem- ory Usage In- Interface Usage In- dicator Screen Type dicator Screen Contents Event Recording Status Indicator Real-... - Page 41 2.4 Common Screen Elements Current Range PT/CT Ratio A red field indicates that the crest factor is out Appears when a PT or CT ratio of range. has been set. Select a higher range Nothing appears here when the PT and CT ratio settings are 1 (1:1).
-
Page 42: Internal Operating Status And Memory Usage
2.5 Internal Operating Status and Memory Usage 2.5 Internal Operating Status and Memory Usage How data is recorded to internal memory (internal operating status) depends on whether memory partitioning is enabled. When Memory Partitioning is Disabled (Partition: [OFF]) Start and Stop Recording Manually Stop [SET] [ANALYZE]... -
Page 43: Using Memory Partitioning (Partition: [On])
2.5 Internal Operating Status and Memory Usage Using Memory Partitioning (Partition: [ON]) (Blue) (Brown) indicates recorded data. indicates no stored data. (Yellow) (Red) indicates the amount of recorded Time Plot indicates the memory partition data as a level meter. currently being used. Start and Stop Recording Manually First Measurement Stop... - Page 44 2.5 Internal Operating Status and Memory Usage...
-
Page 45: Measurement Preparations
TYPE 1 phase colors are the factory de- fault. Phase Colors (Input Terminal Colors) Selection U1 I1 U2 I2 U3 I3 Region TYPE1 Black Yellow Blue HIOKI & UK TYPE2 Blue Orange Black Gray New EU & UK TYPE3 Black Yellow Green China... -
Page 46: Apply The Appropriate Labels To The Voltage Measurement And Clamp Sensor Leads
3.1 Initial Instrument Preparations Apply the appropriate labels to the voltage measurement and clamp sensor leads White Before applying the labels Green Wipe any dust from the surface around the Gray terminals, and ensure that it is dry. Black Brown Blue Apply labels to Yellow... -
Page 47: Install The 9459 Battery Pack
Avoid pinching the battery pack leads For battery operation, use only the HIOKI Model 9459 Battery Pack. We cannot accept responsibility for accidents or dam- age related to the use of any other batter- Replace the battery pack ies. -
Page 48: Charge The 9459 Battery Pack
3.1 Initial Instrument Preparations Charge the 9459 Battery Pack Charge the battery pack before using it the first time. By connecting the Model 9418-15 AC Adapter to the instrument and to an AC power outlet, the battery pack can be charged without turning the instrument on. When to charge: When powering the instrument from the battery pack without the AC adapter, the low battery indicator(... -
Page 49: Connecting The Ac Adapter
3.2 Connecting the AC Adapter 3.2 Connecting the AC Adapter Connect the power cord and the instrument to the supplied Model 9418- 15 AC Adapter, then plug the power cord into an outlet. When used with the battery pack installed, the battery serves as an operating backup supply in case of power failure, and the AC adapter otherwise has prior- ity. -
Page 50: Connecting The Voltage Cords
3.3 Connecting the Voltage Cords Grounded and Ungrounded Outlets Using a Grounded Outlet Plug the power cord into the outlet 3.3 Connecting the Voltage Cords The color and number of voltage cords to use depends on the wiring configuration of the system being measured.Connect the supplied Model L9438-55 Voltage Cord Set to the voltage input terminals on the instrument. - Page 51 3.3 Connecting the Voltage Cords Removing and attaching the caps The tips of the metal pins are sharp, so take care not to injure yourself. Removing the Gently hold the bottom of the caps and pull the caps off. caps Safely store the removed caps so as not to lose them.
-
Page 52: Connecting Clamp Sensors
3.4 Connecting Clamp Sensors 3.4 Connecting Clamp Sensors Connect the optional clamp sensors to the current input terminals on the instrument. The clamp sensors that are compatible with this instrument are voltage output types. Compatible clamp sensors provide about 0.5 Vrms output corresponding to full scale current. - Page 53 3.4 Connecting Clamp Sensors Clamp Sensor Connection Procedure Connect each clamp sensor plug to the terminal labeled with the corresponding color. Notches in BNC Plug BNC Jack Guide Pins (on clamp sensor cable) (on the instrument) Lock Align the notches in the BNC Turn the plug clockwise to plug with the guide pins on the lock.
-
Page 54: Turning The Power On And Off
3.5 Turning the Power On and Off 3.5 Turning the Power On and Off Before turning power on Confirm that the instrument and related accessories are installed and connected properly. When using the AC adapter Before turning the instrument on, make sure the supply voltage matches that indicated on the its power connector. - Page 55 3.5 Turning the Power On and Off Startup Screen When the instrument is turned on, the startup screen appears as the self-test starts. HIOKI 3197 POWER QUALITY ANALYZER Ver 1.00 Results of Internal Self-Test Product Model Name Version Number When no internal test results are...
-
Page 56: Other Preparations
3.6 Other Preparations 3.6 Other Preparations Select the screen color scheme to match the input terminal labels Phase wiring is easier to keep track of when the color of each phase line indication on the display matches the label color of the corresponding input terminal. As an example, this procedure shows how to change the color scheme from TYPE 1 to TYPE 5. -
Page 57: Select The Naming Convention To Be Applied To Each Phase Line Measurement On The Display
3.6 Other Preparations Select the naming convention to be applied to each phase line measurement on the display Phase line measurements can be identified on the display by the following conven- tions: R S T, A B C, L1 L2 L3 or U V W. The factory default setting is R S T, but should be changed to suit your local con- vention. - Page 58 3.6 Other Preparations Phase Naming Lists With 1P2W selected With 1P3W selected Select U1 I1 Select U1 I1 U2 I2 R S T R S T A B C A B C L1 L2 L3 L1 L2 L3 U V W U V W With 3P3W3M selected With 3P4W or 3P4W2.5E selected...
-
Page 59: Auxiliary Function (Key Lock)
3.7 Auxiliary Function (KEY LOCK) 3.7 Auxiliary Function (KEY LOCK) Use the KEY LOCK function to avoid inadvertent operations while recording. Locking and Unlockin Press and hold the ESC/KEY The KEY LOCK indicator is displayed at the top right (and disappears when unlocked). LOCK key for three seconds (the same operation locks About the display indicator:... -
Page 60: Auxiliary Function (Save Screen Image)
3.8 Auxiliary Function (Save screen image) 3.8 Auxiliary Function (Save screen image) An image of the screen is stored as a bitmap (BMP format) file in internal memory. Saved screen images can be viewed by transferring to a computer (p. 127) . Save screen image Sample Massage Check! -
Page 61: Pre-Measurement And System Settings
Pre-Measurement and System Chapter 4 Settings After connecting the instrument to the lines to be measured and before starting recording, verify the instrument settings. Settings can be made in the following three ways. Basic Setup Advanced Settings Make only the minimum required set- Make settings from the SYSTEM tings in preparation for recording... -
Page 62: Basic Setup (Typical Settings)
4.1 Basic Setup (Typical Settings) 4.1 Basic Setup (Typical Settings) The Basic Setup Function After turning the instrument on, preparations for recording can be easily performed by making only the minimum required settings (wiring configuration and clamp sensor set- tings) on the initial operating screen, confirming wiring configuration connections and executing Basic Setup. - Page 63 4.1 Basic Setup (Typical Settings) 1. Select the wiring configuration and clamp sensor model. Select the SYSTEM [WIRING] screen (Initial Operating Screen). Move to the [Wiring] setting. Select from the pull-down menu. Setting details: Accept See: "Setting the Wiring Method (Wiring)" (p. 58) Move to the [Clamp] setting.
- Page 64 4.1 Basic Setup (Typical Settings) 3. Execute Basic Setup. Select [QuickSet]. A confirmation message appears. AUTO set: Freq., Uref., Interval Execute basic setup. Event threshold: Defalt levels Continue? Pressing key reverts to the original screen without executing Yes: ENTER No: ESC Basic Setup.
-
Page 65: Selecting The Measurement Method (System Screen)[Measure]
4.2 Selecting the Measurement Method (SYSTEM Screen) [MEASURE] 4.2 Selecting the Measurement Method (SYSTEM Screen) [MEASURE] Before connecting to the lines to be measured, change these settings as occasion demands. Make settings on the SYSTEM-[MEASURE] screen. To open the screen: Press the key to display the [MEASURE] screen. -
Page 66: Selecting The Line Frequency (Frequency)
4.2 Selecting the Measurement Method (SYSTEM Screen) [MEASURE] Selecting the Line Frequency (Frequency) Select the screen. Move to the setting item. Select from the pull-down menu. Cancel Accept Setting Contents AUTO/ 50Hz/ 60Hz The AUTO setting automatically selects 50 or 60 Hz internally when measurement starts. Setting the Wiring Method (Wiring) Select the screen. -
Page 67: Setting The Line Voltage (Nominal Line Voltage) Of The Lines To Be Measured
4.2 Selecting the Measurement Method (SYSTEM Screen) [MEASURE] Setting the Line Voltage (Nominal Line Voltage) of the Lines to be Measured Select the screen (initial operat- ing screen). Move to the setting item. Select from the pull-down menu. Cancel Accept The AUTO setting automatically selects the nominal voltage when measure- ment starts, and the internally set value is displayed here. -
Page 68: Selecting The Clamp Sensor Model And Current Range
• Only voltage-output type clamp sensors can be used. • Output should not exceed 1.7 Vrms (2.4 Vpeak). • The ratio of output voltage to input current should be the same as Hioki clamp sensors. Refer to "Appendix 5 Power Range Structure" (p. A9). -
Page 69: Setting The Pt Ratio (When Measuring Using A Transformer)
4.2 Selecting the Measurement Method (SYSTEM Screen) [MEASURE] Setting the PT Ratio (when measuring using a transformer) When measuring the secondary side of a High Voltage line, measured val- ues can be converted to display the voltage value at the primary side. Select the screen. -
Page 70: Selecting The Voltage Harmonic Calculation Method
4.2 Selecting the Measurement Method (SYSTEM Screen) [MEASURE] Selecting the Voltage Harmonic Calculation Method Select the screen. Move to the setting item. Select from the pull-down menu. Cancel Accept Setting Contents Rms Value Displays rms harmonic voltage. Percentage Displays the amplitude (harmonic voltage percentage) of an harmonic or- Content der component relative to that of the fundamental waveform. -
Page 71: Setting The Recording Method[Rec&Event]
4.3 Setting the Recording Method [REC&EVENT] 4.3 Setting the Recording Method[REC&EVENT] Make recording method settings before measuring, as occasion demands. Make settings on the SYSTEM-[REC&EVENT] screen. Opening the [REC&EVENT] screen Press the key to display the [REC&EVENT] screen. Specified demand period (demand cal- culation period) Specifies whether mem-... -
Page 72: Setting The Recording Interval (Interval)
4.3 Setting the Recording Method [REC&EVENT] Setting the Recording Interval (Interval) Measurement data during the specified intervals is recorded as a time series graph. Select the screen. Move to the setting item. Select from the pull-down menu. Cancel Accept Setting Contents AUTO/ 1 min/ 5 min/ 15 min/ 30 min/ 60 min Time Series Graph Recording "RMS"... -
Page 73: Setting Demand Period
4.3 Setting the Recording Method [REC&EVENT] Setting Demand Period Set the demand period for recordings. Select the screen. Move to the setting item. Select from the pull-down menu. Cancel Accept Setting Contents 15 min/ 30 min/ 60 min What is Demand? "Demand"... -
Page 74: Setting Recording Start And Stop Times
4.3 Setting the Recording Method [REC&EVENT] Setting Recording Start and Stop Times When timed recording is enabled, recording start and stop times can be set. Select the screen. Move to the setting item. Select from the pull-down menu. Cancel Accept Setting Contents Start and stop recording by pressing the START/STOP... -
Page 75: Setting Event Detection [Rec&Event]
4.4 Setting Event Detection [REC&EVENT] 4.4 Setting Event Detection [REC&EVENT] With this instrument, an "event" is the detection of an anomaly (abnor- mal phenomena) that may occur on power lines. The detection criteria (Event Settings) are specified before recording measurements. When the specified criteria are satisfied while recording, the data is recorded as an event, and can be analyzed on the EVENT screen. -
Page 76: Start Event/ Stop Event
4.4 Setting Event Detection [REC&EVENT] Opening the [REC&EVENT] Screen Press the key to display the [REC&EVENT] screen. Inrush Event (Inrush, Starting or Surge Current) An event is recorded when the specified value is exceeded. Timed Event Records events at specified time intervals. -
Page 77: Setting Timed Events
4.4 Setting Event Detection [REC&EVENT] Setting Timed Events Timed events are recordings made automatically at a predefined interval. Select the screen. Move to the setting item. Select from the pull-down menu. Cancel Accept Setting Contents OFF/1 min/5 min/15 min/30 min/1 hour/2 hour/ 12 hour/ 1 day See: "Timer"... -
Page 78: Setting Transient Events
4.4 Setting Event Detection [REC&EVENT] Setting Transient Events An event is recorded when high frequency impulse noise is imposed on the mains voltage waveform. Select the screen. Move to the setting item. Select from the pull-down menu. Accept Cancel Setting Contents OFF/ ON (disable/enable transient event recording) An event is detected as the presence, during any single cycle of the mains voltage wave- form, of a frequency component at 10 to 100 kHz with 50 Vrms (±70.7 Vpeak equivalent) or... -
Page 79: Setting Voltage Swell, Dip And Interruption Events
4.4 Setting Event Detection [REC&EVENT] Setting Voltage Swell, Dip and Interruption Events A voltage swell, voltage dip or interruption of the nominal voltage is recorded as an event. Select the screen. Move to the setting item. Change a numerical value ]: increase the value, [ decrease the value) Cancel... -
Page 80: Changing Instrument System Settings [System]
4.5 Changing Instrument System Settings [SYSTEM] 4.5 Changing Instrument System Settings [SYSTEM] The instrument's version information can be viewed, and the display lan- guage, beep sounds and screen colors can be changed from the SYS- TEM screen. Confirm that the clock is set correctly before starting recording. If the clock is not set correctly, recording results may not be analyzed cor- rectly (p. -
Page 81: Changing The Display Language (Language)
4.5 Changing Instrument System Settings [SYSTEM] Changing the Display Language (Language) The display language can be selected from Japanese, English or Chinese. Select the screen. Move to the setting item. Select from the pull-down menu. Cancel Accept Setting Contents English/ Chinese/ Korean/ Japanese Changing Screen Colors (Color) Select the screen. -
Page 82: Enable Or Disable Beep Sounds (Beep)
4.5 Changing Instrument System Settings [SYSTEM] Enable or Disable Beep Sounds (Beep) Keypress beep sounds can be enabled or disabled. Select the screen. Move to the setting item. Select from the pull-down menu. Cancel Accept Setting Contents Keypress beeps are enabled Keypress beeps are disabled. -
Page 83: Adjusting Screen Contrast (Contrast)
4.5 Changing Instrument System Settings [SYSTEM] Adjusting Screen Contrast (Contrast) Because screen contrast is temperature dependent, you may need to adjust LCD contrast to retain visibility. Select the screen. Move to the setting item. Change a numerical value ]: increase the value, [ decrease the value) Accept Setting Contents... -
Page 84: Setting The Clock (Clock)
The serial No. is used to identify the instrument for purposes such as user regis- tration. Select the screen. If the displayed serial No. is not the same as that on the label, please contact your dealer or Hioki representative... -
Page 85: Initializing The Instrument (System Reset)
4.6 Initializing the Instrument (System Reset) 4.6 Initializing the Instrument (System Reset) If the instrument begins to exhibit unusual behavior, refer to the "Before returning for repair" (p. 164). If the cause of the unusual behavior remains undetermined, perform a sys- tem reset. - Page 86 4.6 Initializing the Instrument (System Reset)
-
Page 87: Making Connections And Starting & Stopping Measurement
Before using the instrument the first time, verify that it operates normally to ensure that the no damage occurred during storage or shipping. If you find any damage, contact your dealer or Hioki representative. Inspection before conection Inspect the Voltage Cords... - Page 88 The battery pack may not be suf- Screen Startup (p. 47) ficiently charged. Allow it to HIOKI 3197 POWER QUALITY ANALYZER Ver 1.00 charge fully. If the battery has been fully charged and the power lamp does not flash or the screen...
-
Page 89: Connecting To The Lines To Be Measured
5.2 Connecting to the Lines to be Measured 5.2 Connecting to the Lines to be Measured Connect the voltage cords and clamp sensors to the lines to be mea- sured. To ensure proper connections for correct measurements, look at the wiring configuration diagram (p. 83) while making connections. •... - Page 90 5.2 Connecting to the Lines to be Measured Connecting clamp sensors to lines to be measured To measure load current (Example: Model 9660) Be sure to attach each clamp around only one conductor. Correct measurement cannot obtained if a clamp is attached around more than one conductor.
- Page 91 [WIRING] screen. While looking at the diagram, pay attention to the colors of the input ter- minals and leads. These examples use the R S T phase names and TYPE 1 (HIOKI) phase colors. Single-Phase 2-Wire (1P2W)
- Page 92 5.2 Connecting to the Lines to be Measured Three-Phase 3-Wire (3P3W2M) R, S, T: Line Load Side Source Side The arrows point toward the load. Three-Phase 3-Wire (3P3W3M) R, S, T: Line Load Side Source Side The arrows point toward the load.
- Page 93 5.2 Connecting to the Lines to be Measured Three-Phase 4-Wire (3P4W) R,S,T:Line/ N:Neutral/ G:Ground Load Side Source Side The arrows point toward the load. Three-Phase 4-Wire (3P4W2.5E) R,S,T:Line/ N:Neutral/ G:Ground Load Side Source Side The arrows point toward the load.
-
Page 94: Verifying Correct Wiring (Connection Check)
5.3 Verifying Correct Wiring (Connection Check) 5.3 Verifying Correct Wiring (Connection Check) Press the key to display the [WIRING] screen. Verify that the con- nections are correct from the measured values and vector display. Setting values Verify settings Nominal voltage value Verify vector display Verify measured Measurement Values... - Page 95 5.3 Verifying Correct Wiring (Connection Check) Verify Settings Current Range Frequency Values displayed in red indicate over- Values are displayed in red when differ- range. Select a higher range, or use a ent from the line frequency setting. clamp sensor with a higher rating. Change the line frequency setting if nec- essary.
-
Page 96: Starting And Stopping Recording
5.4 Starting and Stopping Recording 5.4 Starting and Stopping Recording Recording can be started and stopped either manually or at preset times. • Manual recording Press the START/STOP key to start and stop recording. start stop • Timed recording recording After setting start and stop times, recording starts and stops at the preset times. -
Page 97: Starting And Stopping Recording Without Memory Partitioning (Partition: Off)
5.4 Starting and Stopping Recording Starting and Stopping Recording Without Memory Partitioning (Partition: OFF) Starting and Stopping Recording Without Memory Partitioning Confirm that the [Partition] setting on the SYSTEM-[REC&EVENT] screen is set to [OFF] (p. 63). To manually start and stop recording The POWER LED blinks (four and half-seconds on, half-second [SET] off). - Page 98 5.4 Starting and Stopping Recording Starting and Stopping Recording at Preset Times (Time Start) Before starting recording, confirm that the [Time Start] setting on the SYSTEM- [REC&EVENT] is [ON], and that the start and stop times are set as required. The POWER LED blinks quickly (four and half-seconds on, half- [SET] second off).
- Page 99 5.4 Starting and Stopping Recording Recording Again, or Erasing Recording Data (Reset) [ANALYZE] When recording stops, the message indicates that data has been stored in in- ternal memory. To restart measurement, erase the data stored in the instrument (perform data reset). [ANALYZE] DATA RESET [ANALYZE]...
-
Page 100: Starting And Stopping Recording With Partitioned Memory (Partition: On)
5.4 Starting and Stopping Recording Starting and Stopping Recording with Partitioned Memory (Partition: ON) When memory partitioning is enabled, the internal memory is partitioned into four parts, and data is recorded into each partition. However, no more than 50 events can be recorded, regardless of whether partitioning is enabled. Recording Multiple Times The POWER LED blinks (four and half-seconds on, half-second off [SET]... -
Page 101: Erasing Data
5.5 Erasing Data 5.5 Erasing Data The method to use for erasing data depends on the internal operating state. Internal Operating Partition: OFF Partition: ON State [SET] No data exists. DATA RESET has been pressed. ALL DATA from internal memory will be deleted. -
Page 102: Recovering From A Long-Term Power Outage
2, recording resumes in Partition 3). The following message appears initially when power is restored, and recording resumes immediately. HIOKI 3197 POWER QUALITY ANALYZER V 1.00 Recording Re-started. However, if recording in Memory Partition 4 or with memory partitioning set [OFF] when power is interrupted, recording does not resume when power is restored (even though "Recording Re-started"... -
Page 103: Chapter 6 Viewing Data
Chapter 6 Viewing Data The three data display screen types are called [VIEW], [TIME PLOT] and [EVENT]. Viewing Instantaneous Data (displays the measurement status about once per second) Screen Display Setting Contents Ref. Displays instantaneous measure- [WAVEFORM] ment values. "6.1 Viewing Instanta- [VECTOR] VIEW Measurement data can be viewed at... -
Page 104: Viewing Instantaneous Data (View Screen)
6.1 Viewing Instantaneous Data (VIEW Screen) 6.1 Viewing Instantaneous Data (VIEW Screen) There are four types of VIEW screens: [WAVEFORM], [VECTOR], [HAR- MONICS] and [DMM]. Press the VIEW key to switch between them. The VIEW screens display instantaneous data by refreshing about once per second, regardless of the internal operating state ( [SET] [RECORDING]... -
Page 105: Viewing Waveforms [Waveform]
6.1 Viewing Instantaneous Data (VIEW Screen) Viewing Waveforms [WAVEFORM] Voltage and current waveforms and rms values (voltage, current and active power) are displayed together. The number of displayed channel waveforms depends on the selected wir- ing configuration. Select the screen. Magnifying and Compressing Wave- Instantaneous voltage forms on the Vertical Axis... -
Page 106: Vector Display [Vector]
6.1 Viewing Instantaneous Data (VIEW Screen) Vector Display [VECTOR] Voltage and current vectors are displayed. The rms voltages and phase angles, and the rms currents and phase angles of the fundamental wave- form are also displayed. The number of channels for which vectors are dis- played depends on the selected wiring configuration. -
Page 107: Displaying Harmonics [Harmonics]
6.1 Viewing Instantaneous Data (VIEW Screen) Displaying Harmonics [HARMONICS] Harmonics can be displayed in a bar graph or in a list. The display method is selected by the F1 key. Displaying the harmonics bar graph The harmonics bar graph displays voltage, current and power from the fundamental waveform to the 50th order. - Page 108 6.1 Viewing Instantaneous Data (VIEW Screen) Displaying the Harmonic List The harmonic list shows values of voltage, current and power. The voltage total harmonic distortion (THD) is also displayed. Select the screen. Select the [GRAP/LIST] Voltage Active Power display Current To change the displayed channel Changes in the sequence: Channels that can be switched are determined by the wir-...
-
Page 109: Displaying The Dmm Screen (Voltage, Current And Instantaeous Power Values)[Dmm]
6.1 Viewing Instantaneous Data (VIEW Screen) Displaying the DMM Screen (voltage, current and instantaeous power values) [DMM] The following measurement values are displayed numerically (DMM screen). U rms U peak+ U peak- U THD Voltage Total rms voltage Voltage Waveform Peak Value Harmonic Distortion I rms I peak+... -
Page 110: Displaying A Time Series Plot (Time Plot Screen)
6.2 Displaying a Time Series Plot (TIME PLOT screen) 6.2 Displaying a Time Series Plot (TIME PLOT screen) There are four TIME PLOT screens, called [RMS], [DIP/SWELL], [DEMAND] and [ENERGY]. The displayed screen changes each time you press the TIME PLOT key. During the internal operating state, the graphs on the TIME [RECORDING]... -
Page 111: Displaying The Rms Fluctuation Graph [Rms]
6.2 Displaying a Time Series Plot (TIME PLOT screen) Displaying the Rms Fluctuation Graph [RMS] View a fluctuation graph of parameters selected from voltage; current; volt- age and current waveform peak values ( ); frequency; active, reactive and ± apparent power; power factor; displacement power factor; THD and voltage unbalance factor. - Page 112 6.2 Displaying a Time Series Plot (TIME PLOT screen) Selectable Display Parameters Display Display Display Contents Display Contents Parameter Parameter Freq Frequency U3peak+ CH3 (+) voltage waveform peaks CH1 voltage U3peak- CH3 (-) voltage waveform peaks CH1 current I3peak+ CH3 (+) current waveform peaks CH2 voltage I3peak- CH3 (-) current waveform peaks...
-
Page 113: Displaying A Voltage Fluctuation Graph [Dip/Swell]
6.2 Displaying a Time Series Plot (TIME PLOT screen) Displaying a Voltage Fluctuation Graph [DIP/SWELL] An rms voltage fluctuation graph is displayed. You can view this graph to confirm rms voltage fluctuations when evaluating voltage dip (DIP), voltage swell (SWEL) and interruptions. Select the screen. -
Page 114: Displaying A Demand Graph [Demand]
6.2 Displaying a Time Series Plot (TIME PLOT screen) Displaying a Demand Graph [DEMAND] The demand value is the average power [kW] consumed during the demand period (typically 30 minutes), and is used in power company transactions. The demand graph is refreshed after each demand period. A bar graph is displayed at the start of recording, but for long-term recording, the display changes to a fluctuation graph. -
Page 115: Displaying An Energy Consumption Graph [Energy]
6.2 Displaying a Time Series Plot (TIME PLOT screen) Displaying an Energy Consumption Graph [ENERGY] Energy values are calculated as power times time. Active power value [Wh] = Active power [W] x Time [h] Reactive power value [Varh] = Reactive power [Var] x Time [h] Example. -
Page 116: Viewing Anomalous Phenomena (Event Screen)
6.3 Viewing Anomalous Phenomena (EVENT screen) 6.3 Viewing Anomalous Phenomena (EVENT screen) There are four EVENT screens, called [LIST], [WAVEFORM], [VOLTAGE] and [INRUSH]. The displayed screen changes each time you press the EVENT key. The Event List appears on all screens. During the internal operating state, the EVENT screens are [RECORDING]... -
Page 117: Viewing The [Inrush] Screen
6.3 Viewing Anomalous Phenomena (EVENT screen) Viewing the [INRUSH] Screen DETAILS WAVEFORM INRUSH... -
Page 118: Detection Methods And Recording Contents Of Events
6.3 Viewing Anomalous Phenomena (EVENT screen) Detection Methods and Recording Contents of Events Rms voltage (Urms1/2) (use to detect voltage swells, voltage dips and interruptions) • Calculation Method Rms voltage (Urms 1/2) is calculated separately for three channels at every half cycle. Voltage Swell •... - Page 119 6.3 Viewing Anomalous Phenomena (EVENT screen) Voltage Dip • Detection Method Detect Using Urms 1/2. Set the threshold as a percentage of nominal volt- age. When the rms voltage falls below the nega- tive threshold, it is detected as an “EVENT IN (onset)"...
- Page 120 6.3 Viewing Anomalous Phenomena (EVENT screen) Transient Overvoltage • Detection Method During each cycle, signals between 10 and 100 kHz are detected by comparator on any of three voltage channels if their amplitude exceeds ±70.7 Vpeak. Presence Detection • Recording Contents Event List data, voltage/current waveforms •...
- Page 121 6.3 Viewing Anomalous Phenomena (EVENT screen) Inrush Current • Detection Method Detects using Irms 1/2. Set the current threshold value. An event is detected when the current exceeds the threshold in the positive direction. • Recording Contents Event list data, voltage/current waveforms, inrush current fluctuation graph •...
-
Page 122: Operations Common To The Event Screens
Event List when more than eight events have occurred. For Users of the Model 3196 Power Quality Analyzer Note that the event number assignment method of the Model 3197 Power Quality Analyzer is the opposite of Model 3196. Multiple events occurring within the same 200-ms period are displayed together as a single event. - Page 123 6.3 Viewing Anomalous Phenomena (EVENT screen) Recordable Number of Events The number of events that can be recorded is as follows regardless of whether internal memory is partitioned. Recordable Event Description Qty. Overall Event List, details, voltage/current wave- Event data Total 50 forms Event voltage fluctuation graph...
- Page 124 6.3 Viewing Anomalous Phenomena (EVENT screen) The Event List Item Example Description Details Event Number Event Number Displays from 1 to 50. Date 10/03 Month/Day Time 13:49:11.320 Hour:Min:Sec 1 ms resolution START Start STOP Stop MANUAL Manual TIMER Timer Event Type SWELL Voltage Swell Voltage Dip...
-
Page 125: Viewing Event Detection Details [Details]
6.3 Viewing Anomalous Phenomena (EVENT screen) Viewing Event Detection Details [DETAILS] Details of an event selected in the Event List can be viewed in the Event Detail List. When multiple events have occurred, the details of the events can be viewed in the Event Detail List. Multiple events occurring within the same 200-ms period are displayed together as a single event. - Page 126 6.3 Viewing Anomalous Phenomena (EVENT screen) Event Detail List Item Example Description Description Time 11.320 Seconds 1 ms resolution START Start STOP Stop MANUAL Manual TIMER Timer SWELL Voltage Swell Event Type Voltage Dip INTER. Interruption TRANSIENT Transient Overvoltage INRUSH Inrush Current Channel 1 Channels...
- Page 127 6.3 Viewing Anomalous Phenomena (EVENT screen) Waveform Anomaly Recording Methods (Data Displayed on EVENT Screen) Event Types other than Voltage Swell, Voltage Dip and Interruption SYSTEM-[REC & EVENT] Interval (Selected Period) 200 ms (10 cycles at 50 Hz, 12 cycles at 60 Hz) Rms Calculation EVENT Occurrence Rms Calculation...
-
Page 128: Displaying Detected Event Waveforms [Waveform]
6.3 Viewing Anomalous Phenomena (EVENT screen) Displaying Detected Event Waveforms [WAVEFORM] 「」 The event waveform is displayed for the event selected in the Event List. Pressing the up and down cursor keys sequentially changes the selected event waveform. Select the screen. Select voltage or current waveforms. -
Page 129: Displaying Detected Voltage Fluctuation Events [Rms Wave]
6.3 Viewing Anomalous Phenomena (EVENT screen) Displaying Detected Voltage Fluctuation Events [RMS WAVE] Select a voltage dip, voltage swell or interruption EVENT IN (Onset) event having an *U indicator in the Event List to display its voltage fluctuation graph. Pressing the up/down cursor keys switches the display sequentially between events. -
Page 130: Displaying Detected Inrush Current Events [Inrush]
6.3 Viewing Anomalous Phenomena (EVENT screen) Displaying Detected Inrush Current Events [INRUSH] Select the event with the *I indicator in the Event List to display its inrush current graph. Pressing the up/down cursor keys switches the display sequentially between events. The rms current fluctuation graph is calculated from each half-cycle measurement (Irms 1/2). -
Page 131: Viewing Recorded Data ([Review] State)
6.4 Viewing Recorded Data ([REVIEW] State) 6.4 Viewing Recorded Data ([REVIEW] State) Data stored in internal memory when memory is partitioned [ON] can be viewed and re-analyzed. After recording data in the state, switch to the [REVIEW] state to re- [SET] analyze data. -
Page 132: Viewing Data Recorded In Multiple Memory Partitions
6.4 Viewing Recorded Data ([REVIEW] State) Viewing Data Recorded in Multiple Memory Partitions In the [REVIEW] state, [SYSTEM], [TIME PLOT] and [EVENT] data recorded in multiple memory partitions (Nos. 1 to 4) can be analyzed. From the TIME PLOT or EVENT screen, [SET] select the state. -
Page 133: Analyzing Time Plot Data
6.4 Viewing Recorded Data ([REVIEW] State) Analyzing TIME PLOT data TIME PLOT data recorded in multiple memory partitions can be analyzed by switching the browsed memory partition using the F4 (Previous Data) key. The selected memory partion is indicated by a blue frame. At that time, the [SYSTEM] data (that was set when the selected memory was recorded) is displayed. - Page 134 6.4 Viewing Recorded Data ([REVIEW] State)
-
Page 135: Viewing Data On A Computer
Communication between the instrument and a computer is available by connecting the supplied USB cable between them. The supplied CD contains communication programs. The two applica- tion programs for this instrument are called "3197 Communicator" and "3197 Data Viewer". PC application program for Model 3197... -
Page 136: Pc System Requirements
Check for the presence of the Java applet in the Windows Control Panel to confirm that Java is installed. Operates the instrument remotely (observation, 3197 Communi- control and saving screen image). cator Transfers screen images and measurement data Application for Supplied from the instrument's internal memory. -
Page 137: Preparing To Run The Application Programs
Turn on the instrument. Connect the instrument to the computer with the supplied USB cable (p. 134). (Connect if using "3197 Communicator".) Start the application programs. To avoid malfunctions and data loss, do not plug or unplug the USB cable while in use. -
Page 138: Installing Jre
7.2 Installing JRE 7.2 Installing JRE Installation procedure Download the Java Runtime Environment from the Java homepage (http://www.java.com/). Follow the instructions on the screen, run and install the Java (TM) SE Runtime Environment. Select [I accept the terms in the license agreement] and click [Next] if you agree to the terms of the License Agreement. - Page 139 7.2 Installing JRE When the installation process has completed successfully, click [Finish]. Click...
-
Page 140: Installing The Application Programs
7.3 Installing the Application Programs In addition to the USB driver, two instrument application programs can be installed on the computer: "3197 Communicator" and "3197 Data Viewer". The procedure for installing the instrument applications on a Windows XP computer is described here. - Page 141 7.3 Installing the Application Programs To change the installation destination, click [Change] and select the des- tination. Then click [Next]. 1 Click 2 Click Click [Install]. Click Click [Finish] to complete the installation. Click...
-
Page 142: Connecting The Instrument And Computer With The Supplied Usb Cable
7.4 Connecting the Instrument and Computer with the Supplied USB Cable Uninstall Procedure To uninstall, open Add or Remove Programs in the Windows Control Panel, and select [3197 Applications]. When updating the applications, first uninstall the old versions. 7.4 Connecting the Instrument and Computer... - Page 143 7.4 Connecting the Instrument and Computer with the Supplied USB Cable This example presumes the computer is running Windows XP. Select "No, not this time", and click [Next]. 1 Select 2 Click Select "Install from a list or specific location (Advanced)", and click [Next] Making the wrong selection can prevent the correct driver from installing.
- Page 144 On-screen confirmation is accessible at [ ] - [ ] - [ Control Panel System Hard- ] - [ ]. The instrument's model name and serial No. are ware Device Manager displayed in [ HIOKI USB488-Device Multiple instruments are recognized when connected.
- Page 145 7.4 Connecting the Instrument and Computer with the Supplied USB Cable Disconnecting the USB cable When disconnecting a USB cable between the instrument and a running computer, perform the following steps: • Turn the instrument off. • Open the "Safely Remove Hardware" icon in the computer's Notifica- tion area, and select the instrument to disconnect.
-
Page 146: Starting The Instrument Application Programs
] - [ ] - [ All Programs HIOKI 3197 ] - [3197 Communicator]. Applications To start the "3197 Data Viewer" application From the Windows [ ] menu, select [ ] - [ ] - [ start All Programs HIOKI 3197 ] - [3197 Data Viewer]. -
Page 147: Chapter 8 Specifications
8.1 General Specifications Chapter 8 Specifications 8.1 General Specifications Environmental and Safety-Related Specifications Operating environment Indoors, up to 2000 m (6562-ft.) ASL Storage temperature -10 to 50°C (14 to 122°F), 80% RH or less (non-condensating) and humidity Operating temperature 0 to 40°C (32 to 104°F), 80% RH or less (non-condensating) and humidity Withstand voltage @50/60 Hz, for 15 s... - Page 148 8.1 General Specifications Measurement Input Specifications Wiring configurations Single-phase 2-wire (1P2W), single-phase 3-wire (1P3W), three- phase 3-wire (3P3W2M and 3P3W3M ), three-phase four-wire (3P4W and 3P4W2.5E), Neutral current calculation and display Measurement line Autoselecting (50/60 Hz) frequency Measurement input Voltage: isolated inputs and differential inputs (not isolated between U1, U2, U3 and N) method Current: isolated inputs by clamp-on sensors...
- Page 149 8.1 General Specifications Measured and Detected Parameter Specifications Measured parameters Voltage (½), Current (½) Voltage, peak voltage, current, peak current, frequency, active power, reactive power, apparent power, power factor, displacement power factor, active power, reactive power, active power demand, reactive power demand, voltage harmonics, current harmonics, power harmonics, fundamental waveform phase angle, voltage total harmonic distortion, K factor, voltage unbalance factor...
- Page 150 8.1 General Specifications Guaranteed Accuracy Specifications Conditions of guaranteed After 30 minutes warm-up, sine wave input, power factor 1, accuracy frequency 50/60 Hz ±2 Hz Temperature and humidity @23 ±5°C (73±9°F), 80% RH or less This temperature and humidity specification applies unless specified range for guaranteed otherwise accuracy...
-
Page 151: Accessories
8.1 General Specifications Accessory and Option Specifications Accessories • Model L9438-55 Voltage Cord (Four black measurement leads, EN61010-22031 :2001, for international) • Model 9418-15 AC Adapter • Power cord (region-specific) • Model 9459 Battery Pack • Input terminal label sheet (5 wiring types) •... -
Page 152: Detailed Specifications Of Measurement Parameters
8.2 Detailed Specifications of Measurement Parameters 8.2 Detailed Specifications of Measurement Parameters Measurement Parameter [Voltage] Measurement method 200 ms calculation Urms Measurement range 600.0 V Measurement accuracy ±0.3% rdg. ±0.2% f.s. Crest factor 2 or less (w/full-scale input) [Voltage(1/2)] rms method, one cycle calculation refreshed every half Measurement method cycle Urms1/2... - Page 153 8.2 Detailed Specifications of Measurement Parameters Measurement Parameter [Frequency] Measurement source U1 Voltage Measurement method 200 ms calculation Measurement display 40.00 to 70.00 Hz range Usable measurement 45.00 to 66.00 Hz range Measurement range 99.99 Hz ±0.01 Hz ±1 dgt. or less (with a sine wave between 10 Measurement accuracy and 110% of the range applied to U1) Display when measure-...
- Page 154 8.2 Detailed Specifications of Measurement Parameters Measurement Parameter [Displacement Calculated from phase difference between fundamental Measurement method voltage and current waveforms, 200 ms calculation Power Factor] -0.000 to -1.000 (leading), +0.000 to +1.000 (lagging) Measurement range 0.0000 to 1.0000 (leading), + 0.0000 to + 1.0000 (lagging) Measurement accuracy ±1 dgt.
- Page 155 8.2 Detailed Specifications of Measurement Parameters Measurement Parameter [HARMONICS] 2048-point DFT Measurement method (frequency is calculated as correct 5 0/60 Hz) Harmonic analysis 200 ms (10 cycles @50 Hz, 12 cycles @60 Hz) window width Points per window 2048 Harmonic analysis Rectangular window Harmonic analysis...
- Page 156 8.2 Detailed Specifications of Measurement Parameters Wiring Configuration Measurement Parameters Measurement Parameter 1P2W 1P3W 3P3W2M,3P3W3M 3P4W,3P4W2.5E Voltage (1/2) Urms1/2 1, 2 1, 2, 3 1, 2, 3 Voltage Urms 1, 2, ave 1, 2, 3, ave 1, 2, 3, ave ±...
- Page 157 8.2 Detailed Specifications of Measurement Parameters Time Series Calculations Time series calculation MAX, MIN and AVE values More negative peak voltage (-) and peak current (-) values are values handled as minima, and less negative values are handled as maxima Time series calculation MAX, MIN and AVE values are calculated within the specified interval method...
-
Page 158: Event Specifications
8.3 Event Specifications 8.3 Event Specifications Event Type Voltage Swell, Volt- Measurement Detection using voltage (½) measured every half cycle method age Dip, Interruption Detected event Voltage Swell: Maximum voltage (worst value), types occurrence time, recovery time, period Voltage Dip: Residual voltage (worst value), occurrence time, recovery time, period) Interruption: Residual voltage voltage, detection date/ time, recovery date/time, period... - Page 159 8.3 Event Specifications Event Type Timer Measurement Detect events at preset intervals method Timer event OFF, 1, 5, 15 or 30 minutes; 1, 2 or 12 hours; or 1 day interval Detection criteria Occurrence time Recording Event data, event waveform contents Event data format Event number, date, time, event type Manual...
-
Page 160: Function Specifications
8.4 Function Specifications 8.4 Function Specifications Display SYSTEM Settings VIEW Waveforms, DMM, vectors, harmonics (bar graph/list) TIME PLOT Voltage (½), voltage, current, frequency, active power, power factor, voltage total harmonic distortion, voltage unbalance factor, energy consumption, demand EVENT Event list, event monitor, event waveform, event voltage fluctuation graph, inrush current graph Setting Contents (factory defaults in bold) Measurement frequency... - Page 161 8.4 Function Specifications Setting Contents (factory defaults in bold) Demand period 15 min., 30 min. and 1 hour Real-time control ON / OFF (both starting from zero seconds) Settable start time Year, month, day, hour and minute (24-hour system, valid for the specified time) Settable stop time Year, month, day, hour and minute (24-hour system, valid for the...
- Page 162 8.4 Function Specifications Other Functions Wiring configuration Wiring configuration diagram display diagram display Phase (input terminal) Displays wiring configurations, numerical values, waveforms and vectors with selected phase colors color selection Battery check Remaining battery charge Display hold Display Hold on/off (VIEW screen only) Warning indicators Crest factor out-of-range, frequency selection error, internal memory overwrite error...
- Page 163 8.4 Function Specifications Memory Backup Operation Maximum recordable data Image data: 10 images Measurement data Event Data: 50 events Event voltage fluctuation graph data: 20 graphs Inrush current data: 1 measurement TIME PLOT data: see following table Recordable TIME PLOT data period Interval No Memory Partitioning 4 Memory Partitions...
-
Page 164: Calculation Formulas
8.5 Calculation Formulas 8.5 Calculation Formulas Basic Calculation Formulas Single- Single-Phase Wiring Phase Three-phase, 3-wire Three-Phase 4-Wire 3-Wire Configuration 2-Wire *1 Parameter 1P2W 1P3W 3P3W2M 3P3W3M 3P4W 3P4W2.5E Voltage (1/2) Inter-line voltage Inter-line voltage Phase voltage U(1/2) [Vrms] +(-U are assumed) –... - Page 165 8.5 Calculation Formulas Single- Single-Phase Wiring Configu- Phase Three-phase, 3-wire Three-Phase 4-Wire 3-Wire ration 2-Wire Parameter 1P2W 1P3W 3P3W2M 3P3W3M 3P4W 3P4W2.5E (1/2) Current I(1/2) [Arms] 3 (I I1s+I2s+I3s = 0 are assumed) – ---- - Current I [Arms] 3 (I (Assuming 4 (I...
- Page 166 8.5 Calculation Formulas Single- Wiring Single-Phase Phase Three-phase, 3-wire Three-Phase 4-Wire Configuration 3-Wire 2-Wire Parameter 1P2W 1P3W 3P3W2M 3P3W3M 3P4W 3P4W2.5E Active Power Psum = P Psum = P (Using Ucs as phase voltage) P [W] – × ---- - Ssum = S Ssum = S Apparent...
- Page 167 8.5 Calculation Formulas Energy Consumption and Demand Formulas Single- Single-Phase Three-Phase Wiring Phase Three-phase, 3-wire 3-Wire 4-Wire Configuration 2-Wire 3P4W, Parameter 1P2W 1P3W 3P3W2M 3P3W3M 3P4W2.5E Active Power value sum+ sum+ (amount of con- sumption) C(+) WP+ [kWh] Active Power value sum- sum- (amount of regener-...
- Page 168 8.5 Calculation Formulas Harmonic Formulas Single- Single-Phase Three-Phase Wiring Phase Three-phase, 3-wire 3-Wire 4-Wire Configuration 2-Wire 3P4W, Parameter 1P2W 1P3W 3P3W2M 3P3W3M 3P4W2.5E Harmonic Inter-Line Phase Voltage Phase Voltage Voltage Voltage [Vrms] U1s+(-U2s)+U3s=0 are assumed) Harmonic Current Assuming [Arms] =0 ) Harmonic sumk =P1k + P2k...
- Page 169 8.5 Calculation Formulas Single- Single-Phase Three-Phase Wiring Phase Three-phase, 3-wire 3-Wire 4-Wire Configuration 2-Wire 3P4W, Parameter 1P2W 1P3W 3P3W2M 3P3W3M 3P4W2.5E φ Fundamental φ 1(1) φ φ 1(1) waveform φ 1(1) 2(1) φ 2(1) Voltage phase 3(1) angle *2 φ ...
- Page 170 8.5 Calculation Formulas Single- Single-Phase Three-Phase Wiring Phase Three-phase, 3-wire 3-Wire 4-Wire Configuration 2-Wire 3P4W, Parameter 1P2W 1P3W 3P3W2M 3P3W3M 3P4W2.5E Voltage Total Harmonic Distortion × ------------------------------- - U Fc Current Total Harmonic Distortion I THD × ----------------------------- K factor ...
-
Page 171: Maintenace And Service
• The fuse is housed in the power unit of the instrument. If the power does not turn on, the fuse may be blown. If this occurs, a replacement or repair cannot be performed by customers. Please contact your dealer or Hioki representa- tive. - Page 172 • A power protection component may be damaged. As these are not intended to be replaced or repaired by customers, please contact your supplier or nearest Hioki representative. If the cause is unknown Try performing a system reset. All settings are returned to their factory defaults.
-
Page 173: Cleaning
9.2 Cleaning 9.2 Cleaning Cleaning the Instrument • To clean the instrument and input modules, wipe it gently with a soft cloth moistened with water or mild detergent. Never use solvents such as benzene, alcohol, acetone, ether, ketones, thinners or gasoline, as they can deform and discolor the case. -
Page 174: Battery Pack Replacement And Disposal
• Expected battery pack life is about one year (or about 500 recharges). Replace only with another Hioki Model 9459 Battery Pack. • The battery pack is subject to self-discharge. Be sure to charge the battery pack before initial use. -
Page 175: Disposing Of The Instrument
9.4 Disposing of the Instrument 9.4 Disposing of the Instrument Before Disposing of the Instrument The instrument contains a lithium battery for memory backup. Remove this battery before disposing of the instrument. • To avoid electrocution, turn off the power switch and disconnect the power cord and cables before removing the lithium battery. - Page 176 9.4 Disposing of the Instrument...
-
Page 177: Appendix
Appendix 1 Interval and Recording Time Settings Appendix Appendix 1 Interval and Recording Time Settings Notes regarding the following table: *1. The recording interval automatically changes to the next longer interval when the longest record- ng time for the currently selected interval is exceeded. The data at the start of measurement de- pends on the last interval selected when the previous measurement finished. - Page 178 Appendix 1 Interval and Recording Time Settings Interval setting: [Auto] When memory partitioning is set [OFF] When memory partitioning is set [ON] 2day 18days 8hours 7days 12hour 4days 14hours 19hours 31days 15min 3day 27days 12hours 1day 30min 6hours 4day 4day 36days 16hours 1day 9days 4hours...
- Page 179 Appendix 1 Interval and Recording Time Settings Notes regarding the following table: *1. Measurement is finished when the Longest Recording Time for the current Recording Interval has elapsed. *2. The “Longest Recording Time” is the longest time that can be measured with the current record- ing interval.
- Page 180 Appendix 1 Interval and Recording Time Settings Interval: 1, 5, 15, 30 and 60 min case When memory partitioning is set [OFF] When memory partitioning is set [ON] 1day 9days 4hours 1day 9days 4hours 2day 18days 8hours 2day 18days 8hours 31days 6hours 3day...
-
Page 181: Appendix 2 Relation Between Graph Divisions And Time
Appendix 2 Relation Between Graph Divisions and Time Appendix 2 Relation Between Graph Divisions and Time Example of the case of seven graph divisions 7+1/3div 0div 1div 2div 3div 4div 5div 6div 7div ↑ ↑ ↑ ↑ ↑ ↑ ↑ ↑... - Page 182 Appendix 2 Relation Between Graph Divisions and Time Example of the case of nine graph divisions 9+1/6div 0div 1div 2div 3div 4div 5div 6div 7div 8div 9div ↑ ↑ ↑ ↑ ↑ ↑ ↑ ↑ ↑ ↑ Time- Plot Div 0div 1div 2div...
-
Page 183: Appendix 3 3197 Data-Header Composition
Appendix 3 3197 Data-header Composition Appendix 3 3197 Data-header Composition Classifica- Header Explanation tion Date Date Date Time Time Time Status Status Status Umax1, Umax2, Umax3 Voltage (1/2) Maximum value TIME PLOT DIP/SWELL Umin1, Umin2, Umin3 Voltage (1/2) Minimum value... -
Page 184: Appendix 4 Displayed And Measurement Ranges
Appendix 4 Displayed and Measurement Ranges Appendix 4 Displayed and Measurement Ranges The displayed ranges and ranges of usable measurements (guaranteed accu- racy) are as follows: Voltage Range 660V Range of Valid Measurements 600 V Range 780V Display Range 1.0V 100V 1000V Input Voltage... -
Page 185: Appendix 5 Power Range Structure
Appendix 5 Power Range Structure Appendix 5 Power Range Structure Power Range Structure Table 1 Using Model 9657-10 or Using Model 9694 or Using Model 9660 or Current Range 9675 (100 mV/A) 9695-02 (10 mV/A) 9695-03 (5 mV/A) Voltage Wiring 500.0mA 5.000A 5.000A... -
Page 186: Appendix 6 Clamp Sensor Combined Accuracy
Appendix 6 Clamp Sensor Combined Accuracy Appendix 6 Clamp Sensor Combined Accuracy Current and Power Accuracy of Clamp Sensor Combinations 3197 R ange Combined Accuracy Clamp Sensor ± ± 0.5A 1.3%rdg. 1.2%f.s. 9657-10 ± ± 1.3%rdg. 0.3%f.s. ± ± 0.5A 1.3%rdg. -
Page 187: Appendix 7 How To Resolve Usb Data Transfer Problems
Open your computer’s Device Manager from the START – CONTROL PANEL – SYSTEM – Hardware Tab. If not set properly, a question mark icon will appear in front of “Other Devices” and “3197” below it. When the Device Driver is Operating... - Page 188 Appendix 7 How to Resolve USB Data Transfer Problems How to Resolve the Problem Remove the incorrectly set device driver. Right-click on the file name “? 3197” under “Other devices” and select “Uninstall” from the menu. 2 Click 1 Right Click Reset the dedicated device driver.
-
Page 189: Appendix 8 List Of Settings (Default Settings)
Appendix 8 List of Settings (Default Settings) Appendix 8 List of Settings (Default Settings) The settings of this instrument are as follows. : Initialized x: Not Initialized Item Initial State (Factory Default Setting) Power System Resume Reset Measurement frequency AUTO Wiring Configuration 3P4W Nominal Line Voltage... -
Page 190: Appendix 9 Definitions
Appendix 9 Definitions Appendix 9 Definitions Detecting Anomalies and Phenomena Due to Drops in Power Quality Power Quality Waveform Display Phenomenon Related Malfunctions Parameter Occurs typically as a result of Near the source of the phe- lightning, circuit breaker trip- nomena, power devices may Transient ping, fouled relay contacts or... - Page 191 Appendix 9 Definitions Power Waveform Display Phenomenon Quality Related Malfunctions Parameter Occurs typically as a result of Near the source of the phe- lightning, circuit breaker trip- nomena, power devices may Transient ping, fouled relay contacts or sustain damage or opera- Overvoltage load shutdown.
-
Page 192: Power Measurement By The Two-Meter Method, And U3, I3 Measurement Theory
Appendix 9 Definitions Power Measurement by the Two-Meter Method, and U3, I3 Measure- ment Theory (3P3W2M Wiring Configuration Mode) → Three-Phase, Three-Phase, 3-Wire 3-Wire Load Side Source Side 1 , U 2 , U Inter-line voltage vectors ... - Page 193 Appendix 9 Definitions Also, under these conditions, the sums of the voltage and current vec- tors is always zero, so, − | = | − | = |− are calculated internally to obtain measurements of the voltage and cur- rent of the third phase.
-
Page 194: Terminology
Appendix 9 Definitions Terminology K Factor Also called the multiplication factor, the K factor expresses the power loss caused by harmonic currents in a transformer. The formula for calculating K factor (KF) is: × --------------------------------- - ... - Page 195 Appendix 9 Definitions Unbalance • Balanced (Symmetrical) Three-Phase Voltage (Current) Factor This term denotes three-phase alternating voltage or current when each phase has the same voltage (or current) and a phase difference of 120 degrees between phases. • Unbalanced (Asymmetrical) Three-Phase Voltage (Current) Denotes three-phase alternating voltage or current when the voltages (or currents) of the phases are not the same, or when the phase difference between the phases is not 120 degrees.
- Page 196 Appendix 9 Definitions Power Factor Power factor is the ratio of effective power to apparent power. The larger the ab- solute value of the power factor, the greater the proportion of effective power, (PF/DPF) which provides the power that is consumed, and the greater the efficiency. The maximum absolute value is 1.
-
Page 197: Index
Index Index Index Numerics 1P2W Event list ..............83 ..........114, 116 1P3W Event monitor ..............83 ......... 114, 115 3197 Communicator EVENT Screen ........127 ..........108 3197DataViewer ..........127 DETAILS ............. 117 3P3W2M ............84 INRUSH ............122 3P3W3M ............84 RMS WAVE ..........121 3P4W ..............85... - Page 198 Index Index ............. 103 Time start ............66 Nominal Line Voltage ........59 Timer ............69, 113 Transient ............70 Transient overvoltage ......112, A14 Two-wattmeter method .........A16 Partition ........... 34, 63, 89, 92 Typical settings ..........54 ............... 89 ..............92 Period of guaranteed accuracy ....
Need help?
Do you have a question about the 3197 and is the answer not in the manual?
Questions and answers