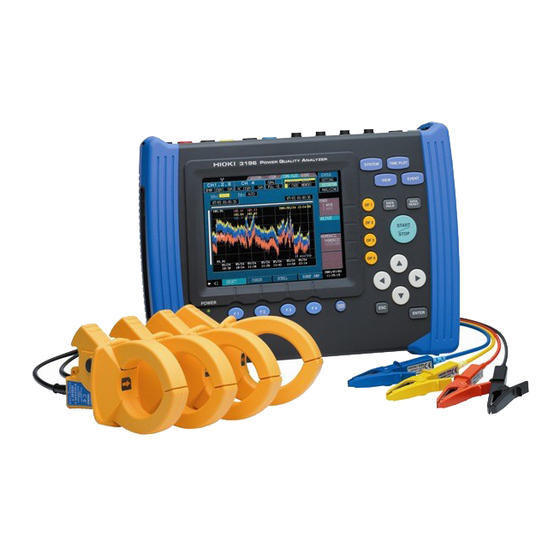
Hioki 3196 Quick Start Manual
Power quality analyzer
Hide thumbs
Also See for 3196:
- Instruction manual (64 pages) ,
- Instruction manual (240 pages) ,
- Manual (32 pages)
Table of Contents
Advertisement
Quick Links
Advertisement
Table of Contents

Subscribe to Our Youtube Channel
Related Manuals for Hioki 3196


Summary of Contents for Hioki 3196
-
Page 1: Power Quality
QUICK START MANUAL 3196 POWER QUALITY ANALYZER... -
Page 3: Table Of Contents
Contents Contents Introduction ..............1 Standard Accessories and Options ......1 Safety Notes ..............4 Usage Notes ..............7 Reading the Operation Procedures ......12 1 Overview Product Overview ..........13 Features ............14 2 Parts Names Instrument Labels and Functions ..... 20 Screen Names and Display Elements .... - Page 4 Quick Start Manual Contents 4 Connecting to Lines to be Measured Connection Procedure ........45 Connection Methods ........46 4.2.1 Single-Phase System Connections ....47 4.2.2 Connecting to Multiple Systems ......49 5 Quick Reference Connection and System Settings ..... 51 Data Display ............. 52 Data Recording, Saving, Loading and Deleting 53 Event Analysis ..........
- Page 5 Contents 8 Specifications 9 Maintenance and Service Cleaning and Storage ........137 Repair and Servicing ........138 Battery Pack Charging ........139 Battery Pack Replacement and Disposal ..140 Instrument Disposal ........141 Appendix Troubleshooting ............143 FAQ ................145 Reference ..............
- Page 6 Quick Start Manual Contents...
-
Page 7: Introduction
Introduction Introduction Thank you for purchasing the HIOKI “3196 POWER QUALITY ANALYZER”. To obtain maximum performance from the product, please read this manual first, and keep it handy for future refer- ence. • Refer to the Instruction Manual (CD-R version) provided with this device. - Page 8 • Before using the product the first time, verify that it operates nor- mally to ensure that the no damage occurred during storage or shipping. If you find any damage, contact your dealer or Hioki representative. • Before using the product, make sure that the insulation on the 9438-02 VOLTAGE CORD is undamaged and that no bare con- ductors are improperly exposed.
- Page 9 Standard Accessories and Options Other • 9726 PC CARD 128M (128MB compact flash card + adapter) • 9727 PC CARD 256M (256MB compact flash card + adapter) peripherals • 9728 PC CARD 512M (512MB compact flash card + adapter) • 9642 LAN CABLE (5 m, straight-through cable, crossover adapter included) •...
-
Page 10: Safety Notes
Quick Start Manual Safety Notes Safety Notes This product is designed to conform to IEC 61010 Safety Standards, and has been thoroughly tested for safety prior to shipment. However, mishandling during use could result in injury or death, as well as damage to the product. Be certain that you understand the instructions and precautions in the manual before use. - Page 11 Safety Notes The following symbols in this manual indicate the relative impor- tance of cautions and warnings. Indicates that incorrect operation presents an extreme hazard that could result in serious injury or death to the user. Indicates that incorrect operation presents a signifi- cant hazard that could result in serious injury or death to the user.
- Page 12 Quick Start Manual Safety Notes Measurement categories (Overvoltage categories) This instrument complies with CAT III safety requirements. To ensure safe operation of measurement instruments, IEC 61010 establishes safety standards for various electrical environments, categorized as CAT I to CAT IV, and called measurement catego- ries.
-
Page 13: Usage Notes
ADAPTER or 9459 the product and to AC power. BATTERY PACK. • For battery operation, use only the HIOKI Model 9459 BAT- TERY PACK. We cannot accept responsibility for accidents or damage related to the use of any other batteries. - Page 14 Quick Start Manual Usage Notes Setting up the 3196 • This product is designed for indoor use, and operates reliably from 0°C to 40°C. It can be used in the temperature range -10°C to 0°C, but LCD operation and accuracy are not assured. Fur-...
- Page 15 Usage Notes Using the clamp-on sensors and voltage Connect the clamp-on sensors or voltage cords to the instru- ment first, and then to the active lines to be measured. Observe the following to avoid electric shock and short cir- cuits. •...
- Page 16 Quick Start Manual Usage Notes • To avoid damaging the power cord, grasp the plug, not the cord, when unplugging the cord or AC adapter from the power outlet. • To avoid damaging the voltage cords or clamp sensor cables, do not bend or pull near their ends.
-
Page 17: Measurement Values
Usage Notes • To avoid damage to the product, do not short-circuit the output terminal and do not input voltage to the output terminal. • The channels of voltage input terminals CH1, CH2, and CH3 are not isolated from one another.To avoid electric shock, do not touch the terminals. -
Page 18: Reading The Operation Procedures
Quick Start Manual Reading the Operation Procedures Reading the Operation Procedures Indicates the operation keys. HARDWARE RS-232 Indicates a display item Indicates the screen name that can be moved using selected using the DF key. the cursor key or an item selection. -
Page 19: Overview 13
1.1 Product Overview Overview 1.1 Product Overview The 3196 POWER QUALITY ANALYZER detects power line anomalities and analyzes power line quality. Need for power sup- Electric power liberalization ply quality analysis Power electronics application devices Large arc heaters, large rectifiers... -
Page 20: Features
Quick Start Manual 1.2 Features 1.2 Features Safe design Designed to comply with safety standard EN61010-1:2001. Supports a variety of power lines Measures single-phase 2-wire, single-phase 3-wire, three-phase 3- wire and three-phase 4-wire systems. An extra input channel is provided for uses such as measuring power lines of a second system, for DC voltage measurement or for measuring a neutral line. - Page 21 1.2 Features ∆-Y and Y-∆ conversion functions provided ∆-Y conversion can be performed on three-phase 3-wire systems, and Y-∆ conversion can be performed on three-phase 4-wire systems. In either case, line-to-line voltage or phase-to-neutral voltage dis- play is available. Up to one month continuous measurement Data is saved to internal memory during the measurement period.
- Page 22 Quick Start Manual 1.2 Features Nickel-Metal-Hydride battery pack supplied The Ni-MH battery backs up internal data when power is off. When fully charged, data is backed up for 30 minutes when power is turned off. Compact and light weight The compact size and light weight allows installation even in lim- ited space, such as in a cubicle.
- Page 23 1.2 Features Measurement is possible on 400 Hz power lines Measure 400 Hz power such as that used for aircraft equipment and shipping tests. Because the usual shipping tests do not include 400 Hz measure- ments, please advise when ordering if your application requires guaranteed accuracy at 400 Hz.
- Page 24 Quick Start Manual 1.2 Features...
-
Page 25: Parts Names 19
Parts Names 4 "Connecting to Lines to be Measured" (page 45) 7.1 "Using a PC Card" (page 109) PC Card 10Base-T 7.3 "Using the Instrument with a Computer" (page 121) RS-232C 3 "Measurement Preparations" (page 29) Printer 7.2 "Using a Printer (Option)"... -
Page 26: Instrument Labels And Functions
Quick Start Manual 2.1 Instrument Labels and Functions 2.1 Instrument Labels and Functions Front Panel DF1-DF4 keys SYSTEM, VIEW, TIMEPLOT and EVENT keys Press these Display Func- Display Select the screen type according tion DF keys to select the 6.4-inch color TFT to the intended usage. - Page 27 2.1 Instrument Labels and Functions Front Panel Enhanced View SYSTEM key Displays the [SYSTEM] screen (for selecting display of system settings). VIEW key TIME PLOT key Displays the [VIEW] screen (for Displays the [TIME PLOT] screen (for se- selecting an Analysis view). lecting the time plot graph).
-
Page 28: Top Panel
Quick Start Manual 2.1 Instrument Labels and Functions Top Panel Voltage Input terminals Connect the supplied 9438-02 VOLTAGE CORD. 3.5 "Connecting the Voltage Cords" (page 33) Black Red BlackYellow Black Blue Black Gray Current Input terminals Connect an optional clamp-on sensor. 3.7 "Using a Clamp-On Sensor (Option)"... -
Page 29: Rear Panel
2.1 Instrument Labels and Functions Right Panel RS-232C Interface connector Connects to a PC, modem or printer using an RS-232C cable. PC Card slot 7.2 "Using a Printer (Option)" (page 116) A PC Card can be inserted here. 7.3 "Using the Instrument with a Computer" 7.1 "Using a PC Card"... -
Page 30: Screen Names And Display Elements
Quick Start Manual 2.2 Screen Names and Display Elements 2.2 Screen Names and Display Elements For details about each screen, refer to the See the Instruction Man- ual (CD-R version). Power ON Each screen type (SYSTEM, VIEW, TIMEPLOT and EVENT) displays the following information in response to the DF keys. -
Page 31: Common Display Elements
2.2 Screen Names and Display Elements 2.2.1 Common Display Elements The display elements common to all screens on the 3196 are as follows. Top of Screen Internal Status Interface & Hold/Lock Screen Selection (page 26) Indicator Indicators (page 27) (page 26) - Page 32 Quick Start Manual 2.2 Screen Names and Display Elements *1: Screen Selection Display [SYSTEM] [TIME PLOT] [VIEW] [EVENT] *2: Internal Operating Status Display One of until preset time to [SETTING] [RECORDING] [WAITING] start measuring), or is displayed to indicate the inter- [ANALYZING] nal status of the instrument.
- Page 33 2.2 Screen Names and Display Elements *3: Memory Usage Indicators INTERNAL MEMORY PC CARD MEMORY TIME PLOT related data capacity Measurement stops when memory becomes full. (Selectable Stop/Continuous) INTERNAL MEMORY Up to 100 EVENT data sets can be stored (when using internal memory) After 100 events are stored, the earliest are overwritten.
- Page 34 Quick Start Manual 2.2 Screen Names and Display Elements *5: SYSTEM Settings Indicators Frequency of Measured PT/CT Ratio Line [SC] (scaling) Appears when the Voltage/Current Range PT or CT ratio has been set. Red Indication: means the Red Indication: means out of (Not displayed): Displayed when measurement frequency is dif- range...
-
Page 35: Measurement Preparations
3.1 Connection Procedure Refer to the indicated reference items before installing and connecting. Attach the Strap Note: If not needed, proceed to step (page 30) 3196 Rear Panel Install the battery pack (page 31) Connect the AC Adapter and the power cord... -
Page 36: Attaching The Strap
Quick Start Manual 3.2 Attaching the Strap 3.2 Attaching the Strap Use the strap to carry the instrument, or to hang it up at the instal- lation location. Attach both ends of the Strap securely to the instrument. If insecurely attached, the instrument may fall and be damaged when carrying. -
Page 37: Installing The Battery Pack
Be aware that if the battery pack is not installed, recorded data is erased when the instrument is turned off. Use only the HIOKI Model 9459 BATTERY PACK. We cannot accept responsibility for accidents or damage related to the use of any other batteries. -
Page 38: Connecting The Ac Adapter
Quick Start Manual 3.4 Connecting the AC Adapter 3.4 Connecting the AC Adapter • Use only the supplied Model 9458 AC ADAPTER. AC adapter input voltage range is 100 to 240 VAC (with ±10% stability) at 50/60 Hz. To avoid electrical hazards and dam- age to the instrument, do not apply voltage outside of this range. -
Page 39: Connecting The Voltage Cords
3.5 Connecting the Voltage Cords 3.5 Connecting the Voltage Cords Connect the voltage cords to the instrument first, and then to the active lines to be measured. Observe the following to avoid electric shock and short cir- cuits. • Voltage cable should only be connected to the secondary side of a breaker, so the breaker can prevent an accident if a short circuit occurs. - Page 40 Quick Start Manual 3.5 Connecting the Voltage Cords Voltage cords and measurement lines Single-phase 2-wire (1P2W) Measurement Line type Black Gray Black Red Voltage input terminals For ground line measurement Single-phase 3-wire (1P3W) Measurement Line type Black Red Black Yellow Black Gray Voltage input terminals...
-
Page 41: Wiring Adapter Connection (Option)
3.6 Wiring Adapter Connection (Option) 3.6 Wiring Adapter Connection (Option) • To avoid electric shock, turn the instrument off when con- necting a wiring adapter. • The maximum rated working voltage is 780 Vrms, 1103 V peak. Attempting to measure voltage in excess of the maxi- mum rating could destroy the product and result in per- sonal injury or death. - Page 42 Quick Start Manual 3.6 Wiring Adapter Connection (Option) Three-phase 4-wire (3P4W) Three-phase 3-wire (3P3W3M) Blue Black Blue Yellow Yellow 9264-01 WIRING ADAPTER 9264-02 WIRING ADAPTER Voltage input terminals For 3P3W2M, cross these connections. 9264-01, 9264-02 WIRING ADAPTER Specifications Operating environment Indoors, altitude up to 2000 m (6562-ft.) °...
-
Page 43: Using A Clamp-On Sensor (Option)
3.7 Using a Clamp-On Sensor (Option) 3.7 Using a Clamp-On Sensor (Option) Connect the clamp-on sensor to the instrument first, and then clamp around the line to be measured. Observe the following to avoid electric shock and short cir- cuits. •... -
Page 44: Clamp-On Sensor Specifications
Quick Start Manual 3.7 Using a Clamp-On Sensor (Option) 3.7.1 Clamp-On Sensor Specifications Refer to the Instruction Manual for the specific model for more details. (Hioki recommendations) 9661 CLAMP ON SENSOR Primary current rating 500 A AC Output voltage 1 mVAC/A °... - Page 45 = (50 x 0.3/100) + (500 x 0.01/100) = 0.15 + 0.05 = 0.20 A Error of 3196 = 50 A (measurement)x 0.2% rdg. + 50 A (range) x 0.1% f.s. = (50 x 0.2/100) + (50 x 0.1/100) = 0.1 + 0.05 = 0.15 A...
- Page 46 LR03 alkaline battery x 4 or 9445-02/03 AC ADAPTER Accuracy of the combination of the 9667 and the 3196: Example: Using the 9667 (500 A rating), 500 A range setting (3196), when mea- suring 500 Arms Error of 9667 + Error of 3196 = Total error Error of 9667 = 500A(measurement) x 2.0%rdg.+ 500A (rating) x 1.5mV/500mV...
-
Page 47: Connecting A Clamp-On Sensor
At each end of the cable, apply the labels having the same color as the current input terminal to which it is to be connected. 3196 Current input BNC plug slots terminal connector guide Align the slots in the BNC plug with... -
Page 48: Turning The Power On/Off
Quick Start Manual 3.8 Turning the Power On/Off 3.8 Turning the Power On/Off • Before turning power on, verify that the instrument and peripheral devices are correctly installed and connected. • When using the AC adapter: AC adapter input voltage range is 100 to 240 VAC (with ±10% stability) at 50/60 Hz. - Page 49 WIRING appears. If an error occurs during self-testing, the instrument may be dam- aged. Contact your dealer or Hioki representative. Before turning off the power Data in internal memory is erased whenever the instrument is turned off. Therefore, to preserve recorded data, be sure to save it to a PC Card.
- Page 50 Quick Start Manual 3.8 Turning the Power On/Off...
-
Page 51: Connecting To Lines To Be Measured
Using a Clamp-On Sensor terminals. (Option)(page 37) Turning the Power On/Off (page 42) Turn on ( | ) the 3196. WIRING Setting Set up the connection (wiring) configu- MEASURE Details ration, nominal voltage and frequency. -
Page 52: Connection Methods
Quick Start Manual 4.2 Connection Methods 4.2 Connection Methods • To measure 3-phase lines, the instrument channels (CHs 1 to 3) should be connected in corresponding phase order. • The instrument can measure from single-phase 2-wire to three- phase 4-wire circuits, but voltage measurement at three points in single-phase circuits is not supported. -
Page 53: Single-Phase System Connections
4.2 Connection Methods 4.2.1 Single-Phase System Connections Single-phase 2-wire (1P2W) A: Line, N: Neutral, G: Ground Load side Source side Black Gray Black U- U+ U- U+ U- U+ U- U+ CH1 CH2 CH3 CH4 U INPUT I INPUT Face the arrow toward the Load Ground line mea- surement, etc. - Page 54 Quick Start Manual 4.2 Connection Methods Three-phase 3-wire (3P3W2M) A, B, C: Lines Load side Source side Black Black Yellow U- U+ U- U+ U- U+ U- U+ CH1 CH2 CH3 CH4 U INPUT I INPUT Face the arrow toward the Load U1=U2=200 V I1=I2=50 A Three-phase 3-wire (3P3W3M)
-
Page 55: Connecting To Multiple Systems
4.2 Connection Methods Three-phase 4-wire (3P4W) A, B, C: Lines, N: Neutral, G: Ground Load side Source side Yellow Blue Gray Black Black Black Black U- U+ U- U+ U- U+ U- U+ CH1 CH2 CH3 CH4 U INPUT I INPUT Face the arrow toward the Ground line mea- Load... - Page 56 Quick Start Manual 4.2 Connection Methods...
-
Page 57: Quick Reference
5.1 Connection and System Settings Quick Reference This chapter describes the operating procedures for var- ious applications. For instrument setting details, See the Instruction Manual (CD-R version). 5.1 Connection and System Settings Connection Settings Connection Methods(page 46), Checking Three-phase Systems(page 57) Verify the connection WIRING diagram... -
Page 58: Data Display
Quick Start Manual 5.2 Data Display 5.2 Data Display Displaying Measurement Data Waveform Display VOLT/CURR VOLT/CURR VOLTAGE CURRENT Vector Display VECTOR DMM (Digital Multi-Meter) POWER Display VOLTAGE CURRENT Harmonic Display GRAPH LIST Displaying Recording Graphs Displays the time series 1 ELEMENT graph of RMS values 2 ELEMENT Displays the time series... -
Page 59: Data Recording, Saving, Loading And Deleting
5.3 Data Recording, Saving, Loading and Deleting 5.3 Data Recording, Saving, Loading and Deleting Recording Manual Recording Finished Start Automatic Recording Set the times to start and end recording RECORDING Actual time START TIME (optional) STOP TIME (optional) Saving, Loading and Deleting Using a PC Card(page 109) Saving, Loading and Deleting Internal Mem-... -
Page 60: Event Analysis
Quick Start Manual 5.4 Event Analysis Hard Copy Using a PC Card(page 109),Using a Printer (Option)(page 116) Manual Hard Copy Display the screen to be output Auto Hard Copy HARDWARE Using a PC Card(page 109) Using a Printer (Option) Timer COPY (page 116) 1 min... -
Page 61: Using Peripheral Devices
5.5 Using Peripheral Devices 5.5 Using Peripheral Devices Setting a Connection Destination HARDWARE RS-232C Using a PC Card 7.1 Using a PC Card (page 109) Using a Printer 7.2 Using a Printer (Option) (page 116) Using a PC 7.3 Using the Instrument with a Computer (page 121) Remote operation by Monitoring with a Web browser via LAN or modem. - Page 62 Quick Start Manual 5.5 Using Peripheral Devices...
-
Page 63: Measurement Method
Hz, 50 A load) location Application • To connect the 3196 to the measured power line while viewing the connection diagram on the screen • To check whether the connection is correct on the vector screen • To check the three-phase voltage and three-phase current wave- forms •... - Page 64 Quick Start Manual 6.1 Checking Three-phase Systems Making 3196 settings MEASURE Select item Make the following settings. Setting Item Selections Select from 123ch/ Wiring 3P3W3M pull-down 123ch/Clamp 1 m V/A 9661 menu 123ch/U Range 600 V 123ch/PT Ratio 123ch/I Range...
- Page 65 6.1 Checking Three-phase Systems Connecting to the lines to be measured WIRING Connect the 3196 to the measured power line while viewing the Load side Source side connection diagram. Black Black Yellow A/B/C: Line Black Blue When using the 9264-01 WIRING ADAPTER, the black cords are not required.
- Page 66 Quick Start Manual 6.1 Checking Three-phase Systems Checking the connections VECTOR Select item Make the following settings. Select from Setting Item Selec- pull-down Checking the vector tions menu ∆Phase Is the vector being measured within ±10° ±10 of the nominal phase range for the ideal (Phase range) vector of each phase? ∆Level...
- Page 67 6.1 Checking Three-phase Systems When they are not within the same colored nominal Remedy ranges 1. When the levels differ • Voltage: Check that the voltage cord has not become disconnected from the power line being measured. Check that the nominal voltage, voltage range, amplitude range, and voltage calculation method are set correctly.
- Page 68 Quick Start Manual 6.1 Checking Three-phase Systems Viewing measured data (1) Checking three-phase voltage and three-phase current waveforms WAVE VOLT/CURR VOLTAGE CURRENT Example: VOLT/CURR When viewing the waveforms for CH1, CH2, and CH3, VOLT/CURR you can view CH2 with a 120 degree LAG for CH1, and CH3 with a 120 degree LAG for CH2 for both voltage and current waveforms.
- Page 69 6.1 Checking Three-phase Systems (2) Checking the voltage unbalance factor and current unbal- ance factor VECTOR • Check the numerical value for the voltage unbalance factor Uunb. 0%The closer the value is to 0%, the more even three-phase volt- age is. The larger the degree of unbalance, the larger the Uunb value.
-
Page 70: Change In Power
Measurement preparations Required for connection: Source side • 3196 + 9458 AC ADAPTER + 9459 BATTERY PACK Power distri- • 9438-02 VOLTAGE CORD Breaker for power bution board... - Page 71 6.2 Change in Power Making 3196 settings (recording settings) RECORDING Make the following settings. Select item Setting Item Selections Rec. Data Power, MAX/MIN/AVE Memory Full STOP Select from Interval 1 min (5 days, 1 h, 51 m) pull-down menu Shows the maximum interval that you can record for using the above settings.
- Page 72 Quick Start Manual 6.2 Change in Power Starting the recording interval When starting or ending recording manually: [SETTING] Setting Item Selections Time Start (Actual time control) Press this when you want to start recording. (Recording starts regardless of the presently displayed screen.) When recording using real-time control: Setting Item...
- Page 73 6.2 Change in Power Viewing measured data during recording (1) Checking recorded conditions using the fluctuation graph Present time Recording start time MAX value: Yellow AVE value: Green MIN value: Red The vertical and horizontal scales for the fluctuation graph during recording are changed automatically.
- Page 74 Quick Start Manual 6.2 Change in Power (2) Confirming voltage and current waveforms during record- VOLT/CURR You can confirm the setting contents (SYSTEM-DF2) and wave- form display (VIEW-DF1/2/3/4) during recording, but you cannot change the contents of setting. When you want to change the setting contents, you must stop recording first.
- Page 75 6.2 Change in Power Viewing measured data that has been recorded Viewing the change in MAX, MIN, and AVE values for RMS voltage over a 5-day interval Present time Recording start time This indicates the area that displays the fluctuation graph for recorded internal memory capacity.
-
Page 76: Harmonic Fluctuation
• To check whether the total voltage distortion or harmonic current limit specified in the IEC Standards have been exceeded Measurement preparations Required for connection: • 3196 + 9458 AC ADAPTER + High-voltage 9459 BATTERY PACK power distribution • 9438-02 VOLTAGE CORD... - Page 77 6.3 Harmonic Fluctuation Making 3196 settings (measurement settings) MEASURE Select item Make the following settings. Setting Item Selections 123ch/ Wiring Select from 3P3W3M pull-down 123ch/ Clamp 10mV/A 9694 menu 123ch/ U Range 150V 123ch/ PT Ratio 123ch/ I Range 50 A...
- Page 78 Quick Start Manual 6.3 Harmonic Fluctuation Making 3196 settings (recording settings and event settings) (1) Recording settings RECORDING Select item Make the following settings. Setting Item Selections Rec. Data P&Harm, MAX/MIN/AVE Select from Memory Full STOP pull-down Interval 30 min...
- Page 79 6.3 Harmonic Fluctuation (2) Event settings EVENT POWER HARMONICS Make the following settings. [POWER] Select item Setting Item Selections 123ch/U THD (Voltage distortion factor) Select from [HARMONICS] pull-down Setting Item Selections menu 123ch/I THD Set the harmonic current limit (Current harmonic) specified in the IEC Standards Confirm Starting the recording...
- Page 80 Quick Start Manual 6.3 Harmonic Fluctuation Viewing measured data during recording Checking recording conditions with the fluctuation graph Current time Recording start time HARMONICS The horizontal scale of the fluctuation graph are changed automati- cally during recording. If you want to change the scale, you must stop recording first. All calculation items that can be displayed for harmonic fluctuation are calculated without gaps every 200 ms.
- Page 81 6.3 Harmonic Fluctuation Ending the recording interval Use the same method as when measuring power fluctuation. (page 68) Viewing recorded measurement data Monitoring fluctuation in MAX, MIN, and AVE values for har- monic RMS voltage over a 1-week period (1) Checking whether total voltage distortion specified in the IEC Standards has been exceeded.
- Page 82 Quick Start Manual 6.3 Harmonic Fluctuation (2) Checking whether the harmonic current limit specified in the IEC Standards has been exceeded. Checking using the time series graph Recording end time Recording start time HARMONICS This indicates the area in recorded in- ternal memory that is shown in the fluctua- tion graph.
- Page 83 6.3 Harmonic Fluctuation Checking using the event list LIST An event occurs when the total voltage distortion factor or harmonic current limit specified in the IEC Standards is exceeded. is displayed in the event category area, an event HARM or THD has occurred.
-
Page 84: Monitoring Interruptions
• To analyze voltage waveforms for event occurrence Use of a PC card enables continuous measurement for more than one month. "Making 3196 settings (recording settings)" (page 81) Measurement preparations Required for measurement: Source side •... - Page 85 6.4 Monitoring Interruptions Making 3196 settings (measurement settings) MEASURE Select item Make the following settings. Items Settings Select from pull-down 123ch/ Wiring 1P2W menu 123ch/ U Range 300 V 123ch/ PT Ratio UReference 230 V Frequency 50 Hz PLL Source...
- Page 86 Quick Start Manual 6.4 Monitoring Interruptions Connecting to the lines to be measured WIRING Connect the 3196 to the power line to be moni- tored while viewing the L: Line, N: Neutral, E: connection diagram. Load side Source side Black voltage cord:...
- Page 87 6.4 Monitoring Interruptions Making 3196 settings (recording settings) RECORDING Make the following settings. Select item Items Settings Power, AVE (You can observe the MAX and Rec. Data Select from MIN values on the voltage fluctua- tion graph even if only AVE set- pull-down tings are made.)
- Page 88 Timer COPY, 2 hour menu If you set the 3196 to print a hard copy to the printer every 2 hours, you can print 360 times in a single month. If you connect the printer, the printer mark Confirm appears in the upper left of the screen when hard copying becomes possible.
- Page 89 6.4 Monitoring Interruptions Making 3196 settings (event settings) VOLTAGE Select item Make the following settings. Items Settings Select from Urms DIP pull-down (Voltage Dip) (Voltage is 90% of nominal 230 V: 207 V) menu U Interrupt (Voltage interrup- (Voltage is 10% of nominal 230 V: 23 V)
- Page 90 Quick Start Manual 6.4 Monitoring Interruptions Changing to a screen for hard copy Display the screen to be printed Example: Event monitor screen MONITOR "0" is displayed when no event has occurred. If an event occurs, the color changes to red and the count is incre- mented.
- Page 91 6.4 Monitoring Interruptions Viewing measurement data (1) Checking recording conditions with the fluctuation graph Current time Recording start time INTERVAL Shows the MAX and MIN real-time values. The MAX and MIN val- ues are recorded to- gether. Displays a time series graph in red only for single-phase 2-wire settings (effective for...
- Page 92 Quick Start Manual 6.4 Monitoring Interruptions (2) View the voltage fluctuation graph for an event When a voltage dip or voltage interruption occurs, display a graph of voltage fluctuation at the time of event occurrence. Current time Recording start time EVENT Voltage values calculated for a single waveform shifted by a half wave are displayed without alteration as a voltage fluctuation graph.
- Page 93 6.4 Monitoring Interruptions Analyzing voltage waveforms upon event occur- rence LIST Event occurrence display For the start of voltage dip occurrences: DIP, CH1, IN Displays the waveform For the end of voltage dip occurrences: DIP, CH1, OUT for the event occurrence. For the start of interruptions: Inter, CH1, IN For the end of interruptions: Inter, CH1, OUT Select the number...
-
Page 94: Detecting Transients And Waveform Distortion
• To display and analyze distorted waveforms that have been detected • To display and analyze transient waveforms that have been detected Measurement preparations Required for measurement: Source side • 3196 + 9458 AC ADAPTER + 9459 BATTERY PACK Power Power distribution • 9438-02 VOLTAGE CORD distribu- circuit breaker... - Page 95 6.5 Detecting Transients and Waveform Distortion Making 3196 settings MEASURE Select item Make the following settings. Select from Items Settings pull-down 3P3W3M 123ch/ Wiring menu 123ch/ U Range 600V 123ch/ PT Ratio 123ch/ I Range 50 A UReference 400 V...
- Page 96 Quick Start Manual 6.5 Detecting Transients and Waveform Distortion Making 3196 settings (recording settings) RECORDING Select item Make the following settings. Items Settings Power, AVE (You can observe the MAX and Rec. Data MIN values on the voltage fluctua- Select from tion graph when AVE is set.)
- Page 97 6.5 Detecting Transients and Waveform Distortion Making 3196 settings (event settings) VOLTAGE Select item Make the following settings. Items Settings Select from U wave pull-down (Voltage waveform The distortion component is detected by menu comparison) comparison with the immediately preced- ing waveform measurement, and is set as a percentage (%) of range.
- Page 98 Quick Start Manual 6.5 Detecting Transients and Waveform Distortion Viewing measurement data Checking recording conditions with the fluctuation graph Current time Recording start time CH1: red CH2: Yellow CH3: Blue VOLTAGE Shows the MAX and MIN real-time values. The MAX and MIN val- ues are recorded to- gether.
- Page 99 6.5 Detecting Transients and Waveform Distortion To determine if an event occurs MONITOR "0" is displayed when no event has occurred. If an event occurs, the color changes to red and the count is incremented. Starts and stops in recording are classed as events. Note that when recording starts, "Other (Ext)"...
- Page 100 Quick Start Manual 6.5 Detecting Transients and Waveform Distortion Analyzing waveforms in which events are detected (1) Displays the event waveform LIST Displays the Event occurrence display waveform for the For voltage waveform comparison event occurrences: Wave event occur- (The channel that the event occurred on is displayed.) For voltage transient event occurrences: Tran rence.
- Page 101 6.5 Detecting Transients and Waveform Distortion (2) Displaying the transient waveform (VIEW voltage/current screen) Transient waveform You can switch to the current waveform dis- play. The screen is divided into two screens, and the lower one switches from current waveform display to transient waveform display. You cannot display the transient waveform display unless the voltage/ current screen is displayed.
-
Page 102: V10 Flicker
V10 flicker measurement. Here, we discuss the case in which only a voltage is connected. Measurement preparations Required for measurement: • 3196 + 9458 AC ADAPTER + High-voltage 9459 BATTERY PACK power distribution • 9438-02 VOLTAGE CORD... - Page 103 ∆ V10 Flicker Making 3196 settings (measurement settings) MEASURE Select item Make the following settings. Setting Item Selections Select from 123ch/ Wiring 3P3W3M or 1P2W pull-down menu 123ch/ U Range 150V 123ch/ PT Ratio UReference 110V Frequency 50 Hz PLL Source...
- Page 104 Quick Start Manual ∆ V10 Flicker Making 3196 settings (recording settings) RECORDING Select item Make the following settings. Items Settings Power, AVE Select from (You can observe the MAX and MIN Rec. Data pull-down values on the voltage fluctuation graph menu when AVE is set.)
- Page 105 ∆ V10 Flicker Viewing measurement data Checking recording conditions with the fluctuation graph (1) Checking the deviation of voltage fluctuations with respect to a standard voltage Current time Recording start time INTERVAL Shows the MAX and MIN real-time values. The MAX and MIN val- ues are recorded to- gether.
- Page 106 Quick Start Manual ∆ V10 Flicker (2) To check how ∆ V10 flicker is varying Current time Recording start time GRAPH Shows the ∆V10 values every 1 minutes. You can only record the channel that is selected as the flicker mea- surement channel.
- Page 107 ∆ V10 Flicker Checking recorded measurement data ∆ To check whether V10 flicker has exceeded a threshold Maximum value Fourth maximum Average over over 1 hour value over 1 hour 1 hour LIST ∆ V10 statistics are confirmed from the list display.
-
Page 108: Iec Flicker
Here, we discuss the case in which only a voltage is connected. Measurement preparations Power distribution board Required for measurement: Source side • 3196 + 9458 AC ADAPTER + 9459 BATTERY PACK • 9438-02 VOLTAGE CORD Power distribution (One each red, yellow, and blue circuit breaker cord, and three black cords.) - Page 109 6.7 IEC Flicker Making 3196 settings (measurement settings) MEASURE Select item Make the following settings. Setting Item Selections Select from 123ch/ Wiring pull-down 3P4W menu 123ch/ U Range 300V 123ch/ PT Ratio UReference 230V Frequency 50 Hz PLL Source Confirm...
- Page 110 Quick Start Manual 6.7 IEC Flicker Making 3196 settings (recording settings) ∆ Use the same method as V10 Flicker (page 98) Event detection is not possible using the Pst, Plt, S(t) value. Accordingly, event settings are not made. Starting the recording Use the same method as when measuring power fluctuation.
- Page 111 6.7 IEC Flicker Viewing measurement data Checking recording conditions with the fluctuation graph (1) Investigate the degree of fluctuation in instantaneous flicker value S(t), which is a measure of perceived instantaneous flicker. Current time Recording start time VOLTAGE Shows the MAX and MIN real-time values.
- Page 112 Quick Start Manual 6.7 IEC Flicker (2) Check the occurrence of IEC flicker (Pst, Plt). Current time Recording start time GRAPH Shows the Pst, Plt val- ues every 10 minutes. The vertical and horizontal scales of the fluctuation graph change auto- matically during recording.
- Page 113 6.7 IEC Flicker Checking recorded measurement data Determine the maximum value of Pst and Plt during the measurement period. LIST The Pst, Plt statistics are confirmed from the list display. Statistics on Pst and Plt are displayed every 10 minutes, along with the date and time.
- Page 114 Quick Start Manual 6.7 IEC Flicker...
-
Page 115: Peripheral Devices
7.1 Using a PC Card Peripheral Devices 7.1 Using a PC Card The PC Card interface of this instrument complies with Card type: Flash ATA Types I and II PCMCIA (Personal Computer Memory Card Internation- Slot: One Type II al Association) and JEIDA (Japan Electric Industry De- Format: MS-DOS velopment Association) PC Card standards. - Page 116 Quick Start Manual 7.1 Using a PC Card Use only PC Cards sold by Hioki. Compatibility and performance are not guaranteed for PC cards made by other manufacturers. You may be unable to read from or save data to such cards.
- Page 117 7.1 Using a PC Card Inserting and Removing a PC Card Inserting a PC Card Open the cover and insert the PC Card with the arrow facing up and in the direction of the PC card slot, as far as it will go. Removing a PC Card Press the Eject button and pull the PC Card out.
- Page 118 • Files in binary format of up to 13 MB (including up to 5 MB of time- series data and up to 100 event data sets) can be loaded into the 3196. We recommend the use of the 9624 PQA-HiVIEW or 9624- 10 PQA-HiVIEW PRO to analyze binary format files.
- Page 119 Auto Save display. (Select) RETURN • In binary format, all measurement data of the 3196 can be saved to a PC card. • When data is automatically saved in text format, only time series...
- Page 120 Quick Start Manual 7.1 Using a PC Card Storing data on a PC card after measurement (during [ANALYZING] PC-CARD SAVE The folder name is created automatically from the BINARY FILE date within the directory structure. TEXT FILE TEXT Select Select the items to be saved when saving as text. (Deselect) (Select) RETURN...
- Page 121 7.1 Using a PC Card Deleting a PC Card File PC-CARD Select the No. to delete (Example) DELETE Automatically Copying a Screen Image to PC Card (Auto Copy) A bitmap image (BMP data) is automatically saved to the PC Card. HARDWARE Setting Item Selections...
-
Page 122: Using A Printer (Option)
Quick Start Manual 7.2 Using a Printer (Option) 7.2 Using a Printer (Option) The instrument can produce hard copies of the screen on the Model 9670 PRINTER connected to the RS-232C interface. 9670 PRINTER (option) The following items are required to use the 9670 PRINTER. •... - Page 123 • As much as possible, avoid printing in hot and humid environ- ments. Otherwise, printer life may be severely shortened. Connecting the 9670 PRINTER to the 3196 Required for connection: 9638 RS-232C CABLE...
- Page 124 Quick Start Manual 7.2 Using a Printer (Option) Loading Recording Paper Paper insertion Load the recording paper into the window 9670 PRINTER. Observe paper direction! Cut the paper hori- zontally. Handling and Storing Recording Paper The recording paper is thermally and chemically sensitized. Observe the following precautions to avoid paper changing color or fading.
- Page 125 7.2 Using a Printer (Option) • The internal settings for the 9670 PRINTER to be used with this instrument are as follows. BL-80RS II/RSII [VX.XX] XXXX/XX/XX SANEI ELECTRIC INC. ********* Data input = Serial International char = Japan Print mode = Graphic Character set = 24Dot ANK Gothic type Select switch = Available (ON) Baud rate = 19200bps...
- Page 126 Quick Start Manual 7.2 Using a Printer (Option) Automatic Screen Hard Copy A screen image is printed automatically at every preset interval. HARDWARE Select item Setting Item Selections COPY Timer (interval setting) (select from menu) Select from pull- Select other settings as needed down menu When the internal operating status is...
-
Page 127: Using The Instrument With A Computer
The instrument can be connected by RS-232C cable to a modem for remote control and monitoring from a modem-equipped PC at another location. (A cellular telephone can also be used.) RS-232C Public circuit RS-232C 3196 Modem Modem Straight Straight cable... -
Page 128: Rs-232C Connection
6 7 8 9 6 7 8 9 Connector pin 9444 CONNECTION CABLE assignments on male side pinout (9-pin) the 3196 (9-pin) CCITT Functions Signal Name Circuit No. Code Addr. Code Addr. Receive Data Send Data Signal Ground... -
Page 129: Lan Connection
7.3 Using the Instrument with a Computer 7.3.2 LAN Connection • To avoid electric shock, always remove the power cord from the instrument and disconnect any test leads before connecting the LAN cable to the instrument. • The instrument and hub or PC should be turned off before connecting them. -
Page 130: Using The External Control Terminals
EVENT EVENT Trigger input terminal HIOKI Anomality Detecting MEMORY HiCORDER Device Event input terminal (EVENT IN) -
Page 131: Specifications
8 Specifications Specifications These specifications apply to the 3196 Power Quality Analyzer Environmental & Safety Specifications Operating environment Indoors, altitude up to 2000 m (6562-ft.) Storage temperature -20°C to 50°C (-4°F to 122°F), 80% RH or less (non-conden- and humidity... - Page 132 Quick Start Manual 8 Specifications Input Specifications Measurement line type One single-phase 2-wire (1P2W), single-phase 3-wire (1P3W), three-phase 3-wire (3P3W2M,3P3W3M) or three-phase 4-wire (3P4W) plus one extra input channel Input channels Voltage:Four channels U1 to U4 (extra channel U4 can mea- sure AC or DC) Current:Four channels I1 to I4 Voltage:Isolated inputs and differential operation...
-
Page 133: Basic Specifications
8 Specifications Basic Specifications Backup lithium battery Lithium battery to back up clock and settings, approx. 10 years (reference at 23°C, 73°F) life Clock functions Auto calendar, auto leap year, 24-hour clock Real-time clock ±0.3 s/day or better (instrument on), ±3 s/day or better (instru- ment off) accuracy Internal memory data... - Page 134 Quick Start Manual 8 Specifications External Interface Specifications PC Card Interface Slot TYPE II conforming to the PCMCIA/JEIDA PC Card Standard x 1 base Supported cards Flash ATA cards (at least 13 MB) Supported storage 528 MB capacity Data format MS-DOS Recording contents Binary, text and screen image data...
- Page 135 8 Specifications Indicator Total display area 0.15 to 130% of selected range (RMS voltage and current; ef- fective, apparent and reactive power; power factor) Display is suppressed to zero when less than 0.15%. 0.3 to 130% of selected range (DC voltage) Display is suppressed to zero when less than 0.3%.
- Page 136 Quick Start Manual 8 Specifications Transient Overvoltage (impulse) Measurement method For detection, samples at 2 MHz are compared with calculation samples Measurement range 2000 Vpk for channels 1 to 4 Displayed items Peak voltage: Value between the threshold and the maximum value Period: Period threshold is exceeded (max.
- Page 137 8 Specifications Frequency Measurement range 42.500 to 69.000 Hz, 360 Hz to 440 Hz Measurement source One of voltages U1, U2 or U3 (the same as the PLL synchroni- zation source) ±10 mHz with sine wave input of 10 to 110% of voltage range Measurement accuracy at 50 or 60 Hz measurement ±100 mHz with sine wave input of 30 to 110% of voltage range...
- Page 138 Quick Start Manual 8 Specifications Voltage Unbalance Factor Measurement method For three-phase 3-wire (3P3W3M) and three-phase 4-wire sys- tems, calculation is based on the three-phase voltage funda- mental waveform (line-to-line voltage, refer to the calculation formula for details - Instruction Manual (CD-R version)) Current Unbalance Factor Measurement method For three-phase 3-wire (3P3W3M) and three-phase 4-wire sys-...
- Page 139 8 Specifications Harmonic Voltage, Current and Power (including fundamental wave- form content) Measurement method Per IEC61000-4-7:2002 • Harmonic voltage/current: after harmonics are analyzed, inter-harmonic contents are added and displayed adjacent to harmonic content, accord- ing to harmonic order • Harmonic power: the value of harmonic power of each channel and aggregate value of multiple channels are displayed (refer to the calcu- lation formula for details - Instruction Manual (CD-R ver-...
- Page 140 Quick Start Manual 8 Specifications Inter-Harmonic Voltage and Current Measurement method Per IEC61000-4-7:2002 After harmonic analysis, harmonic voltage and current are summed and displayed as inter-harmonic contents with the harmonic contents according to harmonic order Harmonic analysis 10 or 12 cycles for 50 or 60 Hz, respectively window width Harmonic analysis Rectangular...
- Page 141 8 Specifications Time Series Graph Recording Time (When Internal memory only) With Power selected, THD data is saved, but harmonic order data is not. ALL DATA P&Harm Power (Save All) (RMS and Harmonic Save) (Save RMS only) Interval MAX/MIN/AVG MAX/MIN/AVG MAX/MIN/AVG 5 min 45 s 17 min 12 s 8 min 29 s...
- Page 142 Quick Start Manual 8 Specifications...
-
Page 143: Maintenance And Service
9.1 Cleaning and Storage Maintenance and Service 9.1 Cleaning and Storage Cleaning • To clean the product, wipe it gently with a soft cloth moistened with water or mild detergent. Never use solvents such as ben- zene, alcohol, acetone, ether, ketones, thinners or gasoline, as they can deform and discolor the case. -
Page 144: Repair And Servicing
Hioki representative. • Pack the product carefully so that it will not be damaged during shipment, and include a detailed written description of the prob- lem. Hioki cannot be responsible for damage that occurs during shipment. Troubleshooting If problems are encountered with operation, check the appropriate items below. -
Page 145: Battery Pack Charging
9.3 Battery Pack Charging 9.3 Battery Pack Charging When first purchased, the 9459 BATTERY PACK may not be fully charged due to self-discharge. Before using the pack the first time, be sure to charge it completely. When completely charged, recorded data is backed up for about 30 minutes when the instrument is turned off. -
Page 146: Battery Pack Replacement And Disposal
• The battery pack can be expected to be recharged about 500 times, or for about one year before replacement. Replace the pack only with the HIOKI Model 9459 BATTERY PACK. • The battery pack is subject to self-discharge. Be sure to charge the battery before initial use. -
Page 147: Instrument Disposal
9.5 Instrument Disposal 9.5 Instrument Disposal The instrument contains a lithium battery for system backup. To avoid electrocution, turn off the power switch and discon- nect the power cord before removing the lithium battery. • If the protective functions of the instrument are damaged, either remove it from service or mark it clearly so that others do not use it inadvertently. - Page 148 Quick Start Manual 9.5 Instrument Disposal...
-
Page 149: Appendix
Appendix Appendix Troubleshooting Setting problems Changing settings [RECORDING] During while [RECORDING] or [SETTING] operation: [ANALYZING] is dis- played? [ANALYZING] During [SETTING] operation: In either case, data stored in internal memory is erased. Measurement problems The Start key does not [RECORDING] start recording during Return to the setting [ANALYZING] opera-... - Page 150 We recommend that the number of text save options you try to open text selected in the 3196 SYSTEM screen be limited to no data with Excel. more than 250 items.
-
Page 151: Faq
Appendix How can I measure for a period of more than one month? Answer: By using a PC card and setting SYSTEM-DF2 [ ] for RECORDING repeated recording, it is possible to record measurement data for up to 99 weeks. How can the threshold be changed during recording? I need to change the threshold to suit conditions while measuring. -
Page 152: Reference
Quick Start Manual Appendix Reference List of PC cards certified for use Hioki options only (includes adapter) • 9726 PC CARD 128M • 9727 PC CARD 256M • 9728 PC CARD 512M... - Page 153 Index Index Numerics ∆ V10 Flicker 3-Phase quality parameters (three- ......96, 100 phase) ..........14 DATA HOLD .......21, 27 Disposal Battery pack ........140 Instrument ........141 AC Adapter ........32 Connection ........32 Accuracy Clamp on sensor ....38, 39, 40 Event Measurement accuracy ..
- Page 154 Quick Start Manual Index Observation ........ 145 Start ..........66 RMS Voltage ........69 RMS voltage quality parameters ..14 RS-232C Key operations Connection ........122 Troubleshooting ......138 Interface ........121 ..........121 Self-test ..........43 Connection ......... 123 System reset ........51 Manual event ......... 124 Three-phase current ......62 Modem...
- Page 157 HIOKI 3196 POWER QUALITY ANALYZER Quick Start Manual Publication date: October 2005 Revised edition 7 Edited and published by HIOKI E.E. CORPORATION Technical Support Section All inquiries to International Sales and Marketing Department 81 Koizumi, Ueda, Nagano, 386-1192, Japan TEL: +81-268-28-0562 / FAX: +81-268-28-0568 E-mail: os-com@hioki.co.jp...
- Page 158 HEAD OFFICE 81 Koizumi, Ueda, Nagano 386-1192, Japan TEL +81-268-28-0562 / FAX +81-268-28-0568 E-mail: os-com@hioki.co.jp / URL http://www.hioki.co.jp/ HIOKI USA CORPORATION 6 Corporate Drive, Cranbury, NJ 08512, USA TEL +1-609-409-9109 / FAX +1-609-409-9108 3196A981-07 05-10H Printed on recycled paper...
Need help?
Do you have a question about the 3196 and is the answer not in the manual?
Questions and answers