Table of Contents
Advertisement
Quick Links
Advertisement
Table of Contents

Related Manuals for Saluki S3302SB


Summary of Contents for Saluki S3302SB
- Page 1 S3302 Series Handheld Spectrum Analyzer User Manual Saluki Technology Inc.
- Page 2 The document applies to the handheld spectrum analyzers of the following models: S3302SA handheld spectrum analyzer (9kHz-4GHz). S3302SB handheld spectrum analyzer (9kHz-6.5GHz). S3302SC handheld spectrum analyzer (9kHz-9GHz). S3302A handheld spectrum analyzer (9kHz-20GHz). S3302B handheld spectrum analyzer (9kHz-26.5GHz).
- Page 3 Tel: 886.2.2175 2930 Email: sales@salukitec.com www.salukitec.com Model No. Description Note GPS Exposed Antenna(BNC), Built-In GPS S3302-10 GPS option Module and Software Provide USB Power Measurement function S3302-11 USB power meter option (Option 12-15 needed) S87230 USB power continuous wave power sensor S3302-12 Need option 11 (9kHz - 6GHz)
- Page 4 Provide Pscan, Fscan, MScan etc. functions S3302-35 Tracking generator (100kHz - 4GHz) For S3302SA only S3302-36 Tracking generator (100kHz - 6.5GHz) For S3302SB only S3302-37 Tracking generator (100kHz - 9GHz) For S3302SC only Built-In software( need option10, 50 and S3302-38...
- Page 5 Tel: 886.2.2175 2930 Email: sales@salukitec.com www.salukitec.com Model No. Description Note S3302-49 380MHz - 20GHz directional antenna Active log-periodic antenna S3302-50 External electric compass External USB electric compass (need option38) S3302-51 6GHz omnidirectional antenna (680MHz - 6GHz) Portable omnidirectional antenna S3302-52 8GHz omnidirectional antenna (300MHz - 8GHz) Portable omnidirectional antenna S3302-53 VHF/UHF portable antenna...
- Page 6 Saluki. Saluki Tech owns the copyright of this document which should not be modified or tampered by any organization or individual, or reproduced or transmitted for the purpose of making profit without its prior permission, otherwise Saluki will reserve the right to investigate and affix legal liability of infringement.
- Page 7 Tel: 886.909 602 109 Email: sales@salukitec.com www.salukitec.com Contacts Service Tel: 886. 909 602 109 Website: www.salukitec.com Email: sales@salukitec.com Address: No. 367 Fuxing N Road, Taipei 105, Taiwan (R.O.C.)
-
Page 8: Table Of Contents
Tel: 886.909 602 109 Email: sales@salukitec.com www.salukitec.com Content Chapter I Overview Section 1 Product Overview Chapter II Operation Guide Section 1 Unpacking Inspection Section 2 Safety Instructions Section 3 Battery Installation and Replacement Section 4 User Inspection Chapter III Basic Operation Section 1 Description of front panel Section 2 Interface Description Chapter IV Spectrum Analysis Mode... - Page 9 Tel: 886.909 602 109 Email: sales@salukitec.com www.salukitec.com Chapter VIII Channel Scanner Mode (optional) Section 1 Introduction to Typical Measurements Section 2 Structure of Channel Scanner Menu Section 3 Description of Channel Scanner Menu Chapter IX Field Strength Measurement Mode (optional) Section 1 Introduction to Typical Measurements Section 2 Structure of Field Strength Menu Section 3 Description of Field Strength Menu...
-
Page 10: Chapter I Overview
S3302 is a hand-held, small size, light weight, easy to take so it is very suitable for on-site measurement. Saluki S3302 series handheld spectrum analyzer can be applied to the signal and equipment test in aerospace, microwave and satellite communications, wireless communications, radar surveillance, electronic warfare and electronic surveillance, precision-guided and other industries. -
Page 11: Section 1 Product Overview
Tel: 886.909 602 109 Email: sales@salukitec.com www.salukitec.com Section 1 Product Overview 1 Brief Introduction S3302 series spectrum analyzer has the advantages of broad operating band, high performance indicators, high sweeping speed, multiple test functions, easy operation, etc. From the perspective of performance indicators, this instrument has low average noise level, low phase noise and high scanning speed. - Page 12 Tel: 886.909 602 109 Email: sales@salukitec.com www.salukitec.com High sweeping speed: Minimum sweeping time within 1GHz span: <20ms; Resolution bandwidth: 1Hz - 10MHz; Full-band pre-amplifier: Standard configuration; Various measurement modes: Spectrum analysis, interference analysis (spectrogram and RSSI), analog demodulation (AM/FM/PM), channel scanning, high-precision USB power measurement, field strength measurement, etc.
- Page 13 Tel: 886.909 602 109 Email: sales@salukitec.com www.salukitec.com scanning measurement; GPS positioning (optional), realized with the external GPS antenna; Zero-span IF output (optional), used for output of the third or fourth IF signal through the IF output interface under zero span; ...
-
Page 14: Chapter Ii Operation Guide
Please check the articles above against the order contract and packing list. If you have any questions, please contact us in line with the contact information in Preface or contact the business center of the SALUKI, we'll tackle problems as soon as possible. -
Page 15: Section 2 Safety Instructions
Tel: 886.909 602 109 Email: sales@salukitec.com www.salukitec.com Section 2 Safety Instructions The safety performance of S3302 series spectrum analyzer complies with the requirements of GJB3947A-2009. This instrument contains no part to be operated by the user. The instrument shell must not be opened without permission;... - Page 16 Tel: 886.909 602 109 Email: sales@salukitec.com www.salukitec.com The AC-DC adapter must not be connected to the test instrument in order to prevent the instrument from overheating when transported and carried with a knapsack. The voltage input range of the AC-DC adapter is relatively wide, so you must ensure that the power voltage is within the range specified in Table 2-1 during operation.
- Page 17 Tel: 886.909 602 109 Email: sales@salukitec.com www.salukitec.com 4 Electrostatic protection (ESD) Static electricity is highly destructive to electronic components and equipment, so this instrument must be powered up on the anti-static table. Attention should be paid to electrostatic protection when using the device. If condition permits, the following electrostatic protection measures may be taken: a) Make sure all the instruments are correctly grounded to prevent static generation.
-
Page 18: Section 3 Battery Installation And Replacement
Tel: 886.909 602 109 Email: sales@salukitec.com www.salukitec.com There is anti-static coating on display surface, do not use fluoride-bearing detergent or acidic/alkaline detergent. Do not spray detergent on display panel directly, otherwise it may penetrate into and damage the instrument. Section 3 Battery Installation and Replacement 1 Battery description S3302 series spectrum analyzer is equipped with one large-capacity rechargeable lithium ion battery, with the endurance of about 2.5h. -
Page 19: Battery Charging
Tel: 886.909 602 109 Email: sales@salukitec.com www.salukitec.com Fig. 2-1Battery Installation and Replacement Steps 3 Battery status check S3302 series spectrum analyzer is provided with one battery, of which the standby time is 2.5h under full-capacity conditions. The user can view the battery status in the following methods: ... -
Page 20: Section 4 User Inspection
Tel: 886.909 602 109 Email: sales@salukitec.com www.salukitec.com The battery can be charged when S3302 series spectrum analyzer is OFF or operating. Charging steps: a) Install the battery to be charged into the machine. b) Connect the external power supply with the accompanying AC-DC adapter. c) If the battery is charged in the OFF state, the power indicator in the left lower corner of the front panel will be yellow and flicker, indicating that the battery is being charged, and after the battery is fully charged, the indicator will be yellow and normally on. -
Page 21: Chapter Iii Basic Operation
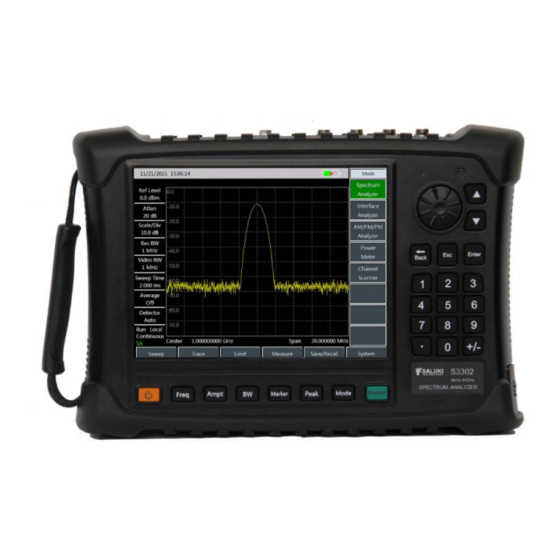
Tel: 886.909 602 109 Email: sales@salukitec.com www.salukitec.com Chapter III Basic Operation Section 1 Description of front panel The front panel of S3302 series spectrum analyzer is shown below. Fig. 3-1 Front Panel The keys on the front panel are shown in the [XXX] form in this manual, where XXX is the key name; Bottom buttons on the touch screen are shown in the [XXX] form, where XXX is the button name;... - Page 22 Tel: 886.909 602 109 Email: sales@salukitec.com www.salukitec.com Fig. 3-2 Display Zone The information display zone in the screen display zone of S3302 series spectrum analyzer shows various settings and instrument statuses of the current measurement. Based on the information location on the screen, the information display zone is divided into the top information display zone, marker, signal standard and title display zone, left information display zone, measurement data display zone, soft key menu display zone, bottom information display zone and bottom function buttons, 7 in total.
- Page 23 Tel: 886.909 602 109 Email: sales@salukitec.com www.salukitec.com If the spectrum analyzer with no battery is powered up with the external power supply, “ ” will be displayed; If the spectrum analyzer is powered up with the fully charged battery and no external power adapter is connected, “...
- Page 24 Tel: 886.909 602 109 Email: sales@salukitec.com www.salukitec.com Label Description Corresponding Functional Key Reference level [Amplitude] →[Reference level] 0.0dBm Attenuation [Amplitude] →[Atten Auto Man] 20dB Scale/Division [Amplitude] →[Scale/Div] 10.0dB Resolution Bandwidth [BW] →[Res BW Auto Man] 3MHz Video Bandwidth [BW] →[Video BW Auto Man] 3MHz Sweep time [Sweep]→[Sweep time Auto Man]...
- Page 25 Tel: 886.909 602 109 Email: sales@salukitec.com www.salukitec.com The bottom function button zone includes 6 function buttons, which have the same functions as hard keys and are applied to display various menu names in different measurement modes so as to facilitate measurement. 2 Number input zone The number input zone includes the direction keys, knob, number keys, Backspace, Cancel and OK.
-
Page 26: Reset Button
Tel: 886.909 602 109 Email: sales@salukitec.com www.salukitec.com [Mode]: Set the measurement mode, including spectrum analysis, interference analysis, analog demodulation, power measurement, channel scanning and field strength measurement. Reset button Press [Reset] to shut down the instrument and power up it again. Reset button Press [Preset] to shut down the instrument and power up it again. -
Page 27: Section 2 Interface Description
Tel: 886.909 602 109 Email: sales@salukitec.com www.salukitec.com Section 2 Interface Description Peripheral interfaces of S3302 series are mainly concentrated on the top panel, as shown in Fig. 3-3, and can be divided into three parts: power interface, test port and digital interface. Fig. - Page 28 Tel: 886.909 602 109 Email: sales@salukitec.com www.salukitec.com 5) Trigger input port: The external triggering mode of S3302 series is available. The scope of trigger source must be -5V to +5V when connecting the external trigger source to the trigger input port of the Spectrum Analyzer.
- Page 29 Tel: 886.909 602 109 Email: sales@salukitec.com www.salukitec.com 2.4 Instrument symbols Instrument symbols (warning labels) in the figure mean that the maximum power of the test port input is +30dBm, and the maximum input DC level is 16VDC. When the device is in operation, the user is not allowed to connect signal exceeding this range to the port.
-
Page 30: Chapter Iv Spectrum Analysis Mode
Tel: 886.909 602 109 Email: sales@salukitec.com www.salukitec.com Chapter IV Spectrum Analysis Mode This chapter mainly introduces relevant information of the spectrum analysis mode of S3302 series spectrum analyzer, including some typical measurement functions and methods, so that the user that operates this instrument for the first time can have a general knowledge on some typical applications and test operations of the spectrum analysis mode after reading this section and get familiar with the operation of this mode. - Page 31 Tel: 886.909 602 109 Email: sales@salukitec.com www.salukitec.com List Scanner The list scanner function supports the user to edit the scanning segment, and the spectrum analyzer will scan the edited list based on the set frequency range and other parameters. ...
-
Page 32: Section 1 Introduction To Typical Measurements
Tel: 886.909 602 109 Email: sales@salukitec.com www.salukitec.com The IQ capture function is applied to capture IQ data and save such data into the instrument based on the capture time, sample rate and capture mode set by the user. Audio monitor The spectrum analyzer has the tune listening function, which can be applied for radio monitoring. - Page 33 Tel: 886.909 602 109 Email: sales@salukitec.com www.salukitec.com If [Reset] on the front panel is pressed, the spectrum analyzer will operate again. Unless specially explained, it starts from pressing [Reset] key in the following examples. 1 Channel power measurement Taking the measurement of the channel power of the FM signal for example, this section describes how to apply the channel power measurement function of S3302 series spectrum analyzer to measure the channel power of the signal.
- Page 34 Tel: 886.909 602 109 Email: sales@salukitec.com www.salukitec.com Fig. 4-1 Schematic Diagram of Connection of Signal Generator and Spectrum Analyzer b) Reset the spectrum analyzer into the default state: Press [Reset]. c) Enable the channel power measurement function: Press [Measure], [Channel Power] and [Channel Power Off On]. Thus the channel power measurement function is enabled.
- Page 35 Tel: 886.909 602 109 Email: sales@salukitec.com www.salukitec.com If the channel power measurement function is enabled, the “Auto” mode of the detector will change into the “Sample” mode. Two vertical white lines on the screen indicates the channel power bandwidth, and measurement results are displayed at the bottom of the screen.
- Page 36 Tel: 886.909 602 109 Email: sales@salukitec.com www.salukitec.com b) Power drop XdB: The occupied bandwidth in this calculation method is defined as follows: spacing between two frequency points corresponding to signal power drop by XdB on both sides of the frequency point where the signal peak power is. The signal power drop XdB can be set by the user.
- Page 37 Tel: 886.909 602 109 Email: sales@salukitec.com www.salukitec.com screen intuitively indicates the frequency range of the occupied bandwidth. After the occupied bandwidth measurement function is enabled, the “Auto” mode of the detector will automatically change into the “Sample” mode. The user can change the measurement method, occupied bandwidth span, etc. with corresponding menus, so as to obtain more accurate measurement results.
- Page 38 Tel: 886.909 602 109 Email: sales@salukitec.com www.salukitec.com If the dBc method is selected, you can press [Measure], [OBW] and [dBc -3.00dB] and use the number keys, UP/DOWN keys or knob to change the dBc value. The dBc range is -0.1dB to -100dB, with the minimum step of 0.01dB.
- Page 39 Tel: 886.909 602 109 Email: sales@salukitec.com www.salukitec.com a) Set the signal generator to output the broadband FM signal: Use the signal generator to generate one FM signal. Set the frequency as 1GHz, power as -10dBm, FM offset as 500kHz and demodulation rate as 10kHz. Connect the output of the signal generator to the RF input end of the spectrum analyzer through one cable, as shown in Fig.
- Page 40 Tel: 886.909 602 109 Email: sales@salukitec.com www.salukitec.com Fig. 4-4 ACPR Measurement k) Limit setting: The limit test function can be applied so as to easily observe whether the adjacent channel power is beyond the set range. Press [Measure], [ACPR] and [More 1/2] to enter the ACPR limit test setting menu. Press [Upper Limit] and enter the upper limit with number keys.
- Page 41 Tel: 886.909 602 109 Email: sales@salukitec.com www.salukitec.com IM distortion. Such distortion products are mostly generated by devices such as amplifiers and mixers in the system. The measurement of third-order IM distortion is described below. This section provides an example of how to display two signals at the same time on the screen of the spectrum analyzer, and introduces how to set the resolution bandwidth, mixer level and reference level, as well as some marker functions.
- Page 42 Tel: 886.909 602 109 Email: sales@salukitec.com www.salukitec.com c) Reduce the resolution bandwidth until you can see the distortion product: Press [BW] and reduce the resolution bandwidth with the step key [↓]. d) Adjust both signal generators until the amplitudes of input signals are the same. Press [Maker], [Delta], [Peak] and [Next Peak].
- Page 43 Tel: 886.909 602 109 Email: sales@salukitec.com www.salukitec.com Fig. 4-7 Signal Peak at Reference Level f) Set the second marker and measure the distortion product: Once the marker is activated, the second marker will be generated by the differential marker function, and the difference between both markers will be displayed.
- Page 44 Tel: 886.909 602 109 Email: sales@salukitec.com www.salukitec.com Fig. 4-8 Relative Measurement of Internal Modulation Distortion g) Calculation of third-order interception (TOI) point: The ratio (in dB) of the distortion component level to signal level has no great significance for system distortion, unless the signal level is specified.
- Page 45 Tel: 886.909 602 109 Email: sales@salukitec.com www.salukitec.com 5 Drift signal measurement 1) Definition of drift signal If the drift signal is measured with the spectrum analyzer, the center frequency should be changed in different period so as to facilitate observation. If the signal tracking function of the spectrum analyzer is enabled, the marker peak will always be displayed at the center frequency of the spectrum analyzer, thus facilitating measurement.
- Page 46 Tel: 886.909 602 109 Email: sales@salukitec.com www.salukitec.com e) Disable the signal tracking function: Press [Frequency] and [Signal Track Off On]. f) Use the maximum holding function to measure the signal drift. Press [Trace] and [Max Hold]. When the signal changes, the max hold will maintain the maximum response to the input signal. g) Activate the trace 2 and set it into the continuous clearing and writing mode.
- Page 47 Tel: 886.909 602 109 Email: sales@salukitec.com www.salukitec.com 6 Noise signal measurement 1) Definition of noise signal In communications systems, signal-to-noise ratio (SNR) is usually used to express noise amplitude. When the nose level in the system increases, SNR decreases and it will be harder to demodulate modulated signals. SNR measurement is also used to indicate measurement of ratio of carrier against noise in communications systems.
- Page 48 Tel: 886.909 602 109 Email: sales@salukitec.com www.salukitec.com S/N=85dBc/Hz - 10×log(30kHz) =40.2dBc/(30kHz) If the differential marker is less than one fourth of the edge distance between the signal peak and response, errors may occur in noise measurement. Fig. 4-10 S/N Measurement 3) Noise measurement by noise marker function In this example, the noise of 1Hz bandwidth is measured by the noise marker function, using the 1GHz external signal.
- Page 49 Tel: 886.909 602 109 Email: sales@salukitec.com www.salukitec.com c) Activate the noise marker: Press [Maker] and [Noise Marker Off On]. Note: The “Sample” mode of the detector will be enabled automatically. To obtain the noise power under different bandwidth, you can correct the current bandwidth based on 10×log(BW). For example, if the noise power within 1 kHz bandwidth is to be obtained, 10×log (1000) or 30 dB has to be added to the reading.
- Page 50 Tel: 886.909 602 109 Email: sales@salukitec.com www.salukitec.com In this case, the amplitude reading of the noise marker is correct, as the averages of all points are at the same frequency, which is not affected by the shape of the resolution bandwidth filter. The noise marker is calculated based on the average of the interested frequency points.
- Page 51 Tel: 886.909 602 109 Email: sales@salukitec.com www.salukitec.com Press [Peak] and [Marker→Center]. d) Set the span as 50MHz and reset the center frequency. Press [frequency], [Span] and 50[MHz]. Press [Marker→] and [Marker→Center]. e) Set the attenuator as 0dB. Press , [Atten Auto Man] and 10[dB]. Press [Peak] and [Peak Track Off On].
- Page 52 Tel: 886.909 602 109 Email: sales@salukitec.com www.salukitec.com Fig. 4-13 Attenuator Setting - 10dB The amplitude reading of the differential marker is provided by two sources: 1. If the RF attenuation is increase, S/N will decrease, and this reading will be positive. 2. If the harmonic distortion of the spectrum analyzer decreases, this reading will be negative.
- Page 53 Tel: 886.909 602 109 Email: sales@salukitec.com www.salukitec.com Fig. 4-14 Input Signal and Harmonic c) Set the video bandwidth to smooth noise so as to improve the resolution. Press [Bandwidth], [Video Bandwidth Auto Man] to enable auto off. Use [↓] key to reduce video bandwidth. d) In order to improve the measurement accuracy, set the peak level of the fundamental wave as the reference level.
- Page 54 Tel: 886.909 602 109 Email: sales@salukitec.com www.salukitec.com Fig. 4-15 Setting of Signal Peak as Reference Level for Maximum Accuracy e) Activate the second marker. Press [Delta], and [Next Peak]. In this case, the fixed marker is on the fundamental wave, while the mobile marker is on the peak point of the second harmonic, as shown in Fig.
- Page 55 Tel: 886.909 602 109 Email: sales@salukitec.com www.salukitec.com f) Measure the harmonic distortion (Method 1). The fundamental wave and the second harmonic as shown in the figure has am amplitude difference of about -60 dB, or a harmonic distortion of 0.1% (see Fig. 4-17). Fig.
- Page 56 Tel: 886.909 602 109 Email: sales@salukitec.com www.salukitec.com b) Set the starting frequency and stop frequency of the spectrum analyzer. Press [Reset] key. Press [frequency], [Start Freq], 800[MHz], [Stop Freq] and 2.5[GHz]. c) Set the video bandwidth to smooth noise so as to improve the resolution. Press [Bandwidth], [Video Bandwidth Auto Man] to enable auto off.
- Page 57 Tel: 886.909 602 109 Email: sales@salukitec.com www.salukitec.com Fig. 4-18 Input Signal under 100kHz Span g) Set the step of the center frequency as the signal frequency of the fundamental wave. Press [Frequency] and [Frequency Step Auto ON/OFF] and enter 1 GHz. h) Measure the second harmonic.
- Page 58 Tel: 886.909 602 109 Email: sales@salukitec.com www.salukitec.com Total signal harmonic distortion percentage is also subject to frequent test. In order to test such parameter, amplitude of each harmonic should be tested with linear unit (such as volt) rather than relative unit dBc. Press [Amplitude], [Units] and [Volt] to set the amplitude unit as volt.
- Page 59 Tel: 886.909 602 109 Email: sales@salukitec.com www.salukitec.com Set the frequency of the signal generator as 1GHz and power as -20dBm. Connect the output of the signal generator to the input port of the spectrum analyzer, as shown in Fig. 4-1. Set the repetition frequency of pulse modulation as 1kHz and pulse width as 900ns.
- Page 60 Tel: 886.909 602 109 Email: sales@salukitec.com www.salukitec.com the following steps of measurement of the sidelobe ratio, pulse width and peak pulse power will not apply. The resolution bandwidth should be more than 1kHz. Fig. 4-21 Trace Display in Solid Line Form c) Read the center frequency of the pulse and amplitude of the main lobe.
- Page 61 Tel: 886.909 602 109 Email: sales@salukitec.com www.salukitec.com Fig. 4-22 Side Lobe Ratio Shown by the Marker e) Measure the pulse width, which is equal to the reciprocal of the frequency difference between the peaks of two side lobe envelopes. Press [Maker], [Delta], [Peak], [Next Pk Right] and [Next Pk Right]. In this case, the reciprocal of the frequency difference indicated by the differential marker is the pulse width, as shown in Fig.
- Page 62 Tel: 886.909 602 109 Email: sales@salukitec.com www.salukitec.com Fig. 4-23 Pulse Width Shown by the Marker 3) Pulse repetition frequency (PRF) measurement The pulse repetition interval (PRI) refers to the time interval between any two adjacent pulse responses. a) Set the output signal of the signal generator: Set the frequency of the signal generator as 1GHz and power as -20dBm.
- Page 63 Tel: 886.909 602 109 Email: sales@salukitec.com www.salukitec.com Readjust the output amplitude of the signal generator until it is shown in the screen. Reduce the sweep time (i.e. increase the sweeping speed) until the contents similar to those in Fig. 4-24 are displayed. c) Measure the pulse repetition interval: Press [Sweep] and [ Sweep$Cont|Single] Press [Peak], [Maker][Delta] and [Peak] [Next Peak].
- Page 64 Tel: 886.909 602 109 Email: sales@salukitec.com www.salukitec.com In the narrow-band measurement mode of the spectrum analyzer: peak pulse power =(main lobe amplitude) -(20 log T Where: Teff -pulse width, in second. Second T——pulse repetition frequency The phenomenon in which the peak pulse power is not equal to the main lobe amplitude is known as pulse desensitization.
- Page 65 Tel: 886.909 602 109 Email: sales@salukitec.com www.salukitec.com c) Press[Measure]→[Generator]→[CW Freq 1GHz], it is allowed to set the frequency of output signal. The signal with output frequency of 1GHz and output power of 0dBm is as shown in Fig. 4-25: Fig. 4-25 Schematic diagram of point frequency source output signal 2) Generator measurement Under the tracking mode, it is allowed to measure the magnitude-frequency characteristics of measured piece by using the synchronous frequency scan of signal source and spectral analysis.
- Page 66 Tel: 886.909 602 109 Email: sales@salukitec.com www.salukitec.com Fig. 4-26 Schematic diagram of tracking mode 3) Generator normalized measurement The normalized measurement is to subtract the effect of cable loss from the measuring process. It can reflect the magnitude-frequency characteristics of measured piece more accurately. For example, to test the magnitude-frequency characteristics of 2.3GHz~2.4GHz band-pass filter, it is allowed to conduct the following procedures: a) Press [Freq]→[Start Freq], to set the start frequency as 2.1GHz;...
- Page 67 Tel: 886.909 602 109 Email: sales@salukitec.com www.salukitec.com 4-27: Fig.4-27 Magnitude-frequency characteristics diagram of 2.3GHz-2.4GHz band-pass filter 10 Coverage map (option) The interference map option can be used for RSSI testing and adjacent channel power ratio testing, and the test results can be marked on the map in real time based on time or distance. The test results marked on the map can be saved to the instrument for later recall.
- Page 68 Tel: 886.909 602 109 Email: sales@salukitec.com www.salukitec.com e) Press [Measure]→[Coverage Map]→[Distance Time]→[Repeat Time], set the time which takes to mark data once on the map. f) Press [Measure]→[Coverage Map]→[Distance Time]→[Repeat Dist], set the distance which takes to mark data once on the map. g) Press [Measure]→[Coverage Map]→[Start Collection], start the RSSI test and mark the results on the map..
- Page 69 Tel: 886.909 602 109 Email: sales@salukitec.com www.salukitec.com f) Press [Measure]→[Coverage Map]→[Measurement Setup]→[ACPR]→[Ch Spacing], set the channel interval. g) Press [Measure]→[Coverage Map]→[Distance Time]→[Repeat Type Time Dist], set the way to map the information according to the time interval or how to move the distance. h) Press [Measure]→[Coverage Map]→[Distance Time]→[Repeat Time], set the time which takes to mark data once on the map.
-
Page 70: Section 2 Structure Of Spectrum Analysis Menu
Tel: 886.909 602 109 Email: sales@salukitec.com www.salukitec.com Section 2 Structure of Spectrum Analysis Menu Fig. 4-30 Overall Block Diagram of Spectrum Analysis Menu... - Page 71 Tel: 886.909 602 109 Email: sales@salukitec.com www.salukitec.com Fig. 4-31 Overall Block Diagram of Spectrum Analysis Menu (continued)
- Page 72 Tel: 886.909 602 109 Email: sales@salukitec.com www.salukitec.com Fig. 4-32 Overall Block Diagram of Spectrum Analysis Menu (continued)
- Page 73 Tel: 886.909 602 109 Email: sales@salukitec.com www.salukitec.com Fig. 4-33 Overall Block Diagram of Spectrum Analysis Menu (continued)
- Page 74 Tel: 886.909 602 109 Email: sales@salukitec.com www.salukitec.com Fig. 4-34 Overall Block Diagram of Spectrum Analysis Menu (continued)
- Page 75 Tel: 886.909 602 109 Email: sales@salukitec.com www.salukitec.com Fig. 4-35 Overall Block Diagram of Spectrum Analysis Menu (continued)
-
Page 76: Section 3 Description Of "Spectrum Analysis" Menu
Tel: 886.909 602 109 Email: sales@salukitec.com www.salukitec.com Section 3 Description of “Spectrum Analysis” Menu 1. Frequency menu · [Center frequency]: Press →[Center Freq] and set it with the number keys on the front panel. Then select [GHz], [MHz], [kHz] or [Hz] in the frequency unit menu, or set the center frequency with the [↑] or [↓] key or knob. - Page 77 Tel: 886.909 602 109 Email: sales@salukitec.com www.salukitec.com 2. Span menu [Span]: Press [Frequency]→ [Span] and set the span of the current mode with number keys on the front panel. Select [GHz], [MHz], [kHz] or [Hz] in the frequency unit menu or set the span with the [↑] or [↓] key or knob.
- Page 78 Tel: 886.909 602 109 Email: sales@salukitec.com www.salukitec.com 3. IF output menu The zero-span IF output function is optional. The third or fourth IF signal output can be achieved through the IF output interface under the zero span to meet the user’s measurement requirements. ·[Special note]: The IF output menu, as a functional option, can only be applied in the zero span mode.
- Page 79 Tel: 886.909 602 109 Email: sales@salukitec.com www.salukitec.com 4. Amplitude menu ·[Reference level]: Press [Amplitude]→ [Ref Level] and set it with number keys on the front panel. Select [dBm], [-dBm], [mV] or [μ V] in the frequency unit menu, or set the reference level with the [↑] or [↓] key or knob.
- Page 80 Tel: 886.909 602 109 Email: sales@salukitec.com www.salukitec.com 5. Bandwidth menu ·[RBW Auto Man]: Press [BW]→[RBW Auto Man] and adjust the resolution bandwidth within the range of 1Hz-10MHz. The resolution bandwidth can be changed with the number keys, step keys or knob in the manual mode, by the step of 1, 3 or 10.
- Page 81 Tel: 886.909 602 109 Email: sales@salukitec.com www.salukitec.com 6. Detector menu ·[Auto]: The default setting of the detector menu is the normal mode. ·[Normal]: If noise is detected in this mode, the positive and negative peak measurement results will be displayed at the same time, so as to achieve the display effects similar to those of the analog instrument.
- Page 82 Tel: 886.909 602 109 Email: sales@salukitec.com www.salukitec.com 7. Marker menu ·[Marker 1 2 3 4 5 6]: Press [Marker]→[Marker 1 2 3 4 5 6] to select various markers. Activate one marker and set it at the trace center. The values will be displayed in the marker display zone in the right upper corner of the screen.
- Page 83 Tel: 886.909 602 109 Email: sales@salukitec.com www.salukitec.com ·[Marker→Center]: Press [Marker]→ [Marker→]→ [Marker→Center]. The marker will move to the center frequency, and the center frequency will be displayed on the screen. ·[Marker→CF Step]: Press [Marker]→ [Marker→]→ [Marker→CF Step] and set the step of the center frequency. The step is equal to the marker frequency.
- Page 84 Tel: 886.909 602 109 Email: sales@salukitec.com www.salukitec.com 8. Peak menu ·[Maximum Peak]: Press [Peak]→[Peak Search] to set one marker at the peak of the trace. The marker frequency and amplitude will be displayed in the right upper corner of the screen. ·[Next Peak]: Press [Peak]→[Next Peak] to move the active marker to next peak associated with the current marker location on the trace.
- Page 85 Tel: 886.909 602 109 Email: sales@salukitec.com www.salukitec.com 9 Mode menu The default functional mode under the mode menu is the spectrum analyzer mode. You can add the following functional options according to the needs: interference analyzer, AM-FM-PM analyzer, power meter, channel scanner and field strength.
- Page 86 Tel: 886.909 602 109 Email: sales@salukitec.com www.salukitec.com 10 Sweep menu The sweep time refers to the time required for the LO tuning of the spectrum analyzer within the selected frequency interval, and directly affects the time of one test. It generally changes with the span, resolution bandwidth and video bandwidth.
- Page 87 Tel: 886.909 602 109 Email: sales@salukitec.com www.salukitec.com · [Save List]: This is optional. Press [Sweep]→[Save List] to save the current list into the spectrum analyzer for future recalling. · [Recall List]: This is optional. Press [Sweep]→[Recall List], and the list dialog box will pop up, in which you can recall or delete the required list.
- Page 88 Tel: 886.909 602 109 Email: sales@salukitec.com www.salukitec.com 12 Trace menu This is applied to display the trace. You can enable [clear], [max], [min], etc. based on various test needs. For example, if the maximum holding function of the trace is enabled in drift signal measurement, the maximum peak amplitude and frequency drift of the input signal will be display.
- Page 89 Tel: 886.909 602 109 Email: sales@salukitec.com www.salukitec.com 13 Limit menu · [Limit Upper Lower]: Press [Limit]→[Limit Upper Lower] to set the current limit as the upper or lower limit. · [Limit Off On]: Press [Limit]→ [Limit Off On] to enable or disable the limit function.
- Page 90 Tel: 886.909 602 109 Email: sales@salukitec.com www.salukitec.com 14 Measurement menu · [Field Strength]: Press [Measure]→[Field Strength] to enable the field strength measurement function and recall the related functional menu. Refer to the [Field Strength] menu description for details. · [Channel Power]: Press [Measure]→[Channel Power] to enable the channel power function and recall the related functional menu.
- Page 91 Tel: 886.909 602 109 Email: sales@salukitec.com www.salukitec.com · [Tune Listen]: Press [Measure]→ [More 1/2]→ [Tune Listen] to enable the tune listening function. Refer to [Tune Listen] menu description for details. ·[IQ Capture]: Press [Measure]→ [More 1/2]→ [IQ Capture] to enable the IQ capture function.
- Page 92 Tel: 886.909 602 109 Email: sales@salukitec.com www.salukitec.com The spectrum analyzer has the function of channel power measurement. You can measure the channel power of the signal by setting relevant parameters in the functional menu and selecting the appropriate resolution bandwidth and span.
- Page 93 Tel: 886.909 602 109 Email: sales@salukitec.com www.salukitec.com · [OBW Off On]: Press [Measure]→ [OBW]→ [OBW Off On] to enable or disable the occupied bandwidth measurement function. · [Method]: Press [Measure]→ [OBW]→ [Method % dBc] to select the appropriate test method, including percentage and drop dBc. In the percentage method, the occupied bandwidth of the signal is obtained by calculating the bandwidth of the frequency of certain percentage to the total power of the transmitted power, and the power percentage can be set...
- Page 94 Tel: 886.909 602 109 Email: sales@salukitec.com www.salukitec.com · [ACPR Off On]: Press [Measure]→ [ACPR]→ [ACPR Off On] to enable or disable the ACPR measurement function. · [Center frequency]: Press [Measure]→ [ACPR]→ [Center Freq] and set the center frequency with number keys. ·...
- Page 95 Tel: 886.909 602 109 Email: sales@salukitec.com www.salukitec.com The spectrum analyzer has the C/N measurement function, which is applied to measure the ratio of the carrier power to noise power. · [C/N Off On]: Press [Measure]→ [C/N]→ [C/N Off On] to enable or disable the C/N function.
- Page 96 Tel: 886.909 602 109 Email: sales@salukitec.com www.salukitec.com · [Emission Mask Off On]: Press [Measure]→ [Emission Mask]→ [Emission Mask Off On] to enable or disable the emission mask function. ·[Channel BW]: Press [Measure]→ [Emission Mask]→ [Channel BW] and set the reference channel bandwidth with number keys. ·...
- Page 97 Tel: 886.909 602 109 Email: sales@salukitec.com www.salukitec.com · [IQ Capture Off On]: Press [Measure]→ [More 1/2]→ [IQ Capture]→ [IQ Capture Off On] to enable or disable the IQ capture function. · [Start Capture]: Press [Measure]→ [More 1/2]→ [IQ Capture]→ [Start Capture] to start IQ capture.
- Page 98 Tel: 886.909 602 109 Email: sales@salukitec.com www.salukitec.com · [Tune Listen Off On]: Press [Measure]→ [More 1/2]→ [Tune Listen]→ [Tune Listen Off On] to enable or disable the tune listening function. · [Demodulation type]: Press [Measure]→ [More 1/2]→ [Tune Listen]→ [Demod Type] to set the demodulation type. The following demodulation types are available: [FM], [AM], [USB] or [LSB].
- Page 99 Tel: 886.909 602 109 Email: sales@salukitec.com www.salukitec.com 15 Signal source menu (option) ·[Signal Source Off On]: press [Measure] → [More 1 of 2]→[Generator] →[Generator Off On], to activate or deactivate the signal source. ·[Tracking Mode Off On]: press[Measure]→[More 1 of 2] →[Signal Source] →[Mode CW Track], to activate or deactivate the signal source tracking mode.
- Page 100 Tel: 886.909 602 109 Email: sales@salukitec.com www.salukitec.com frequency and current spectrometer scan frequency. ·[Special Notice]: The parameter range is -300MHz - 300MHz with default value of 0Hz, which is effective when the tracking mode is activated. The frequency offset must be set to ensure that the generator can reach the maximum frequency at 100kHz.
- Page 101 Tel: 886.909 602 109 Email: sales@salukitec.com www.salukitec.com 16 Coverage map menu (option) ·[Coverage Map Off On]: press [Measure]→[More 1 of 2]→[Coverage Map]→[Coverage Map Off On], to set the coverage map function. ·[Save/ Recall]: press[Measure]→[More 1 of 2]→[Coverage Map]→ [Save/ Recall], to open the save/recall submenu. ·[Measurement Setup]: press [Measure]→[More 1 of 2]→[Coverage Map]→[Measurement Setup], to open the measurement submenu.
- Page 102 Tel: 886.909 602 109 Email: sales@salukitec.com www.salukitec.com ·[Save Data]: press [Measure]→[More 1 of 2]→[Coverage Map]→[Save Recall]→[Save Data], to save the collected data to the instrument. ·[Save CSV]: press[Measure]→[More 1 of 2]→[Coverage Map]→[Save Recall]→[Save CSV], to save the collected data as .csv file. ·[Save BMP]: press[Measure]→[More 1 of 2]→[Coverage Map]→[Save Recall]→[Save BMP], to save the collected data as a picture.
- Page 103 Tel: 886.909 602 109 Email: sales@salukitec.com www.salukitec.com ·[Repeat Type]: press [Measure]→[More 1 of 2]→[Coverage Map]→ [Distance Time]→[Repeat Type], to set the repeat type. ·[Repeat Time]: press [Measure]→[More 1 of 2]→[Coverage Map]→ [Distance Time]→[Repeat Time], to set the interval time between acquisitions.
- Page 104 Tel: 886.909 602 109 Email: sales@salukitec.com www.salukitec.com ·[Main Ch BW]: press [Measure]→[More 1 of 2]→[Coverage Map]→ [Measurement Setup]→[ACPR]→[Main Ch BW], to set the main channel bandwidth. ·[Adj Ch BW]: press [Measure]→[More 1 of 2]→[Coverage Map]→ [Measurement Setup]→[ACPR]→[Adj Ch BW], to set the adjacent channel bandwidth.
- Page 105 Tel: 886.909 602 109 Email: sales@salukitec.com www.salukitec.com 17 File menu · [Save Status]: Press [Save/Recall]→[Save State] to save the current sweeping parameters. · [Recall state]: Press [Save/Recall]→ [Recall State], and the state file list will pop up, including relevant soft menus such as [Head], [Tail], [Page Up], [Page Down], [Done] and [Delete].
-
Page 106: System Menu
Tel: 886.909 602 109 Email: sales@salukitec.com www.salukitec.com 18 System menu The system menu lists the system-related settings of S3302 series spectrum analyzer. In addition to the date/time, date format, system language, network setting and frequency reference, characteristic menus such as the LO nulling alignment, GPS positioning (optional) and power saver are available. - Page 107 Tel: 886.909 602 109 Email: sales@salukitec.com www.salukitec.com [AliLO Nulling]: Press [System]→[AliLO Nulling] to enable the LO nulling alignment function. The user can easily apply this function when required. Alignment results will be saved in the internal memory of the instrument. ·...
- Page 108 Tel: 886.909 602 109 Email: sales@salukitec.com www.salukitec.com · [System language]: Press [System]→ [Language] to set the language, including [simplified Chinese] and [English]. · [Power Saver]: Press [System]→ [Power Saver] to set the auto sleep and auto shutdown mode, including [Sleep Off On], [Sleep], [Shut Down Off On] and [Shut Down], so as to minimize power loss.
-
Page 109: Chapter V Interference Analyzer Measurement Mode (Optional)
Tel: 886.909 602 109 Email: sales@salukitec.com www.salukitec.com Chapter V Interference Analyzer Measurement Mode (optional) Section 1 Introduction to Typical Measurements The interference analyzer mode is an extension of the spectrum analyzer mode. In S3302 series spectrum analyzer, the interference analyzer mode is divided into the following three modes: Spectrum measurement (refer to the relevant chapter of spectrum analysis requirements for specific operations, not repeated here);... - Page 110 Tel: 886.909 602 109 Email: sales@salukitec.com www.salukitec.com If the sweep interval is more than 0, the trace will be in the maximum holding state, so as to ensure that the maximum value of the signal in each sweeping will be displayed on the screen. e) Press [Sweep Time] and set the record time.
- Page 111 Tel: 886.909 602 109 Email: sales@salukitec.com www.salukitec.com Fig. 5-1 Interference Analyzer Spectrogram 2 RSSI measurement RSSI measurement is mainly applied to measure the strength changes of one CW signal within a certain period. In order to better observe the measured signal, the following steps can be taken: a) Press [Auto Save]→[Sweep Interval] to set the sweep interval, which represents the sweep time between two adjacent points in each sweeping.
- Page 112 Tel: 886.909 602 109 Email: sales@salukitec.com www.salukitec.com The RSSI test structure is shown in Fig. 5-2 (the displayed contents vary from parameter settings, and Fig. 5-2 only shows an example). Fig. 5-2 RSSI Test Diagram of Interference Analyzer...
-
Page 113: Section 2 Structure Of Interference Analyzer Menu
Tel: 886.909 602 109 Email: sales@salukitec.com www.salukitec.com Section 2 Structure of Interference Analyzer Menu Fig. 5-3 Overall Block Diagram of Interference Analyzer Menu... - Page 114 Tel: 886.909 602 109 Email: sales@salukitec.com www.salukitec.com Fig. 5-4 Overall Block Diagram of Interference Analyzer Menu (continued)
-
Page 115: Section 3 Description Of Interference Analyzer Menu
Tel: 886.909 602 109 Email: sales@salukitec.com www.salukitec.com Section 3 Description of Interference Analyzer Menu 1 Frequency menu · [Center frequency]: Press [Frequency]→[Center Freq], and set it with number keys on the front panel. Select [GHz], [MHz], [kHz] or [Hz] in the frequency unit menu or set the center frequency with the [↑] or [↓] key or knob. - Page 116 Tel: 886.909 602 109 Email: sales@salukitec.com www.salukitec.com 2 Span menu · [Span]: Press →[Span] to activate the span menu. Set the span with the number keys, and select the frequency unit, or set the span with the [↑] or [↓] key or knob. Refer to [Span] menu description for details. ·...
- Page 117 Tel: 886.909 602 109 Email: sales@salukitec.com www.salukitec.com 3 Amplitude menu · [Reference level]: Press [Ampt]→ [Ref Level] and set it withe number keys on the front panel. Select [dBm], [-dBm], [mV] or [uV] in the frequency unit menu, or set the value with the [↑] or [↓] key or knob. ·...
- Page 118 Tel: 886.909 602 109 Email: sales@salukitec.com www.salukitec.com 4 Bandwidth menu · [Res BW Auto Man]: Press [BW]→[Res BW Auto Man], and set it with the number keys on the front panel or the [↑] or [↓] key or knob. [Special note]: The resolution bandwidth depends on the bandwidth of the IF filter, while the trace shape depends on the filter of IF bandwidth.
- Page 119 Tel: 886.909 602 109 Email: sales@salukitec.com www.salukitec.com · [Auto]: Press [BW]→ [Detector]→ [Auto] to enable the spectrum analyzer mode of the detector. · [Normal]: Press [BW]→ [Detector]→ [Normal] to enable the most commonly used detector mode. You can see the signal and noise floor at the same time, with no signal loss.
- Page 120 Tel: 886.909 602 109 Email: sales@salukitec.com www.salukitec.com 5 Marker menu · [Marker 1 2 3 4 5 6]: Press [Marker]→ [Marker 1 2 3 4 5 6] to change various markers. The selected marker will be underlined. · [Normal]: Press [Marker]→[Normal] to enable the normal mode of the current marker.
- Page 121 Tel: 886.909 602 109 Email: sales@salukitec.com www.salukitec.com · [Marker→Center]: Press [Marker]→ [Marker→]→ [Marker→Center]. The marker will move to the center frequency, and the center frequency will be displayed on the screen. · [Marker→CF Step] Press [Marker]→ [Marker→]→ [Marker→CF Step] and set the step of the center frequency. The step is equal to the marker frequency.
- Page 122 Tel: 886.909 602 109 Email: sales@salukitec.com www.salukitec.com 6 Peak menu · [Max Peak]: Press [Peak]→[Max Peak] to set the current active marker at the maximum peak of the measured trace. The frequency and amplitude of the marker will be displayed in the middle upper part of the screen. ·...
- Page 123 Tel: 886.909 602 109 Email: sales@salukitec.com www.salukitec.com 7 Sweep menu ·[Sweep Time Auto Man]: Press [Sweep]→[Sweep Time Auto Man] to switch the sweep time between the auto and manual modes. The current state is underlined. In the auto mode, the minimum sweep time will be set automatically by the integrated test instrument based on the current state and displayed on the screen.
- Page 124 Tel: 886.909 602 109 Email: sales@salukitec.com www.salukitec.com 8 Auto Save menu · [Sweep Interval]: Press [Auto Save]→[Sweep Interval Auto], and set the sweeping interval. In the default mode, the trace will be in the maximum holding state, so that all signals measured within the sweeping interval can be recorded.
- Page 125 Tel: 886.909 602 109 Email: sales@salukitec.com www.salukitec.com 9 Measurement menu · [Spectrum]: Press [Measure]→ [Spectrum] to enable the spectrum measurement mode. · [Spectrogram]: Press [Measure]→ [Spectrogram] to enable the spectrogram measurement mode. ·[RSSI]: Press [Measure]→ [RSSI] to enable the RSSI measurement mode.
-
Page 126: Chapter Vi Power Meter Mode (Optional)
USB power probe through the USB cable to test the power. Using SAV8723XUSB power probe provided by SALUKI., RF/microwave signals up to 40GHz can be tested, and the true average power with high dynamic range from -60dBm to +20dBm can be measured. The measurement reading will be shown on the display interface of the USB power meter mode of S3302 series. - Page 127 Fig. 6-2 Power Meter Interface It is recommended to purchase the USB-based high-performance microwave power probe, which is developed by SALUKI.. The following models are mainly available, and you can purchase the power probe according to test needs. At first, observe the maximum input power range identified on the USB power probe, and ensure that the input is within the specified range, so as to prevent the probe from damage as a result of over high power.
- Page 128 Tel: 886.909 602 109 Email: sales@salukitec.com www.salukitec.com b) Connect the large end of the USB cable to the USB interface of the spectrum analyzer. The green indicator of the power probe will be ON a moment later. c) The USB power probe can be shut down after the USB cable is removed. In this case, the green LED indicator will be OFF.
-
Page 129: Section 2 Structure Of Power Meter Menu
Tel: 886.909 602 109 Email: sales@salukitec.com www.salukitec.com Section 2 Structure of Power Meter Menu Fig. 6-3 Overall Block Diagram of Power Meter Menu... -
Page 130: Section 3 Description Of Power Meter Menu
Tel: 886.909 602 109 Email: sales@salukitec.com www.salukitec.com Section 3 Description of Power Meter Menu 1 Frequency menu · [Freq]: Press [Freq]→[Frequency] and set the frequency with the number keys. Then select the corresponding frequency menu, or change the frequency with the [↑] or [↓] key or knob, with the step of 10MHz. [Special note]: The frequency setting range is related to the selected USB power probe. - Page 131 Tel: 886.909 602 109 Email: sales@salukitec.com www.salukitec.com 2 Amplitude menu [Auto Scale]: Press [Ampt] →[Auto Scale] and make the measurement signal displayed within 10dB. [Max Value]: Press [Ampt] →[Max Value] to set the maximum value of the current signal. You can change the maximum value with the number keys or [↑] or [↓] key or knob.
- Page 132 Tel: 886.909 602 109 Email: sales@salukitec.com www.salukitec.com 3 Bandwidth menu · [Average Off On]: Press [BW]→[Average Off On]. Change the average with the number keys or [↑] or [↓] key or knob, with the step of 1. · [Special note]: The averaging function is generally applied to smooth the trace in measurement of the low-power signal or signal close to the noise power, so as to reduce the influence of random noise on measurement, and improve the measurement accuracy.
- Page 133 Tel: 886.909 602 109 Email: sales@salukitec.com www.salukitec.com 5 Limit menu [Limit Off On]: Press [Limit]→[Limit Off On] to enable the limit. [Upper Limit]: Press [Limit]→[Upper Limit]. Change the upper limit with the number keys or [↑] or [↓] key or knob, with the step of 1dB. [Lower Limit]: Press [Limit]→[Lower Limit].
-
Page 134: Chapter Vii Am-Fm-Pm Analyzer Mode (Optional)
Tel: 886.909 602 109 Email: sales@salukitec.com www.salukitec.com Chapter VII AM-FM-PM Analyzer Mode (optional) Section 1 Introduction to Typical Measurements The AM-FM-PM analyzer mode is used for displaying the spectrum of AM, FM and PM signals and analyzing relevant parameters. The main spectrum and relevant parameters are shown below: RF spectrum: Similar to the spectrum analyzer mode, the frequency spectrum of the modulation signal will be displayed, and the occupied bandwidth can be measured. - Page 135 Tel: 886.909 602 109 Email: sales@salukitec.com www.salukitec.com 4) Press [Amplitude]→[Ref Level] and set the reference level of the RF spectrum. Press [Scale/Div] and set the appropriate scale/division to facilitate the viewing of RF spectrum. 5) Press [Audio Spectrum]→ [Span] and set the appropriate span. Press [Scale/Div] and set the appropriate scale/division to facilitate the viewing of the frequency spectrum of the audio signal.
- Page 136 Tel: 886.909 602 109 Email: sales@salukitec.com www.salukitec.com Fig. 7-1 FM Demodulation Analysis Results...
-
Page 137: Section 2 Structure Of Am-Fm-Pm Analyzer Menu
Tel: 886.909 602 109 Email: sales@salukitec.com www.salukitec.com Section 2 Structure of AM-FM-PM analyzer Menu Fig. 7-2 AM-FM-PM Analyzer Menu... - Page 138 Tel: 886.909 602 109 Email: sales@salukitec.com www.salukitec.com Fig. 7-3 AM-FM-PM Analyzer Menu (continued)
-
Page 139: Section 3 Description Of Am-Fm-Pm Analyzer Menu
Tel: 886.909 602 109 Email: sales@salukitec.com www.salukitec.com Section 3 Description of AM-FM-PM Analyzer Menu 1 Frequency menu [Center Freq]: Press [Freq]→[Center Freq] and set it with the number keys on the front panel. Then select [GHz], [MHz], [kHz] or [Hz] in the frequency unit menu, or set the center frequency with the [↑] or [↓] key or knob. - Page 140 Tel: 886.909 602 109 Email: sales@salukitec.com www.salukitec.com 2 Span menu [Span]: Press [Freq]→[Span] to activate the span menu. Set the span with the number keys, or change the span by selecting the frequency unit or with the [↑] or [↓] key or knob. ·...
- Page 141 Tel: 886.909 602 109 Email: sales@salukitec.com www.salukitec.com less than -40dBm. 4 Bandwidth menu · [IF bandwidth] Press [BW]→ [IFBW] and set the IFBW with the number keys on the front panel. Select the corresponding frequency unit, i.e. [GHz], [MHz], [kHz] or [Hz], or set the IFBW with the [↑] or [↓] key or knob.
- Page 142 Tel: 886.909 602 109 Email: sales@salukitec.com www.salukitec.com 5 Marker menu · [Marker 1 2 3 4 5 6]: Press [Marker]→ [Marker 1 2 3 4 5 6] to change various markers. The selected marker will be underlined. · [Normal mode]: Press [Marker]→[Normal] to enable the normal mode of the current marker.
- Page 143 Tel: 886.909 602 109 Email: sales@salukitec.com www.salukitec.com 6 Peak menu · [Maximum Peak]: Press [Peak]→[Max Peak] to set the current active marker at the maximum peak of the measured trace. The frequency and amplitude of the marker will be displayed in the middle upper part of the screen.
- Page 144 Tel: 886.909 602 109 Email: sales@salukitec.com www.salukitec.com 7 RF spectrum menu · [Special note]: The occupied bandwidth measurement in the RF spectrum is similar to that in the spectrum analyzer mode. The RF spectrum is only applied in the AM-FM-PM analyzer mode.
- Page 145 Tel: 886.909 602 109 Email: sales@salukitec.com www.salukitec.com Audio spectrum menu · [Span]: Press [Audio Spectrum]→ [Span], and set the span of the audio spectrum. The span should be large enough to display the audio signal and related harmonics. You can change the span with the number keys and select the frequency unit, or with the [↑] or [↓] key or knob.
- Page 146 Tel: 886.909 602 109 Email: sales@salukitec.com www.salukitec.com measurement. 10 Measurement menu · [Demo Type AM FM PM]: Press [Measure]→ [Demod Type AM FM PM] and select the type of the modulation signal. · [RF Spectrum]: Press [Measure]→ [RF Spectrum] to display the RF spectrum only.
-
Page 147: Chapter Viii Channel Scanner Mode (Optional)
Tel: 886.909 602 109 Email: sales@salukitec.com www.salukitec.com Chapter VIII Channel Scanner Mode (optional) Section 1 Introduction to Typical Measurements The channel scanner mode can be applied to measure the signal power of multiple channels. The signal power is displayed in the bar graph or list form. At most, the signal power of 20 channels can be displayed. This can be divided into three modes according to the channel setting: channel scanner, frequency scanner and list scanner. - Page 148 Tel: 886.909 602 109 Email: sales@salukitec.com www.salukitec.com The power cannot be set as the maximum value until the maximum holding function is enabled. Fig. 8-1 Schematic Diagram of Channel Scanner Frequency Scanner Below is an example of the Frequency Scanner mode, mainly involving the following procedures. 1) Press [Sweep]→...
- Page 149 Tel: 886.909 602 109 Email: sales@salukitec.com www.salukitec.com 6) Press [Measure]→ [Power Display Curr Max], and enable the “Current” option. Set the current power of each channel. 7) Press [Measure]→ [Color Code Single Dual] and enable the dual color mode. 8) Press [Measure]→ [Orientation Vert Hori] and enable the horizontal mode. Fig.
- Page 150 Tel: 886.909 602 109 Email: sales@salukitec.com www.salukitec.com 4) Press [Sweep]→[Power Display Curr Max], and enable the “Current” option. Set the current power of each channel. Fig. 8-3 Schematic Diagram of List Scanner...
-
Page 151: Section 2 Structure Of Channel Scanner Menu
Tel: 886.909 602 109 Email: sales@salukitec.com www.salukitec.com Section 2 Structure of Channel Scanner Menu Fig. 8-1 Channel Scanner Menu... -
Page 152: Section 3 Description Of Channel Scanner Menu
Tel: 886.909 602 109 Email: sales@salukitec.com www.salukitec.com Section 3 Description of Channel Scanner Menu 1 Sweep menu · [Channel Scanner]: Press [Sweep]→ [Channel Scanner], set the channel scanner mode and activate [Channel Scanner] menu. You can the channel parameters in [Channel Scanner] menu. Refer to [Channel Scanner] menu. - Page 153 Tel: 886.909 602 109 Email: sales@salukitec.com www.salukitec.com 3 Frequency Scanner menu · [Start frequency]: Press [Sweep]→ [Freq Scanner]→ [Start Freq], and set the center frequency of the starting channel. · [Step Freq]: Press [Sweep]→ [Freq Scanner]→ [Step Freq], and set the frequency step between channels.
- Page 154 Tel: 886.909 602 109 Email: sales@salukitec.com www.salukitec.com · [Signal std]: Press [Edit List] → [Signal Std], and the signal standard list will pop up, including [Head], [Tail], [Page Up] and [Page Down]. Select the required signal standard and click [Done]. ·...
- Page 155 Tel: 886.909 602 109 Email: sales@salukitec.com www.salukitec.com 6 File menu Refer to the description of the file menu in the spectrum analyzer mode.
-
Page 156: Chapter Ix Field Strength Measurement Mode (Optional)
Tel: 886.909 602 109 Email: sales@salukitec.com www.salukitec.com Chapter IX Field Strength Measurement Mode (optional) Section 1 Introduction to Typical Measurements The field strength measurement is indispensable in radiation strength measurement of the tested equipment and can be divided into three modes: PScan, FScan and MScan. PScan: Observe the offset, amplitude and field strength of the current point by setting the point frequency. - Page 157 Tel: 886.909 602 109 Email: sales@salukitec.com www.salukitec.com Fig. 9-1 Schematic Diagram of PScan Mode FScan Main operation steps of FScan: 1) Press [Measure]→ [FScan] to enable the frequency sweeping mode. 2) Press [Freq]→ [Start Freq] and set the starting frequency of sweeping. 3) Press [Freq]→...
- Page 158 Tel: 886.909 602 109 Email: sales@salukitec.com www.salukitec.com 10) Press [Peak] to directly set the marker at the maximum point. The dwell time refers to the time of dwelling at the frequency point exceeding the set limit in the ON state. The schematic diagram of FScan mode is shown in the figure below (example).
- Page 159 Tel: 886.909 602 109 Email: sales@salukitec.com www.salukitec.com 5) Press [Swp/Ant]→ [Recall Antenna], and select the antenna factor file. 6) Press [Swp/Ant]→ [Dwell Time +∞ Man], and set the dwell time. 7) Press [Swp/Ant]→ [Dwell Time Off On] to enable or disable the dwell time. 8) Press [Marker]→...
-
Page 160: Section 2 Structure Of Field Strength Menu
Tel: 886.909 602 109 Email: sales@salukitec.com www.salukitec.com Section 2 Structure of Field Strength Menu Fig. 9-4 Overall Block Diagram of Field Strength Menu... - Page 161 Tel: 886.909 602 109 Email: sales@salukitec.com www.salukitec.com Fig. 9-5 Overall Block Diagram of Field Strength Menu (continued)
-
Page 162: Section 3 Description Of Field Strength Menu
Tel: 886.909 602 109 Email: sales@salukitec.com www.salukitec.com Section 3 Description of Field Strength Menu 1 Frequency menu ([PScan] mode) · [Freq]: Press [Freq]→ [Freq] and set the frequency with the number keys on the front panel. Select [GHz], [MHz], [kHz] or [Hz] in the frequency unit menu, or change the point frequency with the [↑] or [↓] key or knob. - Page 163 Tel: 886.909 602 109 Email: sales@salukitec.com www.salukitec.com 2 Frequency menu ([FScan] mode) · [Stt Freq 500MHz]: Press [Freq]→[Stt Freq 500MHz] and set the starting frequency with the number keys on the front panel. Select [GHz], [MHz], [kHz] or [Hz] in the frequency unit menu, or set the starting frequency with the [↑] or [↓] key or knob.
- Page 164 Tel: 886.909 602 109 Email: sales@salukitec.com www.salukitec.com 3 Amplitude menu · [Ref Level 107dBuV] : Press [Ampt]→ [Ref Level 107dBuV] and set the reference value with the number keys on the front panel. Select [dBuV], [-dBuV], [mV] or [uV] in the frequency unit menu, or set the reference value with the [↑] or [↓] key or knob.
- Page 165 Tel: 886.909 602 109 Email: sales@salukitec.com www.salukitec.com 4 Bandwidth menu · [BW 30kHz]: Press [BW]→ [BW 30kHz] and set the bandwidth with the number keys on the front panel. Select [GHz], [MHz], [kHz] or [Hz] in the frequency unit menu, or set the reference value with the [↑] or [↓] key or knob.
- Page 166 Tel: 886.909 602 109 Email: sales@salukitec.com www.salukitec.com 7 Sweep/Antenna menu · [Sweep Cont Single]: Press [Swp/Ant]→[Sweep Cont Single] to enable the continuous or single sweeping mode. · [Sweep Once]: Press [Swp/Ant]→ [Sweep Once] to sweep once again. · [Dwell Time +∞ Man]: Press [Swp/Ant]→[Dwell Time +∞ Man] to set the dwell time.
- Page 167 Tel: 886.909 602 109 Email: sales@salukitec.com www.salukitec.com 8 Demodulation menu · [CW]: Press [Demod]→ [CW] to disable the demodulation mode. · [FM]: Press [Demod]→ [FM] to enable the FM mode. · [AM]: Press [Demod]→ [AM] to enable the AM mode. ·...
- Page 168 Tel: 886.909 602 109 Email: sales@salukitec.com www.salukitec.com 10 Measurement menu · [PScan]: Press [Measure]→[PScan] to enable the MScan mode of field strength. · [FScan]: Press [Measure]→[FScan] to enable the FScan mode of field strength. · [MScan]: Press [Measure]→[MScan] to enable the MScan mode of field strength.
-
Page 169: Chapter X Signal Analyzer Mode (Optional)
Tel: 886.909 602 109 Email: sales@salukitec.com www.salukitec.com Chapter X Signal Analyzer Mode (optional) Section 1 Introduction to Typical Measurements The signal analysis measurement mode is to provide the rapid analysis of interference signal, realize the display and playback of historical data by waterfall chart, quickly realize the modification of center frequency and span parameters by shortcut menu and quickly realize the audio output and IQ Capture function. - Page 170 Tel: 886.909 602 109 Email: sales@salukitec.com www.salukitec.com The signal analysis includes signal list menu to view the frequency, amplitude, capture time and other parameters of captured interference signal, as shown in Fig. 10-2. Fig.10-2 Interface of signal list IQ Capture function can directly save IQ data of interference signal and its interface is as shown in Fig. 10-3: Fig.10-3 Schematic diagram of IQ capture function...
- Page 171 Tel: 886.909 602 109 Email: sales@salukitec.com www.salukitec.com Under the signal analysis mode, the current test task can be saved quickly as an automatically generated file as per current intermediate frequency and test time. The storage task of signal analysis is as shown in Fig. 10-4: Fig.10-4 Schematic diagram of signal analysis storage task...
-
Page 172: Section 2 Structure Of Signal Analysis Menu
Tel: 886.909 602 109 Email: sales@salukitec.com www.salukitec.com Section 2 Structure of Signal Analysis Menu Fig.10-5 Block diagram of signal analysis menu... - Page 173 Tel: 886.909 602 109 Email: sales@salukitec.com www.salukitec.com Fig.10-6 Block diagram of signal analysis menu (continued)
-
Page 174: Section 3 Description Of Signal Analysis Menu
Tel: 886.909 602 109 Email: sales@salukitec.com www.salukitec.com Section 3 Description of Signal Analysis Menu 1 Frequency menu ·[Center Freq]: press [Freq]→[Center Freq], to select [GHz], [MHz], [kHz] or [Hz] by number key on front panel or [↑] or [↓] key and spinning wheel in frequency menu. - Page 175 Tel: 886.909 602 109 Email: sales@salukitec.com www.salukitec.com 2 Span menu ·[Span]: press [Freq]→[Span], to activate the span sub-menu by using number key, frequency unit or [↑] or [↓] key and spinning wheel. For details, please refer to the description of [Span]. ·[Special Notice]: use [↑] or [↓] key and spinning wheel to change span as per the step size of 1-2-5.
- Page 176 Tel: 886.909 602 109 Email: sales@salukitec.com www.salukitec.com 3 Amplitude menu ·[Ref Level]: press [Ampt]→[Ref Level], to set the ref level by using the number key on front panel, [dBm], [-dBm], [mV] or [uV] or [↑] or [↓] key and spinning wheel. ·[Special Notice]: in case of using [↑] or [↓] key and spinning wheel, the step is 10dB.
- Page 177 Tel: 886.909 602 109 Email: sales@salukitec.com www.salukitec.com 4 Bandwidth menu ·[Res BW Auto Man]: press [BW]→[Res BW Auto Man], to set the RBW by using the number key on front panel or [↑] or [↓] key and spinning wheel. ·[Special Notice]: the RBW depends on the bandwidth of intermediate frequency filter while the shape of trace depends on the intermediate frequency bandwidth filter.
- Page 178 Tel: 886.909 602 109 Email: sales@salukitec.com www.salukitec.com 5 Marker menu ·[Marker 1 2 3 4 5 6]: press [Marker]→[Marker 1 2 3 4 5 6], to activate the different marker display. The selected marker will be underlined. ·[Normal]: press [Marker]→[Normal], to set the current marker display mode as normal.
- Page 179 Tel: 886.909 602 109 Email: sales@salukitec.com www.salukitec.com ·[Marker->Center Freq]: press [Marker]→[Marker->]→[Marker->Center Freq], to move the marker to the center frequency place and display the reading of center frequency on screen. ·[Marker->Step Freq]: press [Marker]→[Marker->]→[Marker->Step Freq], to set the step size of center frequency, namely, the frequency step is equal to marker frequency.
- Page 180 Tel: 886.909 602 109 Email: sales@salukitec.com www.salukitec.com 6 Peak menu ·[Peak Search]: press [Peak]→[Peak Search], to set the current marker at the maximum peak point of measuring trace and indicate the frequency and amplitude of the marker. ·[Next Peak]: press [Peak]→[Next Peak], to move the marker to next peak point on trace which is linked with current marker.
- Page 181 Tel: 886.909 602 109 Email: sales@salukitec.com www.salukitec.com 7 Sweep menu ·[Sweep Time Auto Man]: press [Sweep]→[Sweep Time Auto Man], to switch the sweep time between automatic and manual modes. The current state will be underlined. When the sweep time is automatic, the integrated tester will automatically set the fastest sweep time as per the current apparatus state and the fastest sweep time will be displayed on screen.
-
Page 182: Configuration Menu
Tel: 886.909 602 109 Email: sales@salukitec.com www.salukitec.com 8 Record menu ·[Swp Interval]: press [Record]→[Swp Interval Auto], to set the scan interval. After the sweep time is set, the trace will switch to the maximum hold mode by default to ensure that all measured signals within scan interval can be recorded. - Page 183 Tel: 886.909 602 109 Email: sales@salukitec.com www.salukitec.com 10 Tune listen menu ·[Tune&Listen Off On]: press [Config]→[Tune&Listen]→[Tune&Listen OffOn], to activate or deactivate the Tune Listen function. ·[Demod type]: press [Config]→[Tune&Listen]→[Demod type], to set the demodulation type. It is allowed to select [FM], [AM], [USB] or [LSB]. ·[Listen Time]: press[Config]→[Tune&Listen]→[Listen Time], to set the listen time.
- Page 184 Tel: 886.909 602 109 Email: sales@salukitec.com www.salukitec.com 11 IQ capture menu ·[IQ Capture Off On]: press [Config]→[IQ Capture]→[IQ Capture Off On], to activate or deactivate IQ Capture function. ·[Start Capture]: press [Config]→[IQ Capture]→[Start Capture], to start IQ data capture and record function. ·[Capture Time]: press [Config]→[IQ Capture]→[Capture Time], to set IQ Capture Time.
- Page 185 Tel: 886.909 602 109 Email: sales@salukitec.com www.salukitec.com 12 ShortCut menu ·[Center Freq]: press [ShortCut]→[Center Freq], press [Freq]→[Center Freq], to set the center frequency by using the number key on front panel, [GHz], [MHz], [kHz] or [Hz] or[↑]or[↓]key and spinning wheel in frequency unit menu.
-
Page 186: Chapter Xi Location Analyzer Mode (Optional)
Tel: 886.909 602 109 Email: sales@salukitec.com www.salukitec.com Chapter XI Location Analyzer Mode (optional) Section 1 Introduction to Typical Measurements The location analyzer mode is mainly used for the positioning function of the interference source or the unknown signal source, and the orientation of the interference signal can be quickly realized by using the external receiving antenna and the electronic compass. - Page 187 Tel: 886.909 602 109 Email: sales@salukitec.com www.salukitec.com Fig. 11-1 Schematic diagram of point scan 2 Horizon Scan The horizon scan is to display the measured value information after one rotation of the current measuring point on a horizontal disc. The main procedures of the horizon scan measurement are as follows: 1) Press [Measure]→[Horizon Scan], select horizol scan measurement mode.
- Page 188 Tel: 886.909 602 109 Email: sales@salukitec.com www.salukitec.com Fig. 11-2 Schematic diagram of horizon scan 3 Map Location The map location is to display the test information on the current measurement location on the map, and the map location can directly display the location information of the interference source. The main procedures of the map measurement are as follows: 6) Press [Measure]→[Map Location], select map location measurement mode.
- Page 189 Tel: 886.909 602 109 Email: sales@salukitec.com www.salukitec.com Fig. 11-3 Schematic diagram of map location...
-
Page 190: Section 2 Structure Of Location Analyzer Menu
Tel: 886.909 602 109 Email: sales@salukitec.com www.salukitec.com Section 2 Structure of Location Analyzer Menu Fig.11-4 Block diagram of location analyzer menu... -
Page 191: Section 3 Description Of Location Analyzer Menu
Tel: 886.909 602 109 Email: sales@salukitec.com www.salukitec.com Section 3 Description of Location Analyzer Menu 1 Frequency menu ·[Center Freq]: press [Freq]→[Center Freq], to select [GHz], [MHz], [kHz] or [Hz] by number key on front panel or [↑] or [↓] key and spinning wheel in frequency menu. - Page 192 Tel: 886.909 602 109 Email: sales@salukitec.com www.salukitec.com 2 Amplitude menu · [Ref Level 107dBuV] : Press [Ampt]→ [Ref Level 107dBuV] and set the reference value with the number keys on the front panel. Select [dBuV], [-dBuV], [mV] or [uV] in the frequency unit menu, or set the reference value with the [↑] or [↓] key or knob.
- Page 193 Tel: 886.909 602 109 Email: sales@salukitec.com www.salukitec.com 3 Bandwidth menu · [BW 30kHz]: Press [BW]→ [BW 30kHz] and set the bandwidth with the number keys on the front panel. Select [GHz], [MHz], [kHz] or [Hz] in the frequency unit menu, or set the reference value with the [↑] or [↓] key or knob.
- Page 194 Tel: 886.909 602 109 Email: sales@salukitec.com www.salukitec.com 5 Demodulation menu · [CW]: Press [Demod]→ [CW] to disable the demodulation mode. · [FM]: Press [Demod]→ [FM] to enable the FM mode. · [AM]: Press [Demod]→ [AM] to enable the AM mode. ·...
- Page 195 Tel: 886.909 602 109 Email: sales@salukitec.com www.salukitec.com 7 Map menu · [Triangulation Off On]: Press [Map]→[Triangulation Off On], the real-time positioning mode indicates that the current measurement is refreshed in real time with the GPS and the compass, and the recall positioning method is called to display the positioning data measured at different positioning points onto the current map.
-
Page 196: Chapter Xii Operating Principle
Tel: 886.909 602 109 Email: sales@salukitec.com www.salukitec.com Chapter XII Operating Principle S3302 series spectrum analyzers have four operating bands: 9kHz - 20GHz, 9kHz - 26.5GHz, 9kHz - 32GHz and 9kHz - 44GHz, and various measurement functions such as spectrum measurement analysis, field strength measurement, occupied bandwidth measurement, channel power measurement, adjacent channel power measurement, tune listening and IQ capture. - Page 197 Tel: 886.909 602 109 Email: sales@salukitec.com www.salukitec.com is automatically associated according to the reference level or manually set by the user to provide the appropriate mixer level. The switch filtering and frequency conversion part is used for band filtering and frequency conversion of RF input signals and output of IF signals to the IF channel board.
-
Page 198: Chapter Xiii Troubleshooting And Repair
Tel: 886.909 602 109 Email: sales@salukitec.com www.salukitec.com Chapter XIII Troubleshooting and Repair This chapter will introduce how to find out problems and receive the after-sales service. Interpretation of internal errors of the spectrum analyzer is also included. If you have any problem in operation of S3302 series spectrum analyzer or want to purchase related components, options or accessories, we will provide complete after-sales services. -
Page 199: Section 2 Repair Method
Tel: 886.909 602 109 Email: sales@salukitec.com www.salukitec.com Section 2 Repair Method If you cannot solve the problem of S3302 series, contact us by telephone or fax. If it is confirmed that repair is required, please pack the instrument by the following steps: 1) Prepare one copy of paper file describing the instrument failure, and place it into the packing box together with the tester.
Need help?
Do you have a question about the S3302SB and is the answer not in the manual?
Questions and answers