Table of Contents
Advertisement
Quick Links
Advertisement
Table of Contents

Subscribe to Our Youtube Channel
Related Manuals for Saluki S3602 Series


Summary of Contents for Saluki S3602 Series
- Page 1 S3602 Series Vector Network Analyzer User Manual Saluki Technology Inc.
- Page 2 Manual rests with Saluki. Saluki Tech owns the copyright of this User Manual which should not be modified or tampered by any organization or individual, or reproduced or transmitted for the purpose of making profit without its prior permission, otherwise Saluki will reserve the right to investigate and affix legal liability of infringement.
- Page 3 Tel: 886.2.2175 2930 Email: sales@salukitec.com www.salukitec.com Contacts Service Tel: 886.2.2175 2930 Website: www.salukitec.com Email: info@salukitec.com Address: No. 367 Fuxing N Road, Taipei 105,Taiwan (R.O.C.)
-
Page 4: Table Of Contents
Tel: 886.2.2175 2930 Email: sales@salukitec.com www.salukitec.com Content 1. Manual Guide....................................6 1.1. About the Manual................................6 1.2. Related Documents................................7 2. Overview..................................... 9 2.1. Product Overview................................9 2.2. Safety Guide................................... 12 3. Introduction to Use..................................18 3.1. Preparation before Use..............................18 3.2. Front Panel & Rear Panel..............................30 3.3. - Page 5 Tel: 886.2.2175 2930 Email: sales@salukitec.com www.salukitec.com 6.10. Improvement of Efficiency of Multi-state Measurement....................187 6.11. Rapid Data Transmission..............................188 6.12. Use of Macro................................189 7. Calibration....................................192 7.1. Calibration Overview..............................192 7.2. Selection of Calibration Type............................193 7.3. Calibration Guide................................195 7.4. High-accuracy Measurement Calibration..........................198 7.5.
-
Page 6: Manual Guide
The manual describes the purposes, performance indicators, basic operating theory, operating method, operation precautions, etc. of S3602 vector network analyzers produced by Saluki Technology, to help you rapidly get familiar with and understand key points of the instrument operation and use. Please read this User Manual carefully and follow its guidance. -
Page 7: Related Documents
Technical indicators and test methods This section describes the main technical indicators of S3602 analyzers and the recommended test instructions for the user. 1.2.Related Documents The documents related to S3602 series vector network analyzer include: User Manual Program control document ... - Page 8 Tel: 886.2.2175 2930 Email: sales@salukitec.com www.salukitec.com Program control document This manual introduces the remote programming basis, SCPI basis, SCPI commands, programming examples, I/O drive function library, etc. It aims to guide the user to rapidly and comprehensively know the program control commands and methods of the instrument. It mainly includes the following chapters: Remote control ...
-
Page 9: Overview
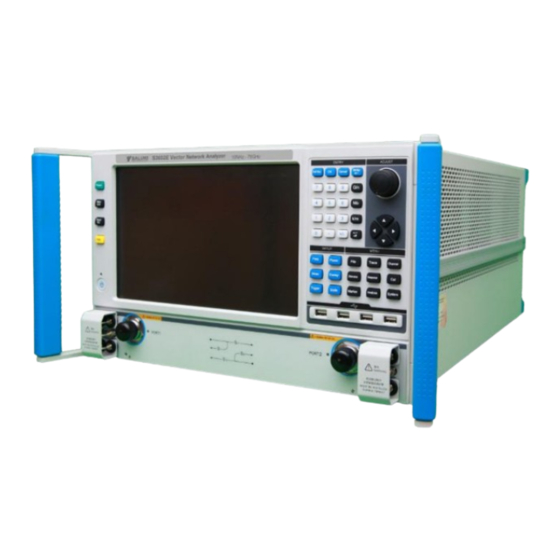
2.1.Product Overview S3602 series vector network analyzer is a new generation of vector network analyzer, launched by Saluki Technology. In the hardware, new design concept and technical architecture are adopted, thus significantly improving key technical performance indicators such as the overall scanning speed and dynamic range. - Page 10 Fig. 2.1 12.1-inch 1280*800 Touch Screen Fig. 2.2 Soft Panel Interface Fig. 2.3 Soft Shortcut Keys 2.Multi-window multi-channel measurement display S3602 series vector network analyzers support up to 64 channels, and as many as 16 measurement windows can be displayed at the...
- Page 11 Fig. 2.4 Multi-window Multi-channel Measurement Display 3.Wide dynamic range S3602 series vector network analyzers are designed based on fundamental wave mixed reception, thus effectively expanding the dynamic range of the overall test and meeting increasing test demands for the wide dynamic range.
-
Page 12: Safety Guide
Printing function S3602 series vector network analyzers have a powerful printing function, and are able to output or print the contents of the measurement display into a specified file through a printer. A local or network printer with a LAN or USB interface can be used. Measurement results can be printed after the printer is added to the Windows 7 operating system. - Page 13 Tel: 886.2.2175 2930 Email: sales@salukitec.com www.salukitec.com However, it is your responsibility to operate the product in a correct way. Please read and follow the safety instructions carefully before operating the instrument. The instrument is applicable to the industrial and laboratory environment or field measurement. Pay attention to the limitations for proper operation to avoid personal injury or property damage.
- Page 14 Pay attention to the following items before operation: Unless otherwise stated, S3602 series vector network analyzers should be placed steadily and operated indoor with protection of IP 2X. The maximum altitude must not exceed 2,000m in operation and 4,500m in transportation. The actual power supply voltage may be the indicated voltage ±...
- Page 15 Tel: 886.2.2175 2930 Email: sales@salukitec.com www.salukitec.com 2.2.3. Power Safety Precautions for the power supply of the instrument: Ensure that the actual power supply voltage is the same as that marked on the instrument before powering-on. If the power supply voltage is changed, replace the fuse of the instrument. Refer to the power supply requirements on the rear panel of the instrument.
-
Page 16: Operation Precautions
Tel: 886.2.2175 2930 Email: sales@salukitec.com www.salukitec.com 2.2.4. Operation Precautions The instrument operator must have certain professional and technological knowledge, good psychological quality and emergency response capability. Refer to relevant requirements in "2.2.7 Transportation" before handling or transporting the instrument. Allergic substances (such as nickel) are produced inevitably during instrument production. If the operator shows any allergic symptom (such as rash, frequent sneezing, red eye, breathing difficulty, etc.), immediately seek medical help to eliminate the symptoms. - Page 17 Tel: 886.2.2175 2930 Email: sales@salukitec.com www.salukitec.com The battery and power supply module must not be exposed to flame and other heat sources. They must be prevented from direct sunlight and should be kept clean and dry in storage. Clean the connection port of the battery or power supply module with clean and dry soft cloth.
-
Page 18: Introduction To Use
This chapter introduces the operation precautions, front and rear panel browsing, commonly used basic measurement methods, data file management, etc. of S3602 series vector network analyzers, so that the user has a preliminary understanding of the instrument and measurement process. - Page 19 Tel: 886.2.2175 2930 Email: sales@salukitec.com www.salukitec.com Pay attention to the following requirements before operation: The improper operation location or Measurement setups may result in damage to the instrument or the connected instrument. Pay attention to the following requirements before powering on the instrument: The fan blades and ventilation holes are not blocked, and the instrument is at least 10cm away from the wall.
- Page 20 Tel: 886.2.2175 2930 Email: sales@salukitec.com www.salukitec.com Table 3.1 List of Accompanying Articles of S3602 Description Qty. Function Main Machine S3602 Series VNA Standard Accessories Power cord USB Keyboard/mouse User Manual Packing list Warranty Options 2-ports, single source, with extended power range...
- Page 21 1.85mm test cable Environmental Requirements 3.1.1.2. The operation place of S3602 series vector network analyzers should conform to the following environmental requirements. Operating environment The operating environment should conform to the following requirements. Table 3.2 Operating Environment Requirements of S3602 Operation Temperature 0°C-40°C...
- Page 22 Confirm the power supply parameters. S3602 series vector network analyzers are equipped with a three-core power line interface and conform to the international safety standards. Confirm that the protective ground wire of the power supply socket is grounded reliably before inserting the power line into the standard three-core socket to power on the instrument.
- Page 23 Confirm and connect the power line. S3602 series vector network analyzers are equipped with the three-core power line interface and conform to national safety standards. Confirm that the protective ground wire of the power line of the network analyzer is reliably grounded before powering on the network analyzer.
- Page 24 Preheating for cold start of the instrument In order to meet the performance indicators of S3602 series vector network analyzer in cold start, preheat it more than 30 minutes before measurement.
- Page 25 Tel: 886.2.2175 2930 Email: sales@salukitec.com www.salukitec.com Cutoff of power supply In order to prevent personal injury under abnormal conditions, the power supply of the network analyzer requires emergency cutoff. In this case, pull off the power cord (from the AC power socket or the power socket of the rear panel of the instrument). Therefore, sufficient operating space should be reserved for direct cutoff of the power supply if necessary.
- Page 26 Tel: 886.2.2175 2930 Email: sales@salukitec.com www.salukitec.com Check and clean the connector before measurement connection. Ensure that the connector is clean and intact. Wea the anti-static wristband in connection. The correct connection method and steps are as follows. Step 1: as shown in Fig. 3.4, align the axes of two connectors to be interconnected, and ensure that the pin of the male connector can concentrically slide into the jack of the female connector.
- Page 27 Tel: 886.2.2175 2930 Email: sales@salukitec.com www.salukitec.com Ensure that the angle between the torque wrench and the other wrench (used to support the connector or cable) is less than 90° before applying force. Carefully grip the handle end of the torque wrench, and apply force in the direction vertical to the handle to reach the break point of ...
- Page 28 Tel: 886.2.2175 2930 Email: sales@salukitec.com www.salukitec.com Fig. 3.8 Calibration Plane 3.1.2. System Recovery and Installation Program of Analyzer Abnormal shutdown of software, infection of viruses or use of other kinds of software in the analyzer may result in anomaly of the operating system of the analyzer.
-
Page 29: Routine Maintenance
If the screen shown in Fig. 3.10 appears, system recovery is started. About 10min is required in the whole process of system recovery. Restart the analyzer after recovery. 3.1.3. Routine Maintenance This section describes the routine maintenance of S3602 series vector network analyzers. Cleaning of instrument surface Clean the instrument surface according to the following steps: Step 1: turn off the instrument by disconnecting the power line connected to the instrument. -
Page 30: Front Panel & Rear Panel
Rear panel 3.2.1. Front Panel This section introduces the structure and functions of the front panel of S3602 series vector network analyzer. The front panel is shown in the following figure. Fig. 3.11:Front Panel of S3602 1.Input Key zone The keys are used to enter measurement Setups, as shown in Fig 3.12. - Page 31 Tel: 886.2.2175 2930 Email: sales@salukitec.com www.salukitec.com [OK] key Confirm the Setups and input values in the dialog box and close the dialog box, equivalent to the "OK” button in the dialog box. [Cancel] key Ignore the Setups and input in the dialog box and close the dialog box, equivalent to the "Cancel” button in the dialog box. [Soft Keyboard] key Call the soft keyboard of the Windows 7 system.
- Page 32 Tel: 886.2.2175 2930 Email: sales@salukitec.com www.salukitec.com [↑] and [↓] key Move up and down in the menu to select the menu item. When interact with dialog box, the arrow keys can be used to change value, select item in the drop-down list, and select the desired option in a group of option list. 3.Setup key zone Setup key zone include 6 Setup keys shown in Fig.
- Page 33 Tel: 886.2.2175 2930 Email: sales@salukitec.com www.salukitec.com Fig.3.15: Menu Key Zone of S3602 [File] key Open the main file menu. Following options will be displayed on screen: “Save”, “Call”, “Print”, “Minimize application program” and “Exit”. [Trace] key Open the main Trace menu. Following options will be displayed on screen: “New Trace”, “Delete Trace”, “Select Trace”, “Move Trace”, “Trace title”...
- Page 34 Tel: 886.2.2175 2930 Email: sales@salukitec.com www.salukitec.com 5.Function Key Zone Function key zone include 4 function keys on the left side of the screen as shown in Fig. 3.16. Fig. 3.16: Function Key Zone of S3602 [Help] key Open the main help menu. Following options will be displayed on screen: “User manual”, “Programming manual”, “Technical support”, “Error information”...
-
Page 35: Rear Panel
RF source and receiver. so as to measure the tested device in bi-directions. The yellow light indicates the source output port. Fig. 3.19: Test Ports of Analyzer 3.2.2. Rear Panel This section introduces the structure and functions of the rear panel of S3602 series vector network analyzer. The rear panel is shown in the following figure. - Page 36 Tel: 886.2.2175 2930 Email: sales@salukitec.com www.salukitec.com Fig. 3.20: Rear Panel of Network Analyzer 1.10MHz reference connector 10MHZ reference output As shown in Fig. 3.21, the BNC (female) connector can be used for connection between the analyzer and external reference signal. The 10MHZ external reference signal detected by the port will be used as the reference frequency of the instrument, instead of the internal reference frequency.
- Page 37 Tel: 886.2.2175 2930 Email: sales@salukitec.com www.salukitec.com 2.General-interface bus connector As shown in Fig.3.22 this is a 24-pin D-type female connector, meeting the IEEE-488 standards. It is used to transmit and receive GPIB/SCPI commands. Fig. 3.22: General-interface Bus Connector 3.LAN connector As shown in Fig.
- Page 38 Tel: 886.2.2175 2930 Email: sales@salukitec.com www.salukitec.com Fig. 3.25: VGA Connector 6.LO and RF output connector As shown in Fig. 3.26, the 3.5mm female interface is used for LO output and RF output. The LO interface is used for internal LO signal output, and RF interface for RF source signal output.
- Page 39 Tel: 886.2.2175 2930 Email: sales@salukitec.com www.salukitec.com 9.Automatic test interface connector As shown in Fig. 3.29, this interface is a 36-pin female connector. The network analyzer and material handler can exchange signals through this interface to provide a stable and reliable automatic test environment for the user. Fig.
- Page 40 Tel: 886.2.2175 2930 Email: sales@salukitec.com www.salukitec.com after) one measurement. Fig.3.32: Trigger Input/Output Interface Connector 13.28V (BNC) interface connector As shown in Fig. 3.33, this BNC (female) connector can be used to drive a noise source. Fig.3.33: 28V (DC) Interface Connector...
-
Page 41: Graphic User Interface
Tel: 886.2.2175 2930 Email: sales@salukitec.com www.salukitec.com 3.3.Graphic User Interface As shown in Fig. 3.34, the mouse can be used to realize the following operations. Click the menu bar to display the drop-down menu. Click the input toolbar to adjust the entered number. ... -
Page 42: Trace, Channel And Window Of Analyzer
Tel: 886.2.2175 2930 Email: sales@salukitec.com www.salukitec.com 3.4.Trace, Channel and Window of Analyzer Trace Channel Window 3.4.1. Trace The trace is a series of measurement data points. Trace settings will affect the mathematical operation and display of measurement data. - Page 43 Tel: 886.2.2175 2930 Email: sales@salukitec.com www.salukitec.com Fig. 3.35 Creation of New Window 2.Use the full screen window. If several windows are opened at the same time, the trace will be unclear as a result of too small window size. In this case, one window can be displayed in the full screen so as to better observe the trace in the window.
-
Page 44: Data Analysis
Tel: 886.2.2175 2930 Email: sales@salukitec.com www.salukitec.com 3.5.Data Analysis Marker Trace operation and statistics Limit test Ripple test Bandwidth test Equation Editor 3.5.1. Marker Use the marker to read the measurement data, search the values of specific type or change the excitation settings. Nine normal marker and one reference marker can be used at most for each trace. - Page 45 Tel: 886.2.2175 2930 Email: sales@salukitec.com www.salukitec.com Marker menu Menu path: [Marker] > [Marker]. The marker sub-menu will be displayed. Click the marker to be opened in the sub-menu. Fig. 3.37 Creation of marker by marker Menu Marker dialog box Menu path: [Marker] > [Marker] > [Marker...]. The marker dialog box will be displayed. Select the marker to be opened in the [Marker] box.
- Page 46 Tel: 886.2.2175 2930 Email: sales@salukitec.com www.salukitec.com Click it to close all the opened marker. Move marker 3.5.1.2. Activate the marker to be moved in one of the above three methods. Move the marker in one of the following methods. Click the [Stimulate] box in the marker dialog box and move the marker in the following method. Directly enter the marker stimulate value.
- Page 47 Tel: 886.2.2175 2930 Email: sales@salukitec.com www.salukitec.com Select the marker to be defined for search. b.Search domain zone Define the range of marker search. The default search domain is the full bandwidth. In addition, the instrument supports the search of nine user settings. The user setting to be selected must be defined in the user domain range. The ranges of search domains set by users are allowed to be overlapping.
- Page 48 Tel: 886.2.2175 2930 Email: sales@salukitec.com www.salukitec.com Fig. 3.40 Schematic Diagram of Peak in marker Domain Left peak: search next effective peak value on the left side of the marker. The peak must be defined at first. Next peak: search next peak lower than the current marker amplitude. The peak must be defined at first. ...
- Page 49 Tel: 886.2.2175 2930 Email: sales@salukitec.com www.salukitec.com Fig. 3.41 Bandwidth Search Filter test: the analyzer has a special shortcut function to test the filter, and all test parameters will be automatically displayed on the screen so that the user can directly observe measurement results. As manual setting in the test is eliminated, the speed of filter test is greatly increased.
- Page 50 Tel: 886.2.2175 2930 Email: sales@salukitec.com www.salukitec.com Fig. 3.43 Measurement setups by marker Function Dialog Box Soft key toolbar of marker function The soft key toolbar of the marker function can be used to set the starting value, ending value, center value, reference value and delay.
- Page 51 Tel: 886.2.2175 2930 Email: sales@salukitec.com www.salukitec.com [Marker] box Select the marker to be set. [Open] check box If this check box is selected, the corresponding marker will be displayed on the screen. If this check box is cleared, the marker display will be shut down.
- Page 52 Tel: 886.2.2175 2930 Email: sales@salukitec.com www.salukitec.com Fig. 3.44 marker List Setting by marker Menu Menu path 2: [Response] > [Display] > [List] > [Marker list]. If "√" is marked, the marker list will be opened; otherwise, the marker list will be closed. Fig.
- Page 53 Tel: 886.2.2175 2930 Email: sales@salukitec.com www.salukitec.com One trace must be stored in the memory before setting the method of trace operation or performing any kind of trace operation. trace operation is a kind of vector operation based on plural data before display formatting. It is set in the following method. Menu path: [Analysis] >...
- Page 54 Tel: 886.2.2175 2930 Email: sales@salukitec.com www.salukitec.com Only display the memory trace. [Data and memory] option box Display the data trace and memory trace at the same time. Trace Statistics 3.5.2.2. The analyzer has three functions of trace statistics: mean, offset and peak-peak value. The statistical values can be calculated within the whole stimulus bandwidth or user-defined bandwidth.
- Page 55 Tel: 886.2.2175 2930 Email: sales@salukitec.com www.salukitec.com 3.5.3. Limit Test The limit test function is used to compare the measured data and defined constraints (limits). The limits defined by the user are intuitively displayed on the screen in the limit line form. The limit lines have the following advantages: Provide intuitive indicators for the device commissioning personnel.
- Page 56 Tel: 886.2.2175 2930 Email: sales@salukitec.com www.salukitec.com The Type box is used to set the limit test type: MAX: the limit test fails if the trace is above the limit segment. MIN: the limit test fails if the trace is below the limit segment. ...
- Page 57 Tel: 886.2.2175 2930 Email: sales@salukitec.com www.salukitec.com [Point] option box If this box is selected, the discrete limit value corresponding to the measurement data point will be indicated with the symbol "v" (measurement type: MAX) and "^" (measurement type: MIN). [Line] option box If this box is selected, all the discrete limit setting points will be connected through a line.
- Page 58 Tel: 886.2.2175 2930 Email: sales@salukitec.com www.salukitec.com Fig. 3.50 Ripple Test Dialog Box Ripple limit table Fig. 3.51 Ripple Limit Table “Type” column The "Type" column is used to set the limit test type: ON: enable the test of the limit segment. OFF: disable the test of the limit segment.
- Page 59 Tel: 886.2.2175 2930 Email: sales@salukitec.com www.salukitec.com trace will be disabled. [Ripple line on/OFF] check box If this check box is selected, the ripple line of the active trace will be displayed on the screen. If this check box is cleared, the ripple line display of the active trace will be turned off, however, the ripple test function will not be affected.
- Page 60 Tel: 886.2.2175 2930 Email: sales@salukitec.com www.salukitec.com 3.5.5. Bandwidth Test The bandwidth test function is mainly used to test the bandwidth of the band pass filter. The signal peak within the pass band can be found in the bandwidth test. Two points are respectively located at the specific amplitude on both side of the pass band.
- Page 61 Tel: 886.2.2175 2930 Email: sales@salukitec.com www.salukitec.com The red T-type bandwidth marks will appear on both sides of the bandwidth. Fig. 3.54 Display of Bandwidth Test Results Shutdown of Bandwidth Test 3.5.5.3. Click [Analysis] > [Test] > [BD test]. The test dialog box will appear. Click the [Bandwidth test on/OFF] check box and remove the tick to shut down the bandwidth test.
- Page 62 Tel: 886.2.2175 2930 Email: sales@salukitec.com www.salukitec.com expects to obtain a logarithmic formula trace, the following expression can be used: S21+S23- S13. However, the data used in the Equation Editor are plural data with no format requirements. The user needs to enter the following formula: S21*S23/S13. After the formula is entered, Eq=S12*S23/S13 will be displayed on the current active trace of the vector network analyzer.
- Page 63 Tel: 886.2.2175 2930 Email: sales@salukitec.com www.salukitec.com “Activation” check box The "activation" check box is ticked in the default mode. The formula entered by the user will be judged only when this check box is ticked. If the formula is applicable to calculation, operation will be started. The expression Eq=XXX of the current formula will be displayed on the active trace of the current active window of the vector network analyzer.
- Page 64 Tel: 886.2.2175 2930 Email: sales@salukitec.com www.salukitec.com mu1(complex a,complex b, Return value mu1 = (1-|a|^2)/(|d-conj(a)*(a*d-b*c)|+|b*c|). The parameter a, b, c and d are plurals. complex c,complex d) mu2(complex a,complex b, Return value mu2 = (1-|d|^2)/(|a-conj(d)*(a*d-b*c)|+|b*c|). The parameter a, b, c and d are plurals. complex c,complex d) phase(complex a) Return to atan2 (a), i.e.
-
Page 65: Data Output
"*.snp" format. 3.6.Data output Saving and calling of file Printing of measurement data 3.6.1. Saving and Calling of File S3602 series vector network analyzer supports the saving and calling of files in various formats. Saving of File 3.6.1.1. - Page 66 Tel: 886.2.2175 2930 Email: sales@salukitec.com www.salukitec.com Saving method Menu path: [File] > [Save] > [Save]/[Save as...]. Fig. 3.58 Saving of File File menu item: [Save] Click [Save] to save the instrument status and calibration data int the default file (defaut.cst) of the specified directory. If the default file exists, the dialog box to confirm whether to cover will appear.
- Page 67 Tel: 886.2.2175 2930 Email: sales@salukitec.com www.salukitec.com Only save the current active trace data. bmp file Save the screen display information in the bitmap form. Calling of File 3.6.1.2. Call status and calibration data: sta file The status data of the instrument are saved in the sta file, including the settings, trace data, limit line and marker. cal file Calibration data are saved in the cal file, excluding status data.
- Page 68 Tel: 886.2.2175 2930 Email: sales@salukitec.com www.salukitec.com dat file The "dat" file is used for saving measurement data of the active trace or all tracks in the formatted or unformatted form. Define the data saving mode in the [Data save setting] dialog box. The "at"...
- Page 69 Tel: 886.2.2175 2930 Email: sales@salukitec.com www.salukitec.com Save the trace data in the real/imaginary part format. snp (s1p and s2p) file The “snp" file is a kind of data output file. It can be called by the CAE (computer aided engineering) software (such as ADS of Agilent), but cannot be called by the analyzer.
- Page 70 Tel: 886.2.2175 2930 Email: sales@salukitec.com www.salukitec.com Fig. 3.60 Print Setting [Page Setup] dialog box [Window info] zone [Print] check box If this check box is selected, the window trace information will be printed. If this check box is cleared, the window trace information will not be printed.
- Page 71 Tel: 886.2.2175 2930 Email: sales@salukitec.com www.salukitec.com After the printer is added and the print contents are set, measurement information can be output through the printer, as shown below: Menu path: [File] > [Print] > [Print...]. The print setting dialog box will appear. Fig.
-
Page 72: Measurement Setups
4. Measurement setups This chapter mainly describes the operation of S3602 series network analyzers in measurement, creation of the measurement of the known status by analyzer resetting, selection of Measurement setups, adjustment of the analyzer display so as to better... - Page 73 Trigger source: internal Trigger type: continuous scanning Display format: Format: logarithmic amplitude The details of various formats are shown in Table 4.1. Table 4.1 Default Format Setting of S3602 Series Vector Network Analyzers Format Scale Reference position Reference value Logarithmic amplitude ≤10 dB...
- Page 74 Tel: 886.2.2175 2930 Email: sales@salukitec.com www.salukitec.com Phase shift: 0° Trace display: data Calibration setting: Correction: closed Interpolation: open Calibration type: none Calibration kit number: current calibration kit number System impedance: 50Ω Port extension: closed Port extension value: 0s 10) Marker setting: Initial frequency: full range of center frequency Reference marker R: closed Discrete marker: closed...
- Page 75 Tel: 886.2.2175 2930 Email: sales@salukitec.com www.salukitec.com Gate state: closed Gate starting value: -5ns Gate ending value: 5ns Gate shape: standard Gate type: bandpass 14) Full display setting: Trace state: open Frequency/stimulus: open marker reading: open Status bar: closed 4.1.2. User Reset State The analyzer can be reset into the known default status or user-defined status.
-
Page 76: Selection Of Measurement Parameter
The [Reset] shortcut key is set in the functional key zone and shortcut menu bar. 4.2.Selection of Measurement Parameter The following parameters can be set in an S3602 series vector network analyzer to measure the electrical characteristics of devices. S parameter (fixed ratio) ... - Page 77 Tel: 886.2.2175 2930 Email: sales@salukitec.com www.salukitec.com technology of measurement connection, and is also associated with the connection of the non- measurement port (non-excited port). Application of parameter S The following parameters can be measured with S. Reflection measurement: SXX (X=1, 2, 3, 4) Return loss Standing wave ratio (SWR) reflection coefficient...
- Page 78 Tel: 886.2.2175 2930 Email: sales@salukitec.com www.salukitec.com Fig. 4.4 Definition of Parameter S [New trace] dialog box [S-Parameter] zone Select the S parameter measurement trace to be created. [Receiver] button Open the dialog box to create any ratio or non-ratio power measurement trace. [Balance parameter] button Open the dialog box to create the balance parameter measurement trace.
- Page 79 Tel: 886.2.2175 2930 Email: sales@salukitec.com www.salukitec.com Fig. 4.5 Definition of Parameter S 4.2.3. Non-ratio Power Measurement The absolute power of the receiver A, B, C, D, R1, R2, R3 and R4 can be measured in the non-ratio power measurement mode, however, the phase, group delay and other items under the “average"...
-
Page 80: Setting Of Frequency Range
Tel: 886.2.2175 2930 Email: sales@salukitec.com www.salukitec.com [Automatically create window] check box If this check box is ticked and the number of tracks in the window exceeds 8, excessive tracks will be automatically created in a new window. If this check box is cleared and the number of tracks in the window exceeds 8, excessive tracks will not be created. 4.2.4. -
Page 81: Setting Of Signal Power Level
The frequency can be rapidly set with the [Frequency] shortcut key in the functional key zone of the front panel. 4.4.Setting of Signal Power Level The power level refers to the power level of the output signal of the test port. The power level indicators of the port of S3602 series vector network analyzer are as follows. - Page 82 Tel: 886.2.2175 2930 Email: sales@salukitec.com www.salukitec.com Fig. 4.10 Setting of Power Level Cutoff of port power Menu path: [Stimulus] > [Power] > [Power...]. Or, switch the power by changing the setting of the [Power ON/off] check box in the [Power] dialog box. Manual setting of attenuation Menu path: [Stimulus] >...
-
Page 83: Setting Of Sweep
Tel: 886.2.2175 2930 Email: sales@salukitec.com www.salukitec.com [Power ON/off] check box If this check box is ticked, the port will normally output the power. If this check box is cleared, the port output power will be cut off. [Port Powers Coupled] check box If the [Port Powers Coupled] check box is ticked in the default mode, the power level settings of two ports of the analyzer will be identical. - Page 84 Tel: 886.2.2175 2930 Email: sales@salukitec.com www.salukitec.com Setting of sweep type Sweep time Sweep setting 4.5.1. Overview of Sweep Types The network analyzer supports six sweep types shown below. Linear frequency This is the default sweep type of the instrument. The whole frequency range is covered continuously by the frequency linearity. Logarithm frequency In the logarithmic frequency mode, the source frequency increases in logarithmic steps, and the frequency ratio of every two adjacent frequency points is identical.
- Page 85 Tel: 886.2.2175 2930 Email: sales@salukitec.com www.salukitec.com Setting of segment sweep type Menu path: [Stimulus] > [Sweep] > [Sweep type]. Auxiliary menu bar: click [Segment sweep] or select [Segment sweep] in the [Setting type] dialog box. Fig. 4.12 Setting of Segment sweep Type Dialog box setting instructions: [Independent power levels] check box: tick it to set the independent power level of each segment.
- Page 86 Tel: 886.2.2175 2930 Email: sales@salukitec.com www.salukitec.com Double-click the [Ending stimulus] box of the segment and enter the ending frequency of the segment. Double-click the [Number of sweep points] box of the segment and enter the number of sweep points of the segment. Double-click the [Power level] box of the segment and enter the power level of the segment (the independent power level option is opened).
-
Page 87: Trigger Mode
Tel: 886.2.2175 2930 Email: sales@salukitec.com www.salukitec.com Menu path: [Stimulus] > [Sweep] > [Sweep setup...]. The [Sweep setup] dialog box will appear. Fig. 4.16 sweep Setup [Sweep setup] dialog box [Channel] box Select the channel applicable to sweep setting. [Stepped sweep] check box In the stepped sweep mode, the source is tuned to a frequency point and the frequency point is measured after the specified dwell time. - Page 88 Tel: 886.2.2175 2930 Email: sales@salukitec.com www.salukitec.com Fig. 4.17 Simple Trigger Setting 4.6.2. Detailed Trigger Setting Menu path: [Stimulus] > [Trigger] > [Trigger...]. The trigger dialog box will appear. Fig. 4.18 Trigger Sub-menu Fig. 4.19 Trigger Setting Dialog Box 4.6.3. [Trigger] Dialog Box...
- Page 89 Tel: 886.2.2175 2930 Email: sales@salukitec.com www.salukitec.com Trigger setting options Trigger source zone The source of the channel trigger signal is determined by trigger source setting of the trigger source zone. The effective trigger signal is generated when sweep is not done by the vector network analyzer. Three trigger sources can be selected: internal, manual and external.
- Page 90 Tel: 886.2.2175 2930 Email: sales@salukitec.com www.salukitec.com [Hold] The channel will not receive the trigger signal, and sweep will be stopped. [Spot] ([Trigger mode] check box) The spot sweep mode can be selected only when the trigger source is manual or external and the trigger range is the channel. In the spot sweep mode, next data point will be measured in sweep after the channel receives the trigger signal.
- Page 91 Tel: 886.2.2175 2930 Email: sales@salukitec.com www.salukitec.com Fig. 4.20 Measurement Trigger Dialog Box Auxiliary 1/2 trigger option Auxiliary trigger output zone [Enabled] Tick the check box to open the external trigger output of the corresponding channel; otherwise, the external trigger output will be closed.
- Page 92 Tel: 886.2.2175 2930 Email: sales@salukitec.com www.salukitec.com Fig. 4.21 Auxiliary 1/2 Trigger Dialog Box Pulse trigger options Synchronous pulse input zone Select the internal or external source to synchronize the internal pulse generator of the analyzer. [Pulse trigger option] Internal: the pulse generator is synchronized according to the periodic signal generated in the analyzer, and the output pulse train period is determined according to the pulse repetition period in the pulse measurement interface.
-
Page 93: Setting Of Data Format And Scale
Tel: 886.2.2175 2930 Email: sales@salukitec.com www.salukitec.com Fig. 4.22 Pulse Trigger Dialog Box 4.7.Setting of Data Format and Scale The data format refers to the display of measurement data in the graphical form. Select the data format which is the most favorable to understand the characteristics of the tested device. - Page 94 Tel: 886.2.2175 2930 Email: sales@salukitec.com www.salukitec.com Fig. 4.23 Rectangular Coordinate Format Logarithmic amplitude format Display the amplitude information (no phase information). Y-axis unit: dB Applicable typical measurement: return loss, insertion loss and gain. Phase format Display the phase information (no amplitude information). ...
- Page 95 Tel: 886.2.2175 2930 Email: sales@salukitec.com www.salukitec.com It is similar to the linear amplitude format, but both the positive value and negative value can be displayed. Y-axis: no unit. Applicable typical measurement: time domain and auxiliary input voltage for maintenance purposes. ...
- Page 96 Tel: 886.2.2175 2930 Email: sales@salukitec.com www.salukitec.com Fig. 4.25 Smith Chart Format The horizontal axis of the center of Smith chart represents the pure resistance, and the center of the horizontal axis represents the system impedance. The leftmost resistance on the horizontal axis is zero, indicating a short circuit. The rightmost resistance of the horizontal axis is infinite, indicating an open circuit.
-
Page 97: Observation Of Multiple Tracks And Opening Of Multiple Channels
Tel: 886.2.2175 2930 Email: sales@salukitec.com www.salukitec.com Scale setting Menu path: [Response] > [Scale]. The scale sub-menu will pop up. Set the appropriate scale, reference location and reference level by clicking the corresponding input zone or keys. Fig. 4.27 Setting of Scale Scale setting dialog box Scale zone [Scale] box... - Page 98 Tel: 886.2.2175 2930 Email: sales@salukitec.com www.salukitec.com Fig. 4.28 Preconfigured Window Arrangement Setting A Four tracks will be created in Window 1: S11, S21, S12 and S22, in the logarithmic format in Channel 1. Setting B Four tracks will be created in four windows, in the logarithmic format in Channel 1. S11 will be displayed in Window 1, S21 in Window 2, S12 in Window 3 and S22 in Window 4.
- Page 99 Tel: 886.2.2175 2930 Email: sales@salukitec.com www.salukitec.com Fig. 4.29 Pre-configured Measurement setups Window arrangement Several methods of window adjustment are provided in the analyzer. Use the mouse to move and adjust the window. Arrange the windows of the analyzer by the [Tile], [Cascade], [Maximize] and [Minimize] items of the ...
-
Page 100: Setting Of Analyzer Display
Tel: 886.2.2175 2930 Email: sales@salukitec.com www.salukitec.com Fig. 4.30 Setting of Window Arrangement 4.9.Setting of Analyzer Display You can use the display menu of the analyzer to display or hide the display elements and customize the screen. These display elements are usable for measurement observation, setting and modification, including the status bar, toolbar, list, measurement display, data trace, memory trace and title bar. - Page 101 Tel: 886.2.2175 2930 Email: sales@salukitec.com www.salukitec.com to close the status bar display. Or, press the status bar opening/closing item of the auxiliary menu bar to open or close the status bar. Fig. 4.31 Display of Trigger Status Bar 4.9.2. Tool bar Six different toolbars can be displayed at the same time.
- Page 102 Tel: 886.2.2175 2930 Email: sales@salukitec.com www.salukitec.com Holding mode Single sweep Continuous sweep stimulus toolbar The stimulus toolbar is used to observe, set and modify the sweep stimulus, including: Starting stimulus value (CW frequency in the CW mode) ...
- Page 103 Tel: 886.2.2175 2930 Email: sales@salukitec.com www.salukitec.com Marker table Fig. 4.33 Marker Table The marker table is used to display the marker parameters,including: Marker number Reference marker (for relative measurement) Stimulus value Response value Limit table Fig. 4.34 Limit Table The limit table is used to display, set and modify the limit test parameters, including: Type (minimum, maximum or closed) ...
- Page 104 Tel: 886.2.2175 2930 Email: sales@salukitec.com www.salukitec.com Fig. 4.36 Triggering of Table Display 4.9.4. Display Contents Six kinds of measurement information can be displayed or hided so that the user can observe the current measurement state, including: Title trace state ...
- Page 105 Tel: 886.2.2175 2930 Email: sales@salukitec.com www.salukitec.com The trace state button can be used to set the corresponding trace as the current active trace so as to set the trace. Point to the button and right-click the mouse. Delete the trace or set the trace scale, color and line through the right-click menu. Frequency/stimulus state The frequency/stimulus information will be displayed under each window on the screen.
-
Page 106: Menu
5. Menu The menu is used to operate and set the vector network analyzer. S3602 series vector network analyzers are configured with a complex menu system and setting dialog boxes under the menus at all levels. Be familiar with the menu system of the network analyzer to facilitate operation. - Page 107 Tel: 886.2.2175 2930 Email: sales@salukitec.com www.salukitec.com Fig. 5.1 File Menu Note: Press the menu with an ellipsis (...) to open the corresponding dialog box, the same below. 5.1.2. Trace Fig. 5.2 trace Menu 5.1.3. Channel...
- Page 108 Tel: 886.2.2175 2930 Email: sales@salukitec.com www.salukitec.com Fig. 5.3 Channel Menu 5.1.4. Stimulus Fig. 5.4 stimulus Menu 5.1.5. Response...
- Page 109 Tel: 886.2.2175 2930 Email: sales@salukitec.com www.salukitec.com...
- Page 110 Tel: 886.2.2175 2930 Email: sales@salukitec.com www.salukitec.com Fig. 5.5 Response Menu 5.1.6. Calibration Fig. 5.6 Calibration Menu 5.1.7. Marker...
- Page 111 Tel: 886.2.2175 2930 Email: sales@salukitec.com www.salukitec.com Fig. 5.7 Marker Menu 5.1.8. Analysis Fig. 5.8 Analysis Menu 5.1.9. System...
- Page 112 Fig. 5.9 System menu Fig. 5.10 Help Menu Main menu S3602 series vector network analyzers are configured with 10 main menus. File: used to save, call and print test data, minimize the window and exit the program. trace: used for relevant operations of tracks.
-
Page 113: Description Of Menu
Tel: 886.2.2175 2930 Email: sales@salukitec.com www.salukitec.com the menu of higher level should be opened before opening the menu of lower level. For convenience, the commonly used secondary menus are displayed in parallel to the menus of higher level. Menu opening Menus at various levels can be opened in the following three methods. - Page 114 Tel: 886.2.2175 2930 Email: sales@salukitec.com www.salukitec.com Table 5.2 Save Save Save As... Define Data Saves… Save Function description: Save user settings and calibration information in the data (*.CST) file. The current user settings and calibration information will be saved in the latest user data file. If this item is clicked, the [Whether to cover previous data] dialog box will pop up.
- Page 115 Tel: 886.2.2175 2930 Email: sales@salukitec.com www.salukitec.com Recall Function description: Call the saved state file or calibration file. If this item is clicked, a state file or calibration file will be called. File types includes the state and calibration file (*.CST), state file (*.STA), calibration file (*CAL) and data file (*.DAT, *.CTI and *.S1P).
- Page 116 Tel: 886.2.2175 2930 Email: sales@salukitec.com www.salukitec.com None 5.2.2. Trace Press the [trace] key on the front panel or click the [trace] menu item on the user interface. The trace-related menu will pop up. Specific items include: [New trace], [Delete trace>>], [Select trace], [Move trace], [trace title] and [trace maximization ON/OFF]. The specific description of menu items is as follows.
- Page 117 Tel: 886.2.2175 2930 Email: sales@salukitec.com www.salukitec.com Click this menu to delete the current active trace (click once to delete one active trace, until all active tracks are deleted). Parameter description: None Move trace 5.2.2.3. Function description: Click this menu, and the trace movement list will pop up, showing the existing windows. The user can move the current active trace into any window (if [New window] is selected, a new window will be created).
- Page 118 Tel: 886.2.2175 2930 Email: sales@salukitec.com www.salukitec.com Click this menu, and the [Open channel] list will pop up, showing the closed channels. The user can select the channel to be opened (if [New window] is selected, a new window will be created). Click [Apply] to open the channel and continue the above operation. Click [OK] to exit the program.
- Page 119 Tel: 886.2.2175 2930 Email: sales@salukitec.com www.salukitec.com Parameter description: None Graphic configuration Function description: Click this menu to configure the filter/high power mode of the source and the reference mixer switch. Parameter description: None 5.2.4. Stimulus Press the [Stimulus] key on the front panel or the [Stimulus] menu item on the user interface, and then stimulus- related menu will pop up for setting of stimulus parameters.
- Page 120 Tel: 886.2.2175 2930 Email: sales@salukitec.com www.salukitec.com Function description: Set the starting point of the sweep frequency. Set and adjust the parameter by the mouse/keyboard or the knob, number keys and stepping keys on the front panel. Parameter description: 10MHz [10MHz - 67GHz]. Frequency Stop Function description: Set the ending point of sweep frequency.
- Page 121 Tel: 886.2.2175 2930 Email: sales@salukitec.com www.salukitec.com Set and adjust the parameter by the mouse/keyboard or the knob, number keys and stepping keys on the front panel. Parameter description: 2GHz [10MHz - 67GHz]. Power 5.2.4.2. This menu is used to set the power. Click it to enter the menu of lower level. The specific menu includes: Table 5.8 Power Menu Power...
- Page 122 Tel: 886.2.2175 2930 Email: sales@salukitec.com www.salukitec.com Table 5.9 sweep: Segment Table Menu Submenu Sweep time Number of sweep points Sweep type Sweep setup Integrated Pulse Segment table>> Segment table ON/OFF Add segment Insert segment Delete segment Independent power level ON/OFF Independent IF bandwidth ON/OFF...
- Page 123 Tel: 886.2.2175 2930 Email: sales@salukitec.com www.salukitec.com Set the sweep function. The sweep functions include the step sweep, quick sweep, dwell time and sweep delay. Parameter description: None Integrated Pulse Function description: Set the pulse measurement function. Parameter description: pulse duration: 33ns-60s Pulse rising/falling time: 30ns Segment table This menu is used for relevant setting of the segment table.
- Page 124 Tel: 886.2.2175 2930 Email: sales@salukitec.com www.salukitec.com Delete segment Function description: Delete the selected segment. Parameter description: None Delete all Segment Function description: Delete all segment Parameter description: None Show Table Function description: Show segment table. Parameter description: None. Hide table Function description: Hide Segment table Parameter description:...
- Page 125 Tel: 886.2.2175 2930 Email: sales@salukitec.com www.salukitec.com Table 5.11 Trigger Hold Single Continuous Re-Start Manual trigger Trigger... Hold Function description: If this menu is selected, the system will stop sweep and be kept at the current CW. Parameter description: None Single...
- Page 126 Tel: 886.2.2175 2930 Email: sales@salukitec.com www.salukitec.com Set the trigger menu to light up this menu. If this menu is selected, manual triggering will be done once. Parameter description: None Trigger... Function description: Select this menu to enter the trigger function setting interface. Parameter description: None 5.2.5.
- Page 127 Tel: 886.2.2175 2930 Email: sales@salukitec.com www.salukitec.com Function description: Select this menu to enter the multi-functional measurement option setting interface, such as the mixer measurement. Parameter description: None Measurement receiver Function description: Select this menu to select the receiver parameter, such as R1, R2, A, B, etc. Parameter description: None Format...
- Page 128 Tel: 886.2.2175 2930 Email: sales@salukitec.com www.salukitec.com Table 5.13 Format Log Mag phase Group delay Smith chart>> Lin Mag Linear amplitude Real Imaginary Polar coordinate Positive phase Imped Format... ...
- Page 129 Tel: 886.2.2175 2930 Email: sales@salukitec.com www.salukitec.com None Smith chart >> Function description: Select this menu to display the Smith chart curve. Parameter description: None Lin Mag Function description: Select this menu to display the linear phase curve. Parameter description: None Lin Mag Function description: Select this menu to display the linear amplitude curve.
- Page 130 Tel: 886.2.2175 2930 Email: sales@salukitec.com www.salukitec.com 10) Polar coordinate Function description: Select this menu to display the polar coordinate curve. Parameter description: None 11) Positive phase Function description: Select this menu to display the positive phase curve. Parameter description: None 12) Imped Function description: Select this menu to display the impedance curve.
- Page 131 Tel: 886.2.2175 2930 Email: sales@salukitec.com www.salukitec.com Table 5.14 Format Autoscale Autoscale All Scale.. Electrical delay Phase offset Mag Offset Scale coupling Automatic scale Function description: If this menu is selected, the vertical scale will be selected automatically so that the active trace can be better displayed in the vertical grid of the screen.
- Page 132 Tel: 886.2.2175 2930 Email: sales@salukitec.com www.salukitec.com Function description: Select this menu to set the electrical delay. Set and adjust the parameter by the mouse/keyboard or the knob, number keys and stepping keys on the front panel. Parameter description: 0s[-1000s to 1000s]. Phase offset Function description: Select this menu to set the phase offset.
- Page 133 Tel: 886.2.2175 2930 Email: sales@salukitec.com www.salukitec.com Table 5.15 Format Overlay 1x/Stack 2x/Split 3x/Quad 4x Window>> Measurement setups Display Item Soft key calibration ON/OFF Hide soft key Minimize application program Toolbar Title bar ON/OFF ...
- Page 134 Tel: 886.2.2175 2930 Email: sales@salukitec.com www.salukitec.com Three tracks will be created in three windows of Channel 1. S11 will be displayed in the Smith chart format in Window 1, S22 in the Smith chart format in Window 2 and S21 in the logarithmic format in Window 3. Four tracks will be displayed in two windows, in the logarithmic format in two channels.
- Page 135 Tel: 886.2.2175 2930 Email: sales@salukitec.com www.salukitec.com None Title bar ON/OFF Function description: Select this menu to display the title bar. Parameter description: None Status bar ON/OFF Function description: Select this menu to display the status bar. Parameter description: None Table Function description: Select this menu to display the marker table, limit table and segment table.
- Page 136 Tel: 886.2.2175 2930 Email: sales@salukitec.com www.salukitec.com Averaging factor Function description: Select this menu to set the average times of curve sweep. Set and adjust the parameter by the mouse/keyboard or the knob, number keys and stepping keys on the front panel. Parameter description: 1 [1 - 1024].
- Page 137 Tel: 886.2.2175 2930 Email: sales@salukitec.com www.salukitec.com Select this menu to set the smoothing percentage. Set and adjust the parameter by the mouse/keyboard or the knob, number keys and stepping keys on the front panel. Parameter description: 0 [0-25%]. Number of smoothing points Function description: This menu is used to set the number of smoothing points.
- Page 138 Tel: 886.2.2175 2930 Email: sales@salukitec.com www.salukitec.com Interpolation ON/OFF 5.2.6.3. Function description: Select this menu to enable the interpolation function. Parameter description: OFF [OFF|ON]. Port Extension 5.2.6.4. Function description: Select this menu to move the measurement reference plane in an electrical manner. Thus, other kinds of calibration can be avoided. Add a cable after calibration.
- Page 139 Tel: 886.2.2175 2930 Email: sales@salukitec.com www.salukitec.com Parameter description: None 2-port de-embedding Function description: Select this menu to enable the 2-port de-embedding function. For setting of 2-port de-embedding, refer to “7.9.4 2-port de-embedding” in “7.9 Fixture Compensation Calibration”. Parameter description: None Port impedance conversion...
- Page 140 Tel: 886.2.2175 2930 Email: sales@salukitec.com www.salukitec.com Power Calibration 5.2.6.8. Function description: Select this menu to set the source power, receiver calibration, etc. For power calibration setting, refer to “Port power calibration” in “6.3 Calibration of scale mixer measurement”. Parameter description: None 5.2.7.
- Page 141 Tel: 886.2.2175 2930 Email: sales@salukitec.com www.salukitec.com marker 9. Parameter description: None Close Marker Function description: Select this menu to close the corresponding marker. Parameter description: None Marker function 5.2.7.2. This menu is used to set the marker function. Click it to enter the menu of lower level. The specific menu includes: Table 5.20 Marker Function Marker→start ...
- Page 142 Tel: 886.2.2175 2930 Email: sales@salukitec.com www.salukitec.com Parameter description: None Marker→span Function description: Select this menu to set the active Δ marker frequency as the frequency span. Parameter description: None Marker→ref level Function description: Select this menu to set the power of the active marker as the power reference value. Parameter description: None Marker→delay...
- Page 143 Tel: 886.2.2175 2930 Email: sales@salukitec.com www.salukitec.com Function description: Select this menu for marker search of the maximum measurement data point. Parameter description: None Function description: Select this menu for marker search of the minimum measurement data point. Parameter description: None Peak Value This menu is used to set the peak search.
- Page 144 Tel: 886.2.2175 2930 Email: sales@salukitec.com www.salukitec.com Function description: Select this menu to search next effective peak value on the left side of the marker position. Parameter description: OFF [OFF|ON]. Peak/valley type Function description: Select this menu to select the peak type. Parameter description: Peak [Valley|Peak].
- Page 145 Tel: 886.2.2175 2930 Email: sales@salukitec.com www.salukitec.com This menu is used to as the bandwidth search. Click it to enter the menu of lower level. The specific menu includes: Table 5.23 Bandwidth Bandwidth ON/OFF Bandwidth level Trace ON/OFF Bandwidth ON/OFF Function description: Select this menu to enable the bandwidth search function.
- Page 146 Tel: 886.2.2175 2930 Email: sales@salukitec.com www.salukitec.com Parameter description: OFF [OFF|ON]. Filter statistics ON/OFF Function description: Select this menu to enable the function of filter statistics. Parameter description: OFF [OFF|ON]. Filter test This menu is used to set the filter test. Click it to enter the menu of lower level. The specific menu includes: Table 5.24 Filter Test Filter test ON/OFF ...
- Page 147 Tel: 886.2.2175 2930 Email: sales@salukitec.com www.salukitec.com 10% [0% to 100%]. Trace ON/OFF Function description: Select this menu to enable the marker tracking function for the filter test. Parameter description: OFF [OFF|ON]. Marker attribute 5.2.7.4. This menu is used to set the marker attribute. Click it to enter the menu of lower level. The specific menu includes: Table 5.25 Marker Attribute Δ...
- Page 148 Tel: 886.2.2175 2930 Email: sales@salukitec.com www.salukitec.com Fixed: the X-axis and Y-axis coordinates of the marker remain unchanged, no matter whether the amplitude of trace data changes. The marker can be moved on the X-axis by changing the stimulus value, but the Y-axis coordinate remains unchanged. Parameter description: Normal [Normal|Fixed].
- Page 149 Tel: 886.2.2175 2930 Email: sales@salukitec.com www.salukitec.com Select this menu to enable the function of one marker for one trace. Parameter description: OFF [OFF|ON]. Large font ON/OFF Function description: Select this menu to enable the function of large font display of the marker. Parameter description: OFF [OFF|ON].
- Page 150 Tel: 886.2.2175 2930 Email: sales@salukitec.com www.salukitec.com This menu is used to save the settings. Click it to enter the menu of lower level. The specific menu includes: Table 5.27 Save Data→Memory Normalization Trace operation Data trace Memory trace ...
- Page 151 Tel: 886.2.2175 2930 Email: sales@salukitec.com www.salukitec.com Memory trace Function description: Select this menu to display the memory trace Curve. Parameter description: None Data and memory Function description: Select this menu to display the data trace and memory trace curve. Parameter description: None Hide trace Function description:...
- Page 152 Tel: 886.2.2175 2930 Email: sales@salukitec.com www.salukitec.com Table 5.29 Limit Test Limit test ON/OFF Limit line display ON/OFF FAIL sound warning ON/OFF Limit table ON/OFF FAIL sign ON/OFF Limit test ON/OFF Function description: Select this menu to enable the limit test function. Clear this menu to close the function of limit test of the active trace. Parameter description: OFF [OFF|ON].
- Page 153 Tel: 886.2.2175 2930 Email: sales@salukitec.com www.salukitec.com Select this menu to enable the FAIL sign function. In case of failure of the trace data point test, the FAIL sign will appear on the screen. Parameter description: OFF [OFF|ON]. Ripple test This menu is used to set the ripple test. Click it to enter the menu of lower level. The specific menu includes: Table 5.30 Ripple Test Ripple test ON/OFF ...
- Page 154 Tel: 886.2.2175 2930 Email: sales@salukitec.com www.salukitec.com Select this menu to select the number of ripple limit segments to be opened. Up to 12 segments can be opened. Parameter description: None Edit ripple limit table Function description: Select this menu to edit the ripple limit table. The ripple limit table can be added, deleted and edited. Parameter description: None FAIL sign ON/OFF...
- Page 155 Tel: 886.2.2175 2930 Email: sales@salukitec.com www.salukitec.com Select this menu to enable the bandwidth display function. The tested bandwidth will be displayed on the screen. Parameter description: OFF [OFF|ON]. Bandwidth marking ON/OFF Function description: Select this menu to enable the bandwidth marking function. The bandwidth position mark will be displayed on the screen. Parameter description: OFF [OFF|ON].
- Page 156 Tel: 886.2.2175 2930 Email: sales@salukitec.com www.salukitec.com Trace Statistics 5.2.8.3. This menu is used to set trace statistics. Click it to enter the menu of lower level. The specific menu includes: Table 5.32 Trace Statistics Trace statistics ON/OFF Curve trace statistics ...
- Page 157 Tel: 886.2.2175 2930 Email: sales@salukitec.com www.salukitec.com Parameter description: OFF [OFF|ON]. Gate: starting Function description: Select this menu to set the starting value of the gate. Parameter description: -10ns [-14.825797ns - 14.825797ns] Gate: ending Function description: Select this menu to set the ending value of the gate. Parameter description: 10ns [-14.825797ns - 14.825797ns] Gate: center...
- Page 158 Tel: 886.2.2175 2930 Email: sales@salukitec.com www.salukitec.com Parameter description: None Time domain 5.2.8.6. This menu is used to set the time domain. Click it to enter the menu of lower level. The specific menu includes: Table 5.34 Time Domain Time domain ON/OFF ...
- Page 159 Tel: 886.2.2175 2930 Email: sales@salukitec.com www.salukitec.com Center time Function description: Select this menu to set the center time. Parameter description: 0ns [-14.825797ns - 14.825797ns] Time span Function description: Select this menu to set the time span. Parameter description: 20ns [0ns-29.651594ns]. Time domain transformation Function description: Select this menu to enter the window of time domain transformation function.
- Page 160 Tel: 886.2.2175 2930 Email: sales@salukitec.com www.salukitec.com Structural Return Loss 5.2.8.7. This menu is used to set the structural return loss. Click it to enter the menu of lower level. The specific menu includes: Table 5.35 Structural Return Loss SRL ON/OFF ...
- Page 161 Tel: 886.2.2175 2930 Email: sales@salukitec.com www.salukitec.com Function description: Select this function to enable the manual Z function. Parameter description: OFF [OFF|ON]. Equation Editor 5.2.8.8. Function description: Select this menu to enter the Equation Editor interface. Parameter description: Parameter description: OFF [OFF|ON]. 5.2.9.
- Page 162 Tel: 886.2.2175 2930 Email: sales@salukitec.com www.salukitec.com Function description: If this menu is selected, the control panel menu will pop up. The user can set the operating system. Parameter description: None System impedance Function description: Select this menu to set the system impedance. The system impedance must be changed in measurements of devices except those of 50Ω, such as waveguide devices.
- Page 163 Select this menu to open the operating system task bar. Parameter description: None Reset 5.2.9.5. Function description: Select this menu to run the application program of the S3602 series vector network analyzer. Parameter description: None Reset User State 5.2.9.6. Function description: Select this menu to customize the user state interface.
-
Page 164: Technical Support
Open the quick start manual Parameter description: None 5.2.10.2. Programming Manual Function description: Select this menu to open the Program Control Manual of S3602 Series Vector Network Analyzers. Parameter description: None 5.2.10.3. Technical Support Function description: Open the full user manual. - Page 165 Tel: 886.2.2175 2930 Email: sales@salukitec.com www.salukitec.com Function description: Select this menu to view the basic information of the instrument and the company information. Parameter description: None...
-
Page 166: Measurement Optimization
Tel: 886.2.2175 2930 Email: sales@salukitec.com www.salukitec.com 6. Measurement Optimization The following methods can be applied to adjust the setting and optimize the measurement accuracy. Reduction of accessory influence Improvement of reflection accuracy of low-loss 2-port device Increase of dynamic range ... -
Page 167: Improvement Of Reflection Accuracy Of Low-Loss 2-Port Device
Tel: 886.2.2175 2930 Email: sales@salukitec.com www.salukitec.com Menu path: [Analysis] > [Time domain] > [Time domain transformation...]. Click the [Time domain transformation] check box in the [Time domain transformation] dialog box to activate the transformation mode. Click the required transformation mode: low-pass impulse, low-pass step and band pass. Click [Frequency setting: low pass] to select the low pass mode. - Page 168 Tel: 886.2.2175 2930 Email: sales@salukitec.com www.salukitec.com Fig. 6.2 Accurate Reflection Measurement of 2-port Device The corresponding linear values are given in the brackets. Load matching (NALM)=18dB (.126) Analyzer: Direction (NAD)=40dB (.010) Insertion loss (FIL)=1dB (.891) Filter: Return loss (FRL)=16dB (.158) Insertion loss (AIL)=10dB (.316) Attenuator: SWR (ASWR)=1.05 (.024) Return loss: 32.26dB...
-
Page 169: Increase Of Dynamic Range
Tel: 886.2.2175 2930 Email: sales@salukitec.com www.salukitec.com =26.4dB =18.5dB Therefore, one of the following methods can be applied to obtain accurate results in reflection measurement of the low-loss 2-port device. Connect one high-quality load to the output end of the tested device after one-port calibration. ... - Page 170 Tel: 886.2.2175 2930 Email: sales@salukitec.com www.salukitec.com Do not apply the maximum source output power. If the test equipment has gain, the maximum source output power cannot be applied; otherwise, the receiver may be damaged. Menu path: [Stimulus] > [Power]. The power shortcut key is set on the auxiliary menu bar and front panel. Input the power value directly in the input toolbar, or click [Power...] to set the power in the dialog box.
-
Page 171: Improvement Of Measurement Results Of Electrical Long Device
Tel: 886.2.2175 2930 Email: sales@salukitec.com www.salukitec.com The more times averaging is done, the more noise will be reduced, and the larger the dynamic range will be. As shown in Fig. 6.5, sweep averaging has influence on measurement results. Fig. 6.5 Influence of Scanning Averaging on Measurement Results Reduction of random noise The average value of measurement can be independently set for each channel. -
Page 172: Improvement Of Phase Measurement Accuracy
Tel: 886.2.2175 2930 Email: sales@salukitec.com www.salukitec.com Fig. 6.6 Schematic Diagram of Test of Long Cable The delay of the electrical long device can be compensated in the following methods. Reduction of sweep speed The sweep speed can be reduced by increasing the scanning time, reducing the IF bandwidth or increasing the number of sweep points. - Page 173 Tel: 886.2.2175 2930 Email: sales@salukitec.com www.salukitec.com The electrical delay is a kind of mathematical function. The transmission line of no loss and adjustable length can be simulated. The electrical delay which is not associated with each measurement trace can be set. ...
- Page 174 Tel: 886.2.2175 2930 Email: sales@salukitec.com www.salukitec.com Fig. 6.7 Setting of Port Extension The [Port extension] dialog box will appear. Tick the [Port extension] check box. Then the port extension function will be effective for all ports. [Port]: select the current extension port in the drop-down box. The port extension settings are effective for all measurements of ...
- Page 175 Tel: 886.2.2175 2930 Email: sales@salukitec.com www.salukitec.com Click [Measurement] to start the port extension calculation. The calculated delay time and loss value will be automatically displayed in the toolbar. Fig. 6.8 Automatic Port Extension [Open circuit] and [Short circuit]: connect the open-circuit device or short-circuit device to the port requiring automatic extension. ...
- Page 176 Tel: 886.2.2175 2930 Email: sales@salukitec.com www.salukitec.com Fig. 6.9 Automatic Port Extension 6.5.4. Frequency Point Interval Sample the data of discrete frequency points, connect each sampling point and form a trace on the screen. If the phase offset of two adjacent frequency points of the device is more than 180°, the displayed phase slope will look like the reverse phase.
- Page 177 Tel: 886.2.2175 2930 Email: sales@salukitec.com www.salukitec.com 1.0 corresponds to the light speed in vacuum. 0.66 corresponds to the typical light speed in the polyethylene medium. 0.70 corresponds to the typical light speed in the Teflon medium. Fig. 6.11 Setting of Electrical Delay Electrical movement reference plane Menu path: [Calibration] >...
-
Page 178: Reduction Of Trace Noise
Tel: 886.2.2175 2930 Email: sales@salukitec.com www.salukitec.com keyboard or input zone. The problem of changes of the displayed data can be solved by increasing the number of points or reducing the frequency span. 6.6.Reduction of trace Noise Reduce the noise on the measurement trace by the network analyzer function. The following functions of the analyzer can help to reduce the influence of trace noise. - Page 179 Tel: 886.2.2175 2930 Email: sales@salukitec.com www.salukitec.com Fig. 6.13 Setting of sweep Averaging Click [Restart average] in the sub-menu to start a group of new average sweep. 6.6.2. Trace Smoothing The smoothing function is used to reduce the peak-peak noise of broadband measurement data. The data of part of the displayed trace are averaged by the analyzer.
- Page 180 Tel: 886.2.2175 2930 Email: sales@salukitec.com www.salukitec.com of scanning points of the test.) Fig. 6.15 Setting of Smoothing 6.6.3. Intermediate Frequency Bandwidth You can reduce the bandwidth of the IF receiver so as to reduce the influence of random noise in measurement. Once the IF bandwidth is reduced by 10 times, the base noise will be reduced by 10dB.
-
Page 181: Increase Of Data Point Number
Tel: 886.2.2175 2930 Email: sales@salukitec.com www.salukitec.com 6.7.Increase of Data Point Number The data point or 'point' refers to the sampling results of next value after one stimulus. You can define the number of measurement points within one sweep. The trace can be scanned through a large number of data points so as to better define the device response. ... -
Page 182: Improvement Of Measurement Stability
Tel: 886.2.2175 2930 Email: sales@salukitec.com www.salukitec.com Fig. 6.18 Setting of Number of sweep Points Optimization of measurement results One measurement includes several interdependent settings. You can modify the settings to achieve the purposes of measurement application: faster throughput or more accurate data. You can balance the settings to optimize measurement. Increase the measurement throughput. - Page 183 Tel: 886.2.2175 2930 Email: sales@salukitec.com www.salukitec.com Apply a temperature-controlled environment. Ensure the temperature stability of the calibration kit. Avoid unnecessary operation of the calibration kit during calibration. Ensure that the difference between the ambient temperature and calibration temperature is ±1℃. ...
-
Page 184: Increase Of Sweep Speed
Tel: 886.2.2175 2930 Email: sales@salukitec.com www.salukitec.com Properly connect the parts. Connect the body and other parts to the ground with anti-static pads and wrist straps. Arrange the connectors in one row. Rotate the connection nuts. Perform final connection with the torque wrench. ... - Page 185 Tel: 886.2.2175 2930 Email: sales@salukitec.com www.salukitec.com Limit test trace operation Display The sweep speed of the analyzer depends on Measurement setupss. Therefore, you should try many times to achieve the highest sweep speed and conforming measurement results. Delete the unnecessary trace.
- Page 186 Tel: 886.2.2175 2930 Email: sales@salukitec.com www.salukitec.com Menu path: [Response] > [Average] > [Smooth...]. The [Smooth] dialog box will appear. Click [Smooth ON/off] to shut down the smoothing function. Fig. 6.21 Shutdown of Smoothing Function Shutdown of limit test Menu path: [Analysis] > [Limit test...]. The [Limit test] dialog box will appear. Click [Limit test ON/off] check box to shut down the limit test function.
-
Page 187: Improvement Of Efficiency Of Multi-State Measurement
Tel: 886.2.2175 2930 Email: sales@salukitec.com www.salukitec.com Fig. 6.23 Shutdown of trace Operation Function 6.10. Improvement of Efficiency of Multi-state Measurement If multiple parameter measurements are required to represent the characteristics of one device, various methods can be applied to improve the measurement efficiency. You can try the following methods to find the most suitable application solution. Improvement of measurement efficiency by Measurement setups ... -
Page 188: Rapid Data Transmission
Tel: 886.2.2175 2930 Email: sales@salukitec.com www.salukitec.com Create the double-channel measurement. Menu path: [Response] > [Display] > [Measurement setups] > [Setting D]. Set the trigger mode of Channel 1: constantly update measurement data. Menu path: [Stimulus] > [Trigger] > [Trigger...]. The [Trigger] dialog box will appear. Select the [Internal] radio box in the trigger source zone. -
Page 189: Use Of Macro
Use COM in the automatic measurement program to achieve the highest speed of data transmission. 6.12. Use of Macro The macro is an executable file installed and run in the analyzer. S3602 series vector network analyzers support up to 10 macros. New macro ... - Page 190 Tel: 886.2.2175 2930 Email: sales@salukitec.com www.salukitec.com Fig. 6.25 [Macro setting] Dialog Box Enter the macro title text in the [Macro name] box. Enter the detailed path of the executable file in the [Executable file] box, or click the [Browse...] button to find the executable file. ...
- Page 191 Tel: 886.2.2175 2930 Email: sales@salukitec.com www.salukitec.com [DOWN] button Click it to move the selected macro down for one line. [Macro setting window] dialog box 6.12.3. [Macro name] box Set the macro title name. Editing zone [Executable file] box Set the full path of the executable file. [Browse...] button Browse the drive and director, position the executable file and establish the full path of the executable file.
-
Page 192: Calibration
Tel: 886.2.2175 2930 Email: sales@salukitec.com www.salukitec.com 7. Calibration Calibration can help to reduce the measurement error. This chapter includes the following contents: Calibration overview Selection of calibration type Calibration guide High-accuracy measurement calibration Measurement error Editing of calibration kit definition ... -
Page 193: Selection Of Calibration Type
Reconnect and measure the tested device. If error correction is applied during measurement, the error influence will be eliminated. 7.2.Selection of Calibration Type S3602 series vector network analyzers support six common calibration types, with details as follows: Open-circuit response Calibration accuracy: low to medium. - Page 194 Tel: 886.2.2175 2930 Email: sales@salukitec.com www.salukitec.com The through type device is of zero length and loss according to the definition in the calibration kit definition file. If the adapter is used as the through type device in calibration, the characteristics of the adapter must be specified in the calibration kit definition file to ensure the accuracy of calibration.
-
Page 195: Calibration Guide
Tel: 886.2.2175 2930 Email: sales@salukitec.com www.salukitec.com Measurement application: Measurement of all S-parameters. Improvement of the measurement accuracy by 12 error corrections. 7.3.Calibration Guide Select the calibration type and perform calibration according to the calibration guide of the analyzer. The through type response and isolation calibration are taken as examples below to demonstrate the calibration process (this kind of calibration is effective only in transmission measurement). - Page 196 Tel: 886.2.2175 2930 Email: sales@salukitec.com www.salukitec.com Fig. 7.4 [Through type response and isolation calibration] Dialog Box and [Select calibration kit] Dialog Box Click [Select standard], and the [Type information] dialog box will appear. Set the calibration standard and click [OK] to close the dialog box.
- Page 197 Tel: 886.2.2175 2930 Email: sales@salukitec.com www.salukitec.com Fig. 7.6 [Measurement of multiple standard kits] Dialog Box Respectively connect Port 1 and 2 to the load calibration kit. Click [Load] and the keys of the standard kit type and interface type (the display contents vary from calibration types). After selection, click [OK]. Modify the frequency range of calibration in the [Minimum frequency] and [Maximum frequency] input box.
-
Page 198: High-Accuracy Measurement Calibration
Tel: 886.2.2175 2930 Email: sales@salukitec.com www.salukitec.com 7.4.High-accuracy Measurement Calibration The calibration accuracy depends on the selected calibration type, calibration kit quality and calibration process. This section mainly discusses how to perform high-accuracy calibration. Measurement reference plane The tested device is not directly connected to the port of the analyzer in most of measurements. Instead, it is connected through the test fixture or cable. -
Page 199: Measurement Errors
Tel: 886.2.2175 2930 Email: sales@salukitec.com www.salukitec.com the loss and mismatch should be minimized to realize the highest measurement accuracy. For setting of port extension, refer to "Setting of port extension" in "6.5 Improvement of Phase Measurement Accuracy". Correct isolation calibration Isolation calibration in full 2-port calibration is applied to correct the crosstalk error between ports. - Page 200 Tel: 886.2.2175 2930 Email: sales@salukitec.com www.salukitec.com changed in high-accuracy measurement so as to reduce the switch repeatability error. Connector repeatability error Connector wear may result in electrical performance changes. Proper connection maintenance can help to reduce the connector repeatability error. 7.5.3.
- Page 201 Tel: 886.2.2175 2930 Email: sales@salukitec.com www.salukitec.com Source matching errors Ideally, the measurement receiver can receive all signals reflected from the tested device in reflection measurement. Actually, part of the signals reflected by the tested device are reflected by the measurement port back to the tested device. As such signals cannot be measured by the measurement receiver, source matching errors will be produced.
-
Page 202: Editing Of Calibration Kit Definition
Tel: 886.2.2175 2930 Email: sales@salukitec.com www.salukitec.com and phase change with the frequency. Deviations are mainly caused by the following factors: Signal separator; Test cable and adapter; Difference between the reference and test signal paths. Transmission tracking errors can be determined and reduced in the following methods. Directly connect Port 1 and 2, with zero length. - Page 203 Tel: 886.2.2175 2930 Email: sales@salukitec.com www.salukitec.com Improve the accuracy of the predefined calibration kit model. If the actual properties of the standard calibration kit can be described with the model, the calibration will be more accurate. For example, change the load impedance into 50.1Ω, instead of the defined 50Ω.
- Page 204 Tel: 886.2.2175 2930 Email: sales@salukitec.com www.salukitec.com Call the [Open] dialog box and import the calibration kit definition in the hard disc or other drives. b) [Save as] button Open the [Save as] dialog box to save the selected calibration kit definition. c) [Insert new calibration kit] button Open the [Edit calibration kit] dialog box to create a new calibration kit definition.
- Page 205 Tel: 886.2.2175 2930 Email: sales@salukitec.com www.salukitec.com Display or edit the characteristic description of the calibration kit. Connector type zone [Connector] box Click the [Connector] box or arrow button to select the connector type. [Add] button Click the [Add] button. The [Add connector] dialog box will appear. Add the new connector type of the calibration kit. [Modify] button The [Modify connector name] dialog box will appear.
- Page 206 Tel: 886.2.2175 2930 Email: sales@salukitec.com www.salukitec.com 7.6.6. [Add connector] Dialog Box Fig. 7.12 [Add connector] Dialog Box Characteristic zone [Name] box Define the name of the calibration kit connector. [Description] box Define the characteristic description of the calibration kit connector. Frequency range [Minimum frequency] box Define the allowable minimum frequency of the standard calibration kit in calibration.
- Page 207 Tel: 886.2.2175 2930 Email: sales@salukitec.com www.salukitec.com Fig. 7.13 [Add connector] Dialog Box Calibration kit type zone Select the calibration type to be edited or observed. [>>] and [<<] button Click the [>>] and [<<] button to add or delete the standard calibration kit of the selected type or select the standard calibration kit in the [Non-selected standard calibration kits] box.
- Page 208 Tel: 886.2.2175 2930 Email: sales@salukitec.com www.salukitec.com Fig. 7.15 [Open-circuit device] Dialog Box Characteristic zone [Standard calibration kit ID] box Display or edit the serial number of the standard calibration kit. [Name] box Display or edit the name of the standard calibration kit. [Description] box Display or edit the characteristic description of the standard calibration kit.
- Page 209 Tel: 886.2.2175 2930 Email: sales@salukitec.com www.salukitec.com [Impedance] box Define the impedance of the standard calibration kit. [Short-circuit device] Dialog Box 7.6.10. Fig. 7.16 [Short-circuit device] Dialog Box Short circuit characteristic zone Define the residual inductance of the short-circuit device with [L0], [L1], [L2] and [L3]. [Load] Dialog Box 7.6.11.
-
Page 210: Standard Calibration Kit
Tel: 886.2.2175 2930 Email: sales@salukitec.com www.salukitec.com [Fixed impedance] radio box Select it to set the load type as the fixed load. [Sliding resistance] radio box Select it to set the load type as the sliding load. [Specific impedance] radio box Select it to set the load different from the system impedance Z0. - Page 211 Tel: 886.2.2175 2930 Email: sales@salukitec.com www.salukitec.com to calculate various errors of the error model. The analyzer can measure the responses of standard calibration kits in calibration, and errors can be calculated by comparing the measurement results and the known values of the model. The influence of errors on measurement results is eliminated by mathematical operation which is also known as error correction.
-
Page 212: Trl Calibration
Tel: 886.2.2175 2930 Email: sales@salukitec.com www.salukitec.com Residual inductance model of short-circuit device The short-circuit device almost has no ideal reflection characteristics as a result of the effects of residual inductance at high frequency. The phase shift changes with the frequency. Such effects cannot be eliminated. The fringe inductance is defined in the short-circuit device model. -
Page 213: Fixture Compensation Calibration
Tel: 886.2.2175 2930 Email: sales@salukitec.com www.salukitec.com between 20° and 160° at each frequency point. Therefore, the actual coverage range of a single transmission line is 8:1. In order to cover a wider frequency range, multiple transmission line type standard calibration kits are required. The transmission line type standard calibration kit should be particularly long at low frequency. - Page 214 Tel: 886.2.2175 2930 Email: sales@salukitec.com www.salukitec.com Port Matching... 2-port clamp de-embedding Port impedance conversion... Four-port fixture embedding/de-embedding 7.9.1. Terms of Fixture Simulator Fixture The fixture refers to a device which is set between the tested device and cable and used to fix the tested device. The S-parameter is the key to fixture embedding and de-embedding.
- Page 215 Tel: 886.2.2175 2930 Email: sales@salukitec.com www.salukitec.com Fig. 7.21 Schematic Diagram of Port Matching... (take the 2-port tested device as an example) [Port Matching...] dialog box Fig. 7.22 [Port Matching...] Interface [Port selection] drop-down menu Select the port number of the matching circuit embedded into the vector network. [Matching circuit type] drop-down menu...
- Page 216 Tel: 886.2.2175 2930 Email: sales@salukitec.com www.salukitec.com Select the embedded matching circuit type. The network analyzer is provided with the following import formats: None (with no circuit embedded), 5 circuit parameter models and S2P file. Different schematic diagrams will appear in the [Circuit] bar when different types are selected.
- Page 217 Tel: 886.2.2175 2930 Email: sales@salukitec.com www.salukitec.com This is not available in the default mode. If one of the five circuit parameter models is selected in the [Matching circuit type] drop-down menu, this button will be available. Click this button to reset all the contents in the [Circuit parameter model setting] edit box. [Port Matching...
- Page 218 Tel: 886.2.2175 2930 Email: sales@salukitec.com www.salukitec.com [De-embedding type] drop-down menu Select the de-embedding type in the drop-down menu on the right side of [Port selection]. The network analyzer is configured with the user-defined de-embedding type. The contents in the schematic diagram will change if different types are selected. [Import file] button This is not available in the default mode.
- Page 219 Tel: 886.2.2175 2930 Email: sales@salukitec.com www.salukitec.com Click the [Fixture de-embedding on/OFF] button in the dialog box to enable the 2-port fixture de- embedding function. Click the [Port selection] drop-down menu and select the port for fixture de-embedding. Select the de-embedding type in the drop-down menu on the right side of [Port] selection. The network analyzer is configured with the user-defined de-embedding type.
- Page 220 Tel: 886.2.2175 2930 Email: sales@salukitec.com www.salukitec.com impedance conversion...] dialog box will appear. Tick the [impedance conversion... on/OFF] button in the dialog box to enable the port impedance conversion... function. Click the [Port selection] drop-down menu and select the port for impedance conversion..Edit the real part and imaginary part of the impedance to be transformed in the [R (real part of impedance)] an [jX (imaginary part of impedance)] edit box.
-
Page 221: Electronic Calibration
Tel: 886.2.2175 2930 Email: sales@salukitec.com www.salukitec.com corresponding port relationship to determine the number of the embedding/de- embedding port and the corresponding relationship to the port for file import. [Enable on/OFF] check box Select this check box to enable the fixture embedding/de-embedding function. [OK] button Click it to make the settings in the dialog box effective for the current active channel. - Page 222 Tel: 886.2.2175 2930 Email: sales@salukitec.com www.salukitec.com Fig. 7.29 Connection of Four-port Network Analyzer and Electronic Calibration Kit Electronic calibration kit and electronic calibration: For more details, refer to the User Manual of SAV2040X Electronic Calibration Kit. Precautions of electronic calibration: 1.Do not disconnect or insert or connect the USB interface equipment during communication with the USB interface.
- Page 223 Tel: 886.2.2175 2930 Email: sales@salukitec.com www.salukitec.com Fig. 7.30 [Electronic calibration kit] Interface Process of electronic calibration: Connect one end of the USB cable to the USB interface of the electronic calibration kit and the other end to the USB interface of the front panel or rear panel of the vector network analyzer.
- Page 224 Tel: 886.2.2175 2930 Email: sales@salukitec.com www.salukitec.com Selection of electronic calibration kit and characteristic data: If only one electronic calibration kit is connected to the vector network analyzer, the following calibration steps can be directly performed without calibration kit selection. Step 4: Select the multi-port or one-port calibration in the [Selection of calibration type] ...
-
Page 225: Basis Of Network Measurement
Tel: 886.2.2175 2930 Email: sales@salukitec.com www.salukitec.com 8. Basic Knowledge of Network Measurement This chapter introduces the following contents: Reflection measurement Phase measurement Amplifier parameter specifications Complex impedance Group delay Absolute output power AM-PM transformation ... - Page 226 Tel: 886.2.2175 2930 Email: sales@salukitec.com www.salukitec.com based on the same reflection measurement data and can be respectively displayed in one or more graphic format(s). See details in “4.7 Selection of Data Format and Scale". Return Loss 8.1.1.1. A simple way to express reflection data is the return loss, which is a scalar in dB. The return loss refers to the dB difference between the reflected signal and incident signal.
-
Page 227: Phase Measurement
Tel: 886.2.2175 2930 Email: sales@salukitec.com www.salukitec.com of the reflected wave is the same as that of the incident wave (ρ = 1), no current flows through the open-circuit device, and the reflected voltage wave is the same as the incident voltage wave. Fig. - Page 228 Tel: 886.2.2175 2930 Email: sales@salukitec.com www.salukitec.com It is important to understand the amplitude and phase information of the tested device to integrate high-level devices. Similar to the amplitude measurement, the S-parameter is also applied in phase measurement. Phase measurement is a kind of relative (ratio) measurement instead of absolute measurement.
-
Page 229: Amplifier Parameter Specifications
Tel: 886.2.2175 2930 Email: sales@salukitec.com www.salukitec.com Fig. 8.9 Phase Format of Analyzer 8.2.4. Type of Phase Measurement Complex impedance: the complex impedance data such as the resistance, reactance, amplitude and phase can be determined by S11 and S22 measurement and observed in the Smith chart and polar coordinate format. See details in “8.4 Complex Impedance". - Page 230 Tel: 886.2.2175 2930 Email: sales@salukitec.com www.salukitec.com The output power of the amplifier is proportional to the input power in the case of small signal. The small-signal gain is within the linear zone. With the power level of the input signal increasing, the amplifier will be saturated, and the output power will reach the limit, leading to gain decline.
-
Page 231: Complex Impedance
Tel: 886.2.2175 2930 Email: sales@salukitec.com www.salukitec.com The amount of energy reflected by the device is associated with the complex impedance of the device. The complex impedance is composed of the resistance component and reactance component and can be calculated with the system characteristic impedance and reflection coefficient by the following formula: See details in “8.4 Complex Impedance". - Page 232 Tel: 886.2.2175 2930 Email: sales@salukitec.com www.salukitec.com The influence of these factors can be reduced in the full 2-port calibration. If the output end of the tested device is connected with a high-quality load, the same measurement accuracy can be achieved by means of one-port calibration. Fig.
-
Page 233: Group Delay
Tel: 886.2.2175 2930 Email: sales@salukitec.com www.salukitec.com 8.5.Group Delay The phase distortion of the tested device is measured in group delay measurement. The group delay refers to the actual transition time of the signal through the tested device and changes over the frequency. The aperture of group delay measurement must be specified to describe the group delay indicator. - Page 234 Tel: 886.2.2175 2930 Email: sales@salukitec.com www.salukitec.com Use the specified frequency aperture as the frequency change (dω). Using the above two values, calculate the approximate value of the phase change rate over the frequency. The approximate value is the group delay (assuming that the phase changes linearly within the specified frequency aperture). 8.5.2.
- Page 235 Tel: 886.2.2175 2930 Email: sales@salukitec.com www.salukitec.com calculation. Apply the smoothing function of the analyzer. Perform sweep once, enable the smoothing function and change the value percentage in smoothing settings. This is similar to change of the frequency interval between sweep points. This method allows a wider group delay aperture, and the phase shift is allowed to exceed 180°...
-
Page 236: Absolute Output Power
Tel: 886.2.2175 2930 Email: sales@salukitec.com www.salukitec.com Fig. 8.16 Connection in Group Delay Measurement Select the S21 measurement mode. Select the settings corresponding to the tested device, including: Format: phase. Scale: automatic scale. Number of measurement points: select the appropriate number to avoid insufficient sampling. Remove and calibrate the tested device. -
Page 237: Am-Pm Transformation
Tel: 886.2.2175 2930 Email: sales@salukitec.com www.salukitec.com If necessary, fully attenuate the output power of the amplifier. Too high power may lead to the following results: The output power is higher than the input compression level of the receiver of the analyzer, which may lead to inaccurate measurement results. - Page 238 Tel: 886.2.2175 2930 Email: sales@salukitec.com www.salukitec.com Thermal drift; Multipath attenuation. Deliberate signal amplitude modulation: QAM (quadrature amplitude modulation); Sudden pulse modulation. AM-PM transformation is generally defined as the output phase change in radian/dB, corresponding to 1dB increase of the sweep power applied on the input end of the amplifier (at the 1dB gain compression point).
- Page 239 Tel: 886.2.2175 2930 Email: sales@salukitec.com www.salukitec.com If necessary, fully attenuate the output power of the amplifier. Too high power may lead to the following results: The output power is higher than the input compression level of the receiver of the analyzer, which may lead to inaccurate measurement results.
-
Page 240: Linear Phase Offset
Tel: 886.2.2175 2930 Email: sales@salukitec.com www.salukitec.com 8.8.Linear phase offset The linear phase offset refers to the phase distortion of the device. The electrical delay function of the analyzer is applied in measurement to eliminate the linear part of the phase shift and realize high-resolution nonlinear part, i.e. linear phase offset. 8.8.1. -
Page 241: Reverse Isolation
Tel: 886.2.2175 2930 Email: sales@salukitec.com www.salukitec.com done. 8.8.6. Steps of Linear phase offset Measurement Reset the analyzer. Adjust the source power of the analyzer to test the amplifier. Set the source power of the analyzer to make the amplifier working within the linear zone (generally at least 10dB less than the 1dB compression point). -
Page 242: Small Signal Gain And Flatness
Tel: 886.2.2175 2930 Email: sales@salukitec.com www.salukitec.com As the amplifier generally has high loss in the reverse direction, the attenuator or coupler is not required to protect the receiver of Port 1 in reverse transmission measurement. In case of no attenuator, the dynamic range and measurement accuracy will be improved. The source power can be increased to improve the dynamic range and accuracy. - Page 243 Tel: 886.2.2175 2930 Email: sales@salukitec.com www.salukitec.com What is gain? 8.10.1. The amplifier gain is defined as the power difference between the output signal and input signal of the amplifier (power unit: dBm), given that the input impedance of the amplifier is the same as the output impedance. It is the characteristic impedance of the system. The gain is referred to as S21 among the S-parameter terms.
- Page 244 Tel: 886.2.2175 2930 Email: sales@salukitec.com www.salukitec.com Fig. 8.23 Connection in Small Signal Gain and Flatness Measurement Connect the amplifier as shown in Fig. 8.23 and provide the DC bias. Set the analyzer corresponding to the tested amplifier. Remove and calibrate the amplifier. The attenuator, coupler and cable used in measurement must be included in calibration. Reconnect the amplifier.
-
Page 245: Remote Control
This chapter mainly describes the program control basics, program-control interface and configuration method and basic VISA interface programming method of S3602 series vector network analyzers, as well as the concept of I/O instrument driver library. to facilitate remote control of the user. Specific contents include: Basis of remote control ... - Page 246 Tel: 886.2.2175 2930 Email: sales@salukitec.com www.salukitec.com transmission mode in data transmission, as the speed of LAN transmission is high. Generally, the cable between the computer and vector network analyzer must be no more than 100m long (100Base-T and 10Base-T). For more details of LAN communication, visit http://www.ieee.org.
- Page 247 Tel: 886.2.2175 2930 Email: sales@salukitec.com www.salukitec.com Socket is a kind of software specially programmed and has defined the information necessary for network communication such as IP address and device port number and integrated some basic operations of network programming. Socket can be used as long as the packaged libraries are installed in the OS.
- Page 248 Tel: 886.2.2175 2930 Email: sales@salukitec.com www.salukitec.com 0x0525: vendor code. 0x1100: instrument code. 1404001: serial number of the instrument. 9.1.2. Message Messages transmitted through the data lines are divided into the following two types. Interface message The low attention line should be installed for communication between the instrument and master control computer, and then interface messages can be transmitted to the instrument through the data line.
- Page 249 Std488.1-1987. NewYork, NY, 1998. Standard Commands for Programmable Instruments (SCPI) VERSION 1999.0. For details of the program control command set, classification and specifications of S3602 series vector network analyzers, refer to: "3 Program Control Commands" of the program control manual.
- Page 250 Tel: 886.2.2175 2930 Email: sales@salukitec.com www.salukitec.com A special type of command. For query of control equipment, return to the response message conforming to the controller grammar requirements. Query string always end with a question mark. Command type The SCPI command is divided into two types: general command and special instrument command. Figure 5.2 shows the differences of two types of commands.
- Page 251 Tel: 886.2.2175 2930 Email: sales@salukitec.com www.salukitec.com Example: LIST:POWer5 Table 9.3 Command Grammar Character, Keyword and Grammar Examples Upper-case lettering indicates the minimum set of characters required [:SOURce]:FREQuency[:CW]?, FREQ is the short part of the command. to execute the command. The lowercase character part of the command is optional. This flexible :FREQuency :FREQ, format is known as "flexible listening".
- Page 252 Tel: 886.2.2175 2930 Email: sales@salukitec.com www.salukitec.com Command parameter and response SCPI defines different data formats for use in program and response messages. It does this to accommodate the principle of forgiving listening and precise talking. Refer to IEEE488.2 for more information. Forgiving listening means the command and parameter formats are flexible.
- Page 253 Tel: 886.2.2175 2930 Email: sales@salukitec.com www.salukitec.com Extended Numeric Parameters The numeric parameter is extended to specify the physical quantity in the majority of measurements related to special instrument commands. Extended numeric parameters accept all numeric parameter values and other special values as well. The extended numeric parameters include the MAXimum and MINimum.
- Page 254 Tel: 886.2.2175 2930 Email: sales@salukitec.com www.salukitec.com -1.0E+2 +1.0E+2 0.5E+0 0.23 -100.0 +100.0 Integer Response Data Integer response data are decimal representations of integer values including signs. For status register query, integer response data will be returned in most cases. Examples of integer response data: Signs are optional +100 leading + allowed...
- Page 255 Tel: 886.2.2175 2930 Email: sales@salukitec.com www.salukitec.com #H2D #Q55 In the following example, the hexadecimal value 000A is used to set the RF output power as 10dBm (or equivalent to the value in the selected unit, such as DBUV or DBUVEMF). :POW#H000A In the non-decimal format, the measurement unit such as DBM or mV is not used together with the value.
- Page 256 Tel: 886.2.2175 2930 Email: sales@salukitec.com www.salukitec.com The returned result may be the current starting frequency of the instrument before command sending, as the commands will be executed one by one by the host program after command messages are received. The returned result may be 1GHz in the case of execution after the commands are received by the host program.
- Page 257 Tel: 886.2.2175 2930 Email: sales@salukitec.com www.salukitec.com STB and SRE The top register of the status report system is composed of the status byte (STB) and associated shielding register, i.e. service request enabling register (SRE). STB is used to collect the information of registers of the lower layers and save the general working conditions of the instrument.
- Page 258 Tel: 886.2.2175 2930 Email: sales@salukitec.com www.salukitec.com Fig. 9.3 Hierarchical Structure of Status Register SRE and ESE The Service Request Enable (SRE) register is used as the enabling part of STB. Similarly, ESE can be used as the enabling part of ESR.
-
Page 259: Programmed Port And Configuration Of Instrument
It must not be used for program control of the instrument. Establish Connection 9.2.1.1. Connect the S3602 series vector network analyzer and external controller (computer) to LAN through network cables, as shown in Fig. 9.4. Fig. 9.4 Connection Diagram of LAN Interface... - Page 260 Establish Connection 9.2.2.1. Connect the S3602 series vector network analyzer to the external controller (computer) through the GPIB cable, as shown in Fig. 9.6. Fig. 9.6 Connection Diagram of GPIB Interface Fig. 9.7 GPIB Interface of Rear Panel of Instrument...
-
Page 261: Basic Programming Method Of Visa Interface
Establish Connection 9.2.3.1. Connect the S3602 series vector network analyzer to the external controller (computer) through the USB cable, as shown in Fig. 9.8. Fig. 9.8 USB Connection Diagram Fig. 9.9 USB Interface for Programming on Rear Panel of Instrument Interface Configuration 9.2.3.2. - Page 262 Tel: 886.2.2175 2930 Email: sales@salukitec.com www.salukitec.com Reading of frequency marker Reading of trace data Command synchronization 9.3.1. VISA Library VISA is a general term of the standard I/O function library and related standards. The VISA library is a set of functions which can be called easily called.
- Page 263 Tel: 886.2.2175 2930 Email: sales@salukitec.com www.salukitec.com Const char analyzerString [VI_FIND_BUFLEN] = "GPIB0::16::INSTR"; Const analyzerTimeout = 10000; The constant analyzerString refers to the instrument descriptor, “GPIB0" refers to the controller, and "16" refers to the instrument connected to the controller. Assuming that the instrument is connected LAN, the IP address is "192.168.1.1" and the port number is "1024", the variable is: Const char analyzerString [VI_FIND_BUFLEN] = "TCPIPO::192.168.1.1::1024::SOCKET";...
- Page 264 9.3.3. Sending of Setting Command Setting of sweep Parameters / 9.3.3.1. *************************************************************************/ The following example shows how to set the sweep parameters of S3602 series vector network analyzers. / *************************************************************************/ void SweepSettings() ViStatus status; long retCnt; // selection of measurement status = viWrite(analyzer, ":CALC:PAR:SEL „CH1_WIN1_LINE1‟...
- Page 265 Tel: 886.2.2175 2930 Email: sales@salukitec.com www.salukitec.com status = viWrite(analyzer, ":SOUR:POW -10dBm\n", 22, &retCnt); Setting of Display Parameters 9.3.3.2. /*************************************************************************/ The following example mainly includes: Setting of data format; Display of trace, title and frequency notes; Automatic scaling of trace; Query of scale, reference level and reference position; Opening and setting of averaging;...
- Page 266 Tel: 886.2.2175 2930 Email: sales@salukitec.com www.salukitec.com status = viWrite(analyzer, ":DISPlay:WINDow1:TRACe1:Y:SCALe:RLEVel?\n", 60, &retCnt); Sleep(10); status = viRead(analyzer, rd_Buf_Data, 20, &retCnt); status = viWrite(analyzer, ": DISPlay:WINDow1:TRACe1:Y:SCALe:RPOSition?\n", 60, &retCnt); Sleep(10); status = viRead(analyzer, rd_Buf_Data, 20, &retCnt); // open the averaging function and set the averaging factor as 5 status = viWrite(analyzer, ": SENSe1:AVERage:STATe ON\n", 30, &retCnt);...
- Page 267 Tel: 886.2.2175 2930 Email: sales@salukitec.com www.salukitec.com 9.3.5. Reading of Frequency Marker /*************************************************************************/ The following example shows how to read the frequency scale information. /*************************************************************************/ void ReadMarker () ViStatus status; long retCnt; char rd_Buf_Marker[VI_READ_BUFLEN]; // #define VI_READ_BUFLEN 20 // open the frequency marker 1 and query the frequency marker peak (frequency and amplitude) status = viWrite(analyzer, ":CALC:MARKER ON;MARKER: FUNCtion:EXECute MAXimum\n", 25, &retCnt);...
- Page 268 Tel: 886.2.2175 2930 Email: sales@salukitec.com www.salukitec.com status = viWrite(analyzer, ":CALCulate:PARameter:SELect ' CH1_WIN1_LINE1'\n", 25,&retCnt); // obtain the number of sweep point status = viWrite(analyzer, ":SENSe1:SWEep:POIN?\n", 15, &retCnt); status = viRead(analyzer, rd_Buf_Data, 30, &retCnt); points = atoi(rd_Buf_Data); // sweep once status = viWrite(analyzer, ":SENSe1:SWEep:GROups:COUNt 1\n",30, &retCnt); status = viWrite(analyzer, ":SENS:SWE:MODE GROups\n",30, &retCnt);...
-
Page 269: I/O Library
Tel: 886.2.2175 2930 Email: sales@salukitec.com www.salukitec.com status = viWrite(analyzer, "ABOR;INIT:IMM; *OPC?", 20, &retCnt); status = viRead(analyzer, OpcOk, 2, &retCnt); //Wait for*OPC and return to "1" // Method 3 of waiting for ending of sweep: use *OPC // To enable GPIB service request, set "Disable Auto Serial Poll" as "yes" status = viWrite(analyzer, "*SRE 32", 7, &retCnt);... - Page 270 Tel: 886.2.2175 2930 Email: sales@salukitec.com www.salukitec.com Fig. 9.11 Instrument Driver Structure Model Details are as follows: Functional body. This is the main functional part of the instrument driver and can be understood as the framework program of the instrument driver. Interactive developer interface.
- Page 271 Tel: 886.2.2175 2930 Email: sales@salukitec.com www.salukitec.com The installed IVI driver is divided into the IVI inherent function group and instrument function group (basic function group and extended function group). For specific functional classification, functions and attribute details, refer to the help file of the driver. Port configuration and I/O library installation: Before controlling the vector network analyzer with a computer, check whether the necessary port and I/O library are properly installed and configured.
-
Page 272: Fault Diagnoses And Repair
This chapter will introduce how to find out problems and receive the after-sale service. Error information of the network analyzer is also introduced. In case of any fault in operation of the purchased S3602 series vector network analyzer or when you need to purchase relevant component or accessory, please contact us as we provide complete after-sales services. -
Page 273: Fault Diagnosis And Troubleshooting
10.2. Fault Diagnosis and Troubleshooting Fault diagnosis and guidance This section aims to guide simple judgment and disposal of faults of S3602 series vector network analyzers. If necessary, provide accurate feedback to the manufacturer to solve problems as soon as possible. - Page 274 Tel: 886.2.2175 2930 Email: sales@salukitec.com www.salukitec.com System Problems 10.2.1. 10.2.1.1. The standby light is not ON. Check whether the 220V AC power input of the network analyzer is normal. The allowable maximum deviation is 220V±10%. If the deviation is too large or small, the instrument may not work normally. In case of abnormality, check external wires for any failure; power on the instrument again and restart it after trouble-shooting.
-
Page 275: Error Information
Tel: 886.2.2175 2930 Email: sales@salukitec.com www.salukitec.com In case of no response of front panel keys, which is caused by damage of the instrument drive program, download the vector network analyzer and reinstall it. For specific steps, refer to "3.1.2.2 Updating of Network Analyzer Program". Select the "Complete" installation type and reinstall the drive program. - Page 276 Tel: 886.2.2175 2930 Email: sales@salukitec.com www.salukitec.com Error information formats In the remote control mode, error information is recorded in the error log. Query the error information with the command "SYSTem:ERRor?". Error information formats are as follows: "Time:" "Error No.:" "Error level:" "Error type:"...
- Page 277 Tel: 886.2.2175 2930 Email: sales@salukitec.com www.salukitec.com The calibration type of Channel <x> and Measurement <x> is "None”. Select the calibration type by the [Calibration] menu or with the keys. Prompt Calibration will not be done if the calibration type is not selected or the invalid calibration type is set. This error is caused by no calibration or calibration without calibration type selection.
- Page 278 Tel: 886.2.2175 2930 Email: sales@salukitec.com www.salukitec.com The RF channel is not connected to the electrical calibration module, and no signal is found in the corresponding calibration measurement. Execution error: no space for new calibration kit. Delete one calibration kit. Key parameters include the sweep type, Prompt starting frequency, frequency span and point number.
- Page 279 Tel: 886.2.2175 2930 Email: sales@salukitec.com www.salukitec.com Prompt Setting conflict: the network analyzer cannot be initialized (wrong address?). Prompt Setting conflict: the print port drive program or USB-driven dynamic library cannot be loaded. Prompt Setting conflict: the calibration canning mode is invalid. Prompt Setting conflict: the calibration type is invalid.
- Page 280 Tel: 886.2.2175 2930 Email: sales@salukitec.com www.salukitec.com A circle cannot be properly fitted as a result of inappropriate sliding in measurement of the standard calibration kit for the sliding load. The original impedance of the standard calibration kit is used to determine the direction of one or more point(s).
- Page 281 Tel: 886.2.2175 2930 Email: sales@salukitec.com www.salukitec.com A new calibration set has been created. The newly created calibration set will be automatically named and sealed with the timestamp. Only the calibration set Error subject to calibration can be saved. In case of suspension or failure in completion of calibration, the calibration set will be deleted.
- Page 282 Tel: 886.2.2175 2930 Email: sales@salukitec.com www.salukitec.com The new calibration file is used in the old software. The version is not compatible. The DSP board drive program does not work. Check the hardware. Use simulation data in the software. Error Communication between the network analyzer and DSP board fails. The hardware or drive program may be faulty. The serial bus of the instrument does not work properly.
- Page 283 Tel: 886.2.2175 2930 Email: sales@salukitec.com www.salukitec.com The limit line test fails. The limit line test is successful. 1029 Prompt The limit line test is successful. Exceed the maximum number of tests. 1030 Warning At most 512 measurements can be created. An error occurs inside the analyzer.
- Page 284 Tel: 886.2.2175 2930 Email: sales@salukitec.com www.salukitec.com Save the trace before trace operation. No reference marker. 1108 Error Try to create the △marker (only for COM) before creating the reference marker The data and saved track do not match with each other. The track operation is shut down. 1109 Error Warning: channel settings are changed in trace operation.
- Page 285 Tel: 886.2.2175 2930 Email: sales@salukitec.com www.salukitec.com 1285 Prompt <x> error caused by the received SCPI command: "<x>”. 1400 Warning <x> command error. 1401 Warning The command parameter must be entered in <x>. 1402 Warning The command parameter entered in <x> is not correct. 1403 Error The command in <x>...
- Page 286 Tel: 886.2.2175 2930 Email: sales@salukitec.com www.salukitec.com 1541 Warning Failure to establish the connection to the specified printer. 1542 Prompt Cancel the printing output. No window is found. 1616 Error The window specified in the program does not exist. 1617 Error Copy the ID of the specified window.
- Page 287 Tel: 886.2.2175 2930 Email: sales@salukitec.com www.salukitec.com The channel number is beyond the range. 1871 Error The specified channel number is beyond the allowed range. The channel is not found. 1872 Error An unknown channel is specified under the program control. The proposed sweep segment is not found.
- Page 288 Tel: 886.2.2175 2930 Email: sales@salukitec.com www.salukitec.com The file <x> has been restored. 2063 Error Only in remote application. The <x> version is older than the current version. 2064 Error Try to restore an invalid file. The <x> version is newer than the current version. 2065 Error Try to restore the latest file of the network analyzer.
- Page 289 Tel: 886.2.2175 2930 Email: sales@salukitec.com www.salukitec.com 2087 Error EOIP: asynchronous I/O operations are performed. 2088 Error ECAP: the operation fails. 2089 Error EFSO: file system error. 2090 Error EBUS: GPIB bus error. 2091 Error ESTB: overflow of serial polling status byte queue. 2092 Error ESRQ: query request signal blockage.
- Page 290 Tel: 886.2.2175 2930 Email: sales@salukitec.com www.salukitec.com 2147 Error Reserved. 2148 Error Reserved. 2149 Error Reserved. 2150 Error <x> is beyond the range. 2152 Error Front panel <x>. 2153 Error Front panel information. Power supply service <x>. 2154 Error Many power supply service programs are running. Only one program can be applied. This is generally caused by operation of the installed program, especially CPU board upgrading.
-
Page 291: Technical Indicators And Measurement Methods
11.1. Technical Indicators This section lists the details of performance indicators and technical parameters of S3602 series vector network analyzers. By reading this section, the user will have an accurate understanding on main performance indicators of the product. Normal working conditions of the instrument include the ambient temperature of 0°C to +40°C and 1 standard atmospheric pressure. - Page 292 Tel: 886.2.2175 2930 Email: sales@salukitec.com www.salukitec.com Frequency range 10MHz≤f≤4GHz 4GHz<f≤13.5GHz 13.5GHz<f≤67GHz Output harmonic suppression of Port 1 and 3 -51dBc -60dBc -60dBc Output harmonic suppression of Port 2 and 4 -13dBc -21dBc -60dBc Maximum Output Power of Port 11.1.5. Table 11.2-1 Maximum Output Power Indicator of S3602A/B Test Port Standard, Option 400 Option 201,401,402 Description...
- Page 293 Tel: 886.2.2175 2930 Email: sales@salukitec.com www.salukitec.com Standard, Option 400 Option 201,401,402 Description Port 1,3 Port 1,3 Port 2,4 Port 2,4 Filtered Mode Hi Power Mode Filtered Mode Hi Power Mode 26.5GHz to 40GHz +3dBm +3dBm 0dBm 0dBm 40GHz to 67GHz +5dBm +5dBm 0dBm...
- Page 294 Tel: 886.2.2175 2930 Email: sales@salukitec.com www.salukitec.com +5dBm 43.5GHz<f≤50GHz System Trace Noise 11.1.10. Table 11.5 S3602 System Trace Noise (Power setting: -5dBm; IF bandwidth: 1kHz) Frequency range S3602 A/B S3602 C/D S3602 E Amplitude Trace Phase Trace Amplitude Trace Phase Trace Amplitude Trace Phase Trace 10MHz≤f≤50MHz...
- Page 295 Tel: 886.2.2175 2930 Email: sales@salukitec.com www.salukitec.com Effective load matching; ≥48dB ≥44dB ≥44dB Table 11.7 Transmission Tracking, Reflection Tracking, Effective Source Matching, Effective Direction and Effective Load Matching of S3602C/D (Power setting: -5dBm; IF bandwidth: 10Hz, 23℃±3℃) Frequency range 10MHz≤f≤2GHz 2GHz<f≤13.5GHz 13.5GHz<f≤40GHz 40GHz<f≤50GHz Transmission tracking...
- Page 296 Storage temperature range -30°C - 70°C Number of Measurement Points 11.1.17. The number of measurement points in each frequency sweep of S3602 series vector network analyzers can be set between 1 and 32001. Measurement Display Format 11.1.18. S3602 series vector network analyzers have the following measurement display options: logarithmic amplitude, linear amplitude, standing wave ratio, phase, group delay, real part, imaginary part, Smith chart, and polar coordinates.
- Page 297 Tel: 886.2.2175 2930 Email: sales@salukitec.com www.salukitec.com Setting range: ±500dB Setting resolution: 0.001dB Setting of Reference Phase 11.1.25. Setting range: ±500° Setting resolution: 0.01° Storage Function 11.1.26. The following files can be saved: state calibration files (*.cst), state files (*.sta), calibration files (*.cal), data files (*.dat, *.cti, *.s1p, *.s2p, *.s3p and *.s4p), table files (*.prn) and graphical files (*.bmp and *.jpg).
-
Page 298: Measurement Methods
Test of Frequency Accuracy 11.2.1. 11.2.1.1. Items of Frequency Accuracy Test Test the frequency accuracy indicators of frequency sweep signals output by S3602 series vector network analyzers. 11.2.1.2. Instrument and Accessories for Test of Frequency Range and Accuracy 1) Frequency meter... - Page 299 11.2.3. 11.2.3.1. Items of Test of Port Output Harmonic Suppression Test the harmonic suppression indicators of frequency sweep signals output by the port of S3602 series vector network analyzers. 11.2.3.2. Instrument and Accessories for Test of Port Output Harmonic Suppression Spectrum analyzer R&SFSUP50...
- Page 300 As shown in Fig. 11.3, connect the system and preheat is for 60min at least. Press [Reset] to set the initial state of the S3602 series vector network analyzer. Click [Channel] > [Hardware configuration] > [Path configuration]. Select the filtering mode for the low-frequency segment of Port 1 and 3. Press [Power] > [-5] and the ENTER key.
- Page 301 As shown in Fig. 11.4, calibrate/clear the power meter, connect the power probe to Port 1 and record the minimum reading. Successively change the sweep frequency of the S3602 series vector network analyzer. In the high power mode or filter mode required in the test, click [Channel] >...
- Page 302 Linearity of Port Output Power 11.2.8. 11.2.8.1. Items of Test of Port Output Power Linearity Test the port output power linearity indicators of S3602 series vector network analyzers. 11.2.8.2. Instrument and Accessories for Test of Port Output Power Linearity 1) Soft test cable Agilent 85131F (AV3602A/B) or FE0BN0BM025.0 (AV3602C/D)
- Page 303 As shown in Fig. 11.7, connect the system and preheat is for 60min at least. Click [Reset] to set the S3602 series vector network analyzer into the initial state. Click [Power] > [-5] and the ENTER key. Press [Sweep] > [Sweep time] > [10] and the ENTER key.
- Page 304 As shown in Fig. 11.8, connect the system and preheat is for 60min at least. Click [Reset] and set the S3602 series vector network analyzer into the initial state. Click [Power] > [+20] and press the ENTER key. Click [Channel] > [Hardware configuration] >[Path configuration]. Select the high power mode for the low-band...
- Page 305 Tel: 886.2.2175 2930 Email: sales@salukitec.com www.salukitec.com Click [Measurement] > [S12]. Click [Scale] > [Reference value] and enter -100. Click [Sweep] > [Number of sweep points], and enter 101. Click [Response] > [Average] > [Intermediate frequency bandwidth], and enter 1Hz. Click [Calibration] > [Non-guided calibration] and [Through type response and isolation]. Click [Selection of calibration kit] >...
- Page 306 Effective Direction and Effective Load Matching Turn on the instrument and preheat for 60min at least. Press [Reset] to set the S3602 series vector network analyzer into the initial state. Press [Stimulus] > [Power] > [-5] and press [ENTER] key.
- Page 307 Tel: 886.2.2175 2930 Email: sales@salukitec.com www.salukitec.com Fig. 11.12 Block Diagram I of Connection of Full 2-port Calibration Repeat Step 8 to do the short and Load calibration for Port 1. 10) Repeat Step 8, 9 to do the SOL calibration for Port 2. 11) When single port calibration is done, connect the system as shown in Fig 2.
- Page 308 Tel: 886.2.2175 2930 Email: sales@salukitec.com www.salukitec.com Test of transmission tracking of Port 1 Click [Measurement] > [S12]. Select [Marker search],change frequency span. Search “Maximum" and “Minimum" in the set span. The larger absolute value is the transmission tracking value of Port 1 of this span. Repeat step 2 and complete the test for full frequency range of the instrument.
- Page 309 Tel: 886.2.2175 2930 Email: sales@salukitec.com www.salukitec.com of the test port 1 is the difference of the obtained marker value minus 6 Repeat step 3 and complete the test for full frequency range of the instrument. Test of effective direction of Port 1 Connect the load standard to the test port 1 via test cable.
- Page 310 Test of Pulse Modulation Rising/Falling Time 11.2.13. 11.2.13.1. Items of Test of Pulse Modulation Rising/Falling Time Test the pulse modulation rising/falling time indicators of S3602 series vector network analyzers 11.2.13.2. Instrument and Accessories for Test of Pulse Modulation Rising/Falling Time Power meter...
- Page 311 > [Source modulation] (interval: 150ns; pulse duration: 60ns; IF gate: 60ns) > [Pulse mode on/off] > [Calculate] > [Apply] to enable the pulse mode. Change the frequency of the S3602 series vector network analyzer and the peak power meter. Repeat Step (4) to (5). Read the measurement result of the peak power meter.
- Page 312 Tel: 886.2.2175 2930 Email: sales@salukitec.com www.salukitec.com Click [Macro] > [Pulse] > [Configuration] > [Pulse generator/modulator]. Select not to use the internal modulator. Click [Pulse mode] > [Calculate] > [Apply] to enable the pulse mode of the analyzer. As no external pulse signal is connected, the equivalent input signal is low, and the instrument works in the “Pulse OFF"...
Need help?
Do you have a question about the S3602 Series and is the answer not in the manual?
Questions and answers