
Related Manuals for Hioki LR8432-20


Summary of Contents for Hioki LR8432-20
- Page 1 LR8432-20 Instruction Manual HEAT FLOW LOGGER Jan. 2016 Edition 1 LR8432B980-00 16-01H...
-
Page 3: Table Of Contents
Contents Contents Introduction ................1 Confirming Package Contents ..........2 Safety Information..............4 Operating Precautions.............8 Chapter 1 Overview ____________________________________15 Product Overview and Features ......15 Measurement Flow ..........16 Names and Functions of Parts .......18 Screen Configurations ..........20 Basic Operation ............23 Screen Operations ............23 ... - Page 4 Contents Chapter 3 Setting before Measurement _______________ 43 Pre-Operation Inspection ........43 Operating Flow Overview ........44 Setting Configuration 1 – Recording Settings ..48 Specify the Recording Interval ......... 48 Setting the Display Time Base (horizontal axis magnification, set as needed) ....49 ...
- Page 5 Contents Chapter 4 Specifying Criteria for Measurements (Triggering, Alarm and Timer) ______________81 Setting Criteria to Start and Stop Recording ..82 Setting the Input Signal Trigger Threshold (Level Trigger) 83 Setting Lower and Upper Trigger Thresholds (Window Trigger) ..............85 ...
- Page 6 Contents USB flash drive Insertion & Removal ......112 Formatting a CF Card/USB flash drive ......113 Saving Data ............114 Automatic Saving ............115 Selecting the Manual Saving Method [Quick Save]/[Select & Save] ......... 116 ...
- Page 7 Contents Setting the Waveform Display Color ......144 Setting the Display Format ..........144 Setting the Display Range in the Vertical Axis Direction Using Upper/Lower Limit Values ........144 Waveform Calculation Formula ......145 Chapter 8 System Environment Settings ____________ 147 Screen and Key Operation Settings ....148 ...
- Page 8 Contents Chapter 11 Maintenance and Service _________________ 175 11.1 Troubleshooting ........... 175 11.2 Cleaning ..............178 11.3 Disposing of the Instrument ........ 179 Appendix____________________________________ A1 Appendix 1 Error Messages and Remedial Actions ..A1 Appendix 2 File Naming ............A7 Appendix 3 Text File (CSV) Internal Format ......A9 Appendix 4 Binary File Size Calculation......A10 Appendix 5 List of Default Settings........A11 Appendix 6 Maximum Recordable Time ......A12...
-
Page 9: Contents
Introduction Introduction Thank you for purchasing the HIOKI “Model LR8432-20 Heat Flow Logger.” To obtain maximum performance from the instrument, please read this manual carefully, and keep it handy for future reference. Registered trademarks ® • Windows is a registered trademark of Microsoft Corporation in the United States and other countries. -
Page 10: Confirming Package Contents
The latest version can be (p. 33) downloaded from our web site. About options: Contact your authorized Hioki distributor or reseller for details. Model 9780 Battery Pack Model 9809 Protection Sheet Model Z1005 AC Adapter Z2012 Heat Flow Sensor ... - Page 11 Confirming Package Contents Applying any excessive force to the Heat Flow Sensor can damage the sensor. When transporting the Heat Flow Sensor in a case, store the sensor in the pocket of the 9782 Carrying Case. Do not store the Heat Flow Sensor in the 9812 Soft Case.
-
Page 12: Safety Information
Safety Information Safety Information This instrument is designed to conform to IEC 61010 Safety Stan- dards, and has been thoroughly tested for safety prior to shipment. However, using the instrument in a way not described in this man- ual may negate the provided safety features. Before using the instrument, be certain to carefully read the follow- ing safety notes: Mishandling during use could result in injury or death, as well... - Page 13 Safety Information Notation In this document, the risk seriousness and the hazard levels are classified as fol- lows. Indicates an imminently hazardous situation that will result in death or serious injury to the operator. Indicates a potentially hazardous situation that may result in death or serious injury to the operator.
- Page 14 Safety Information Accuracy We define measurement tolerances in terms of f.s. (full scale), rdg. (reading) and dgt. (digit) values, with the following meanings: (maximum display value or scale length) f.s. The maximum displayable value or scale length. This is usually the name of the cur- rently selected range.
- Page 15 Safety Information Difference between “Measurement” and “Recording” The measurement and recording processes are distinguished as follows for the purposes of these instructions. The acquisition of input values into the instrument’s internal memory or to Measurement: a PC via communications. Storing measurement data on a CF card, USB flash drive or on a PC via Recording: data communication.
-
Page 16: Operating Precautions
• Before using the instrument, make sure that the insulation on the cables is undam- aged and that no bare conductors are improperly exposed. Using the instrument in such conditions could cause an electric shock, so contact your authorized Hioki distributor or reseller for replacements. - Page 17 Operating Precautions Installation Precautions • If the instrument is used in any state other than the following, the measurement accuracy may not satisfy the device specifications. Horizontal placement Upright placement • Leave sufficient space around the ventilation holes and install the instrument with the holes unobstructed.
- Page 18 Before Turning Power On Using the Battery Pack • For battery operation, use only the HIOKI Model 9780 Battery Pack. We do not take any responsibility for accidents or damage related to the use of any other batteries.
- Page 19 Hioki distributor or reseller for inspection. IMPORTANT Select Hioki 9641 Connection Cable for use as a cable for the pulse input connector. The waveform for an open channel may sometimes appear to be influenced by the signals of the other channels being measured.
- Page 20 • Keep discs inside a protective case and do not expose to direct sunlight, high temperature, or high humidity. • Hioki is not liable for any issues your computer system experi- ences in the course of using this disc.” Using a CF Card/USB flash drive •...
- Page 21 • Although real-time saving to USB flash drive is supported, a CF card is recommended for data preservation. Performance cannot be guaranteed when using storage media other than a Hioki-specified CF card option. • Use a USB flash drive whose continuous current consumption does not exceed 300 mA (peak 500 mA).
- Page 22 Operating Precautions...
-
Page 23: Chapter 1 Overview
Chapter 1 Overview 1.1 Product Overview and Features The Hioki LR8432-20 Heat Flow Logger is a compact, lightweight, easy-to- operate waveform recorder. It can run on batteries, and can be quickly deployed when a power anomaly occurs. Measurement data can be monitored, subjected to calculations and analyzed on a personal computer using the supplied application program. -
Page 24: Measurement Flow
1.2 Measurement Flow 1.2 Measurement Flow Installing, Connecting and Turning On Install the Battery Pack (option) (p. 28) Connect to the Model LR8432-20 (p. 27), and Set Up (p. 9) AC adapter connection (p. 33) Measurement cables connections To save data, insert a (p. - Page 25 1.2 Measurement Flow Configure Input Channels (p. 44) Select input channels, and set input types and measurement ranges. Make other settings as desired. Move to a Open the Select Apply setting item setting options Starting and Stopping Measurement Press the START/STOP Key (p. 24) Record once, and stop.
-
Page 26: Names And Functions Of Parts
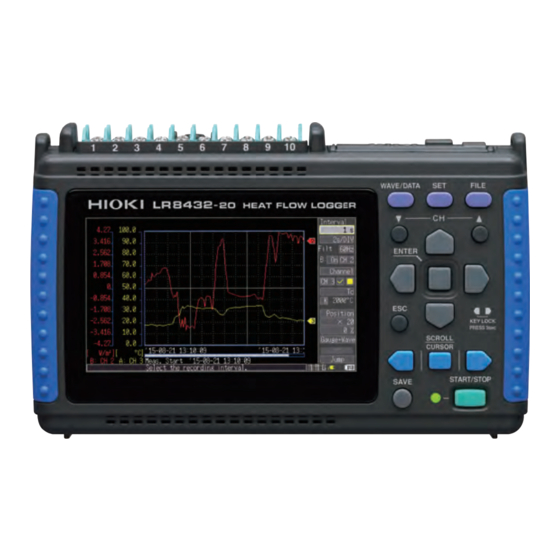
1.3 Names and Functions of Parts 1.3 Names and Functions of Parts Front Panel Rear Panel Manufacturer’s Serial No. Display Screen (p. 97) Shows the serial number. 4.3-inch TFT color LCD Do not remove this label, as it is required Screen Configurations (p. - Page 27 1.3 Names and Functions of Parts Top Panel CF Card Slot Insert an optional CF card. (p. 111) AC Adapter Socket Analog Input Terminals Connect the supplied Model Connect measurement leads for voltage mea- Z1005 AC Adapter (p. 33). surement, and thermocouples for temperature :(p.
-
Page 28: Screen Configurations
1.4 Screen Configurations 1.4 Screen Configurations Waveform/Numerical Screens Selects between seven display types. The screen switches [Wave] Screen [Gauge+Wave] Screen each time you press Measurement data is displayed Measurement data is displayed the key. as waveforms with gauges (p. as waveforms (p. 97). 100). - Page 29 1.4 Screen Configurations Icons (Commonly used on all of the screens) USB source indicator Indicates the USB status. USB flash drive inserted in USB Memory mode. Operating in USB Communication mode. CF card Displayed when a CF card is inserted. The icon appears red when accessing the card.
- Page 30 1.4 Screen Configurations Settings Screens Selects between seven display types. The screen switch- es each time you [Setting] Screen [CH] Screen press the key. Make settings for recording (p. Make input channel settings 48). Set numerical calculation, while viewing the monitor dis- Operational infor- auto-saving and timers.
-
Page 31: Basic Operation
1.5 Basic Operation 1.5 Basic Operation Screen Operations Changing screen contents Select the item to change. Show available Setting Screen setting options. Select the desired setting. Apply the new setting, or cancel it. Waveform Screen Scrolling a waveform Later Earlier “Scrolling Waveforms”... -
Page 32: Starting And Stopping Recording
1.5 Basic Operation Starting and Stopping Recording Acquire measurement data on the instrument, and start recording. When recording stops depends on data recording settings (repeat recording, triggering, timers, etc.). (p. 94) When you want measurement data to be automatically saved, before starting recording, check that auto-save is enabled (p. -
Page 33: Disabling Key Operations (Key-Lock Function)
1.5 Basic Operation Disabling Key Operations (Key-Lock Function) Keys can be disabled to avoid inadvertent operations. Press and hold the right and left cursor keys for three seconds to lock the other keys, and repeat to unlock. Saving Data Measurement data, settings, screen images and numerical calculation results can be saved. -
Page 34: Verifying The Input Level (Level Monitor)
1.5 Basic Operation Verifying the Input Level (Level Monitor) You can verify the input status and display range while making settings on the Setting screen. This is not available while measuring. Displayable Waveform Range Level Monitor This is determined by the waveform display range setting. -
Page 35: Measurement Preparations
Voltage measurement: Connect the measurement leads. Temperature measurement: Connect thermocouples. Heat flow measurement: Connect the Heat Flow Sensor. Pulse signals: Connect the Hioki 9641 Connection Cable Connect the AC adapter (p. 33) External control signal (To save data) inputs Insert a CF card or USB flash External control signal drive (p. -
Page 36: Using The Battery Pack (Option)
If you have lost the screw (special screw dedicated for this model) or find that the screw is damaged, please contact your Hioki distributor for a replacement. - Page 37 • If the battery packs fails to complete charging within the stipu- lated time, disconnect the AC adapter from the pack to stop charging. • Contact your authorized Hioki distributor or reseller should liquid leaks, strange odor, heat, discoloration, deformation and other abnormal conditions occur during use, charging or storage.
- Page 38 2.1 Using the Battery Pack (Option) • The battery pack is subject to self-discharge. Be sure to charge the battery pack before initial use. If the battery capacity remains very low after correct recharging, the useful battery life is at an end.
- Page 39 2.1 Using the Battery Pack (Option) When to charge When powering the instrument from the battery pack without the Model Z1005 AC Adapter, the low battery icon ( ) is displayed when the battery charge is depleted, indicating that the battery pack requires charging. Note that if the instrument is turned off under this situation, waveform data may fail to be backed up, and could be lost.
-
Page 40: Install The Battery Pack
2.1 Using the Battery Pack (Option) Install the Battery Pack Required tool: Important One Phillips screwdriver (No.2) Disconnect the AC adapter when installing the battery pack. Battery Compartment Cover Make sure that the Be sure to properly cables are not seat the connectors. -
Page 41: Connecting The Ac Adapter
2.2 Connecting the AC Adapter 2.2 Connecting the AC Adapter Connect the power cord and the instrument to the supplied Model Z1005 AC Adapter, then plug the power cord into an outlet. When used with the battery pack installed, the battery serves as an operating backup supply in case of power failure, and the AC adapter otherwise has priority. -
Page 42: Connecting Measurement Cables To The Instrument
Please ensure that a voltage beyond specification, espe- cially a surge such as a lightning, is never applied. When an abnormal measurement value is observed, please contact your authorized Hioki distributor or reseller for inspection. -
Page 43: 2.3 Connecting Measurement Cables To The Instrument
2.3 Connecting Measurement Cables to the Instrument • Measurements may be affected by noise or other electromag- netic ingress if input leads are longer than about three meters. • Route measurement leads and cables as far away as possible from power and earth lines. •... -
Page 44: Connecting Measurement Leads Or Thermocouples (For Voltage Or Temperature, Respectively)
2.3 Connecting Measurement Cables to the Instrument Connecting Measurement Leads or Thermocouples (for voltage or temperature, respectively) Connect the voltage and temperature measurement (thermocouple) leads to the analog input terminals. Tools required: Phillips screwdriver (for M3 screws) Analog Input Terminals Connect to the measurement object. -
Page 45: Connect The Heat Flow Sensor (Heat Flow Measurement)
2.3 Connecting Measurement Cables to the Instrument Connect the Heat Flow Sensor (Heat flow measurement) Connect the Heat Flow Sensor to the analog input terminal. Tools required: Phillips screwdriver (for M3 screws) For Heat Flow Sensor Models Z2012, Z2013, Z2014, Z2015, Analog Input Terminals Z2016, Z2017 Red (+) - Page 46 (maximum input voltage: 0 V to 10 V) indicated in the speci- fications. Damage or heating of the instrument could cause personal injury. For safety, we recommend using only Hioki’s connection cable (measurement lead cable). P1 White (H) Ends of the...
-
Page 47: Connecting The Optional Model 9641 Connection Cable (For Pulse Signal Input)
2.3 Connecting Measurement Cables to the Instrument Connecting the Optional Model 9641 Connection Cable (for Pulse Signal Input) Connect the optional 9641 connection cable to the pulse input connector. Pulse Input Connector Connect the other end of the cable to the pulse source(s) to be mea- sured. -
Page 48: Turning The Power On And Off
2.4 Turning the Power On and Off 2.4 Turning the Power On and Off Using the AC Adapter Before turning the instrument on, make sure the supply volt- age matches that indicated on its power connector. Connec- tion to an improper supply voltage may damage the instrument and present an electrical hazard. -
Page 49: Zero Adjustment
2.5 Zero Adjustment 2.5 Zero Adjustment Zero adjustment corrects for voltage offset at the input terminals, so that the relative potential of the instrument is zero volts. Perform the zero adjustment procedure when using the instrument in a loca- tion where the ambient temperature is markedly different. Turn on the power and wait for 30 minutes to stabilize the internal temperature of the instrument. - Page 50 2.5 Zero Adjustment...
-
Page 51: Setting Before Measurement
3.1 Pre-Operation Inspection Before using the instrument the first time, verify that it operates normally to ensure that the no damage occurred during storage or shipping. If you find any damage, contact your authorized Hioki distributor or reseller. Peripheral Device Inspection Metal... -
Page 52: Operating Flow Overview
3.2 Operating Flow Overview 3.2 Operating Flow Overview Connect Connect measurement cables (p. 34). Configure Display the Setting screen Reload stored Configure measurement settings settings (p. 121) Configure data recording settings (p. 48) [Setting] screen (as needed) [Setting] screen Configure data Configure input channels (p. - Page 53 3.2 Operating Flow Overview Measurement Configuration (Setting Screen) Before measuring, configure the measurement settings on the [Setting] [CH] screens. A brief operational description of the currently selected (high- lighted) setting item appears at the bottom of the screen. Three recording methods are available. Timed recording, which record between specified start and stop times, can be used in combination with these methods (p.
- Page 54 3.2 Operating Flow Overview Configure input channel settings: [CH] screen Make other settings as needed. Input Channel Settings Entering channel comments (p. 72) Voltage measurement (p. 58) Selecting channel display colors (p. 66) Temperature measurement Setting the display range (p.
- Page 55 3.2 Operating Flow Overview Measurement Configuration (Waveform Screen) Certain setting items are available on the Waveform screen. Setting details are the same as for those on the Setting screen. Horizontal Axis Settings Specify the recording interval (data acquisition interval) (p. 48) ...
-
Page 56: Setting Configuration 1 - Recording Settings
3.3 Setting Configuration 1 – Recording Settings 3.3 Setting Configuration 1 – Recording Settings Configure the horizontal axis and recording settings on the [Setting] screen. To save data while measuring, auto save must be enabled beforehand (p. 53). Select the [Setting] screen. -
Page 57: Setting The Display Time Base (Horizontal Axis Magnification, Set As Needed)
3.3 Setting Configuration 1 – Recording Settings Setting the Display Time Base (horizontal axis magnification, set as needed) Displayed waveforms can be expanded or compressed along the horizontal axis. Shorter setting values corre- spond to greater magnification. This setting can be changed both during and after measurement without affecting acquired data (p. - Page 58 3.3 Setting Configuration 1 – Recording Settings Available display time base settings depend on the selected recording interval. Horizontal axis display options are affected when the recording interval is changed after measuring, because the options for expanding (or compressing) the displayed axis depend on the recording interval used when measuring.
-
Page 59: Selecting The Recording Start/Stop Method
3.3 Setting Configuration 1 – Recording Settings Selecting the Recording Start/stop Method Specify how you want recording to start and Start Stop Measurement Measurement stop. The following methods are available. Continuous • Record continuously: Recording Record continuously between starting and stop- ping measurement. -
Page 60: Set The Recording Length For Repeated Or One-Time Recording
3.3 Setting Configuration 1 – Recording Settings Set the Recording Length for Repeated or One-time Recording Select whether recording should be resumed Repeated recording after the specified recording length has elapsed or after recording is stopped by a “stop trigger” event. Select from the setting options. -
Page 61: Automatic Saving
3.3 Setting Configuration 1 – Recording Settings Automatic Saving Measurement data can be automatically saved to a CF card or USB flash drive while measuring. The available types and formats of automatically saved data are as follows. Saved File Setting Description Content Extension... - Page 62 3.3 Setting Configuration 1 – Recording Settings Select which content to save from the [Auto settings. Save] Setting options: Off*, Waveform(realtime), CSV(re- altime), Calc(post meas.), Waveform + Calc, + Calc (∗ default setting) (As needed) You can enter a file name for the waveform files in the [File Name] box.
-
Page 63: Replacing Removable Storage During Real-Time Saving
3.3 Setting Configuration 1 – Recording Settings Replacing Removable Storage During Real-Time Saving During real-time saving, removable storage can be replaced without interrupting mea- surement. This procedure describes replacing a USB flash drive. Move the cursor to [EJECT]. Right bottom of the screen Execute Move the cursor to [Unmount USB... -
Page 64: Setting Configuration 2 - Input Channel Settings
3.4 Setting Configuration 2 – Input Channel Settings 3.4 Setting Configuration 2 – Input Channel Settings Configure the input channel settings on the [CH] screen. You can make these settings while viewing input signal amplitude on the level monitor. There are two general types of input signals, analog channels CH1 – CH10 and pulse channels P1 to P4. - Page 65 3.4 Setting Configuration 2 – Input Channel Settings Select the [CH] screen. Move to a setting item. Open the setting options for the item to be set. Select from the listed op- tions. Apply Level monitor (p. 26) CH / Use the keys to change the selected channel.
-
Page 66: Voltage Measurement Settings
If the Allowable Measurement Range of each Range is Significantly Exceeded “OVER” or “-OVER” is displayed for the numerical value or cursor value and the calcu- lated value or saved data is handled as a full scale value. Refer to “LR8432-20 Measurement Values” (p. A13). -
Page 67: Temperature Measurement Settings
3.4 Setting Configuration 2 – Input Channel Settings Temperature Measurement Settings Configure these settings for each temperature measurement channel. Select a channel ( ) for the CH 1 CH 10 : On setting contents. [Channel] : Off To enable measurement on the channel, select On to display the check mark ( Select for the... - Page 68 If the allowable measurement range of each range is significantly -1000 exceeded, “OVER” or “-OVER” is displayed for the numerical val- ue or cursor value and the calculated value or saved data is han- dled as a full scale value. Refer to “LR8432-20 Measurement Values” (p. A13).
-
Page 69: Heat Flow Measurement Settings
3.4 Setting Configuration 2 – Input Channel Settings Heat Flow Measurement Settings Configure these settings for each heat flow measurement channel when mea- suring heat flow using heat flow sensors. Select a channel (CH 1 to CH 10) for the : ON [Channel] setting contents. - Page 70 "OVER" or "-OVER" is displayed for the numerical value or cursor value and the cal- culated value or saved data is handled as a full scale value. Refer to “ LR8432-20 Measurement Values” (p. A13). Refer to “Appendix 12 Heat Flow” (p. A42) for information about heat flow.
-
Page 71: Integration (Count) Measurement Settings
Refer to “LR8432-20 Measurement Values” (p. A13). • When using the scaling function, the integrated pulse count can be displayed after conversion to the measurement target’s prop- erty (Wh, VA, etc.). -
Page 72: Revolution Measurement Settings
3.4 Setting Configuration 2 – Input Channel Settings Revolution Measurement Settings Configure these settings for each pulse channel on which you will be counting pulses corresponding to revolutions, such as output from a rotary encoder or tachometer. The revolution measurement is obtained by counting the number of pulses input per second. - Page 73 If the allowable measurement range of each range is significantly exceeded, “OVER” or “-OVER” is displayed for the numerical value or cursor value and the calculated value or saved data is handled as a full scale value. Refer to “LR8432-20 Measurement Values” (p. A13).
-
Page 74: Display Settings
3.5 Display Settings 3.5 Display Settings Configure how each channel is displayed, as needed. These settings can be changed on the Waveform/Numerical screen after measurement. Selecting Waveform Display Color A waveform display color can be set for each input channel. The color can be changed in [CH], [Range], and Waveform/Numerical screen. -
Page 75: Specifying The Vertical Display Range By Upper And Lower Limits (Expansion/Compression)
3.5 Display Settings Select for the setting options. [Pos] [Type] Select from the setting options. [Zoom] Setting options: x100, x50, x20, x10, x5, x2, x1∗, x1/2 Change by 1 (∗ default setting) Set the desired zero position as a [0 pos] The expansion/com- percentage of screen height. - Page 76 3.5 Display Settings As the upper and lower limits in the 1-5V range are fixed, they cannot be changed. Select for the setting item. [Up/Lwr] [Type] Specify the value for the top of the [Upper] display. In the same way, specify the value [Lower] for the bottom of the display.
-
Page 77: Converting Units (Scaling Function)
3.5 Display Settings Converting Units (Scaling function) Use the scaling function to convert input voltage to the physical units of the measure- ment parameter for display, such to convert voltage input for display as electrical current. Normal Display Scaling Enabled Converted values can be displayed in fixed- (Off) or floating-point notation. - Page 78 3.5 Display Settings Conversion Ratio Setting Method 2-Point Setting Method :High value Example Units (eu) :Converted Units: [A] high value Slope (Conversion → Param 1:V value value :Low value ratio: eu/v) → Param 2:V : Converted value value Offset low value Converted unit values Actual measurement values (input values) Combining scaling and display positioning (upper/lower limits)
- Page 79 3.5 Display Settings Setting Pulse Channel (Integration) Scaling Integrated pulse values can be converted for display as physical units of the mea- surement parameter (such as Wh or VA). Pulse output devices determine the amplitude per pulse in physical units, or the num- ber of pulses per fundamental unit (for example, per kWh, liter or m For the (condition) setting, select the...
-
Page 80: Entering Comments
3.6 Entering Comments 3.6 Entering Comments Comments of up to 40 characters can be entered as a title for the measure- ment data, and as a label for each input waveform. Titles and comments are displayed on the waveform screen (Comments appear only when [Value+Cmnt] display is selected. - Page 81 3.6 Entering Comments Operating Panel Only the keys displayed on the operating panel are en- abled. • List (WAVE/DATA key) Measurement related terms are registered in the list beforehand. • Hist (History, key) You can select previously entered terms from the pick list.
-
Page 82: Viewing All Channel Settings In A List
3.7 Viewing All Channel Settings in a List 3.7 Viewing All Channel Settings in a List All channel settings can be viewed and changed in the list. You can copy batches of settings between channels. [Range] screen [Conv/Calc] screen Input Types : Voltage, : Temperature, : Heat flow,... -
Page 83: Switching Channel Display Settings
3.7 Viewing All Channel Settings in a List Switching Channel Display Settings The list display settings can be switched to analog channel, pulse, alarm dis- play, or waveform calculation display. Select the screen to switch the display. [Range], [Conv/Calc], [Trig & Alm], [Comment] Select... -
Page 84: Batch Copying Channel Settings
3.7 Viewing All Channel Settings in a List Batch Copying Channel Settings The CH 1, P 1, and W 1 channel settings can be copied to other channels. Select the screen showing the channel to copy. [Range], [Conv/Calc], [Trig & Alm] Select [Proc]. -
Page 85: Batch Setting Waveform Display/Hide And Waveform Color Settings For All Channels
3.7 Viewing All Channel Settings in a List Batch Setting Waveform Display/Hide and Waveform Color Set- tings for All Channels The display of all waveforms can be hidden, and all waveform display colors can be set to defaults. This setting is only available on the [Range] screen. -
Page 86: Aligning Zero Positions On The Grid
3.7 Viewing All Channel Settings in a List Aligning Zero Positions on the Grid Analog channel waveforms can be positioned evenly along the vertical grid, with CH1 at the top. ([Range] screen only) This functionality is valid only for channels with the same input time as CH1 and for which [Display range] has been set to... -
Page 87: Display Celsius (°C) Temperature Values As Fahrenheit (°F)
3.7 Viewing All Channel Settings in a List Display Celsius (°C) temperature values as Fahrenheit (°F) All measured temperature values can be converted at once from Celsius to Fahrenheit units. The conversion is simultaneously reflected appropriately on all scaled values. To revert from Fahrenheit units to Celsius, disable (set to Off) the scaling func- tion (p. - Page 88 3.7 Viewing All Channel Settings in a List...
-
Page 89: Specifying Criteria For Measurements (Triggering, Alarm And Timer)
Specifying Criteria for Measurements (Triggering, Chapter 4 Alarm and Timer) You can set recording to start and stop under specific criteria (start/stop triggers), and to output alarm signals. You can also set specific times to start and stop record- ing, using the Timer function. Triggering is the process of controlling the start and stop of Trigger criteria met recording by specific signals or conditions (criteria). -
Page 90: Setting Criteria To Start And Stop Recording
4.1 Setting Criteria to Start and Stop Recording 4.1 Setting Criteria to Start and Stop Record- There are two ways to set the criteria to start and stop recording according to waveform slope. Select whether to trigger at the rising or falling edge of the input signal. Type of Analog Trigger Trigger Example Description Level Trigger... -
Page 91: Setting The Input Signal Trigger Threshold (Level Trigger)
4.1 Setting Criteria to Start and Stop Recording Select the [CH] screen. Move to a setting item. Open the setting options for the item to be set. Select from the listed options. Apply Setting the Input Signal Trigger Threshold (Level Trigger) Enter the signal level threshold at which to start or stop recording, and whether triggering occurs on the upslope or downslope of the input signal. - Page 92 4.1 Setting Criteria to Start and Stop Recording Level Setting Ranges and Resolution Channels Input type Range Resolution Channels Input type Range Resolution μ −− 10 mV Count CH1 - P1 - P4 μ −− CH10 100 mV Revolve 1 r/s μ...
-
Page 93: Setting Lower And Upper Trigger Thresholds (Window Trigger)
4.1 Setting Criteria to Start and Stop Recording Setting Lower and Upper Trigger Thresholds (Window Trigger) An input signal level “window” within which recording will (or will not) occur can be defined by upper and lower threshold levels. You can select whether record- ing starts or stops when the input signal level enters (In) or exits (Out) of this window. -
Page 94: Selecting Trigger Sources And Combinations
4.1 Setting Criteria to Start and Stop Recording Selecting Trigger Sources and Combinations Enable the trigger function (set to On), select recording start/stop timing, and set trigger criteria. Triggering is affected only by those channels for which trig- ger criteria have been set. Make these settings on the [Trig &... -
Page 95: Setting Criteria For Pre-Trigger Recording (Pre-Trig)
4.1 Setting Criteria to Start and Stop Recording Setting Criteria for Pre-Trigger Recording (Pre-Trig) Select the [Start] [Start&Stop] trigger timing set- ting to record waveforms both before and after trigger events. However, pre-trigger recording is disabled when [Stop] trigger timing is selected. Make the setting on the [Trig &... -
Page 96: Alarm Output
4.2 Alarm Output 4.2 Alarm Output You can enable beep tones and an alarm output signal (for external use) for each input channel by setting its alarm criteria. You can also view alarm output status on screens that display numerical values ([Wave+Value], [Value+Cmnt] [Value]). - Page 97 4.2 Alarm Output Select the [CH] screen. Configuring Alarm Output Select the [Channel] setting option to [ALM] : On Set a check mark as shown to enable : Off alarm output. Set the as required for your [Hold Alarm] alarm output destination device. Setting options:(∗...
- Page 98 4.2 Alarm Output Setting Alarm Criteria for Each Channel For the , select a channel for which you [Channel] want to set alarm criteria. Select to enable alarm criteria settings. [Alarm on.] Select the alarm criteria type from the [Cond] setting options.
-
Page 99: Confirming Trigger And Alarm Criteria Settings (List)
4.3 Confirming Trigger and Alarm Criteria Settings (List) 4.3 Confirming Trigger and Alarm Criteria Set- tings (List) You can view and change trigger and alarm criteria settings for all channels. However, detailed criteria settings such as level, threshold and slope can only be changed on the [CH] screen (p. -
Page 100: Starting And Stopping Recording By Timer
4.4 Starting and Stopping Recording by Timer 4.4 Starting and Stopping Recording by Timer Make these settings to record at a specific time. Recording can be set to repeat at specific intervals between the set start and stop times. Before setting, confirm that the instrument’s clock is set to the correct time. If not, reset the clock on the [System] screen (p. - Page 101 4.4 Starting and Stopping Recording by Timer Example: To record daily from 9:00 to 17:00 for one month beginning January 1, 2015, Repeat Recording: On, Timer: On (YY-M-D) (H:M:S) 15-1-1 15-1-1 15-1-2 9:00 17:00 9:00 (From) Start On 15-1-1 9: 0: 0 (Until) Stop 8 hours...
-
Page 102: About Recording Operation
4.5 About Recording Operation 4.5 About Recording Operation Recording operation depends on the combination of trigger, timer and repeat recording (On/Off) settings. Timer start/stop time Trigger criteria match Press START/STOP Trig- Repeat: Off Repeat: On Cont. Timer Recording time Recording time Recording Recording... - Page 103 4.5 About Recording Operation Timer start/stop time Trigger criteria match Press START/STOP Trig- Repeat: Off Repeat: On Cont. Timer Recording time Recording time Start Off Recording Recording Start recording Stop recording Start recording Stop recording Stop Recording Recording time time A stop trigger oc- Recording Recording...
- Page 104 4.5 About Recording Operation...
-
Page 105: Chapter 5 Waveform Analysis
Waveform Chapter 5 Analysis About the Waveform and Numerical Value Screens Measurement Trigger Mark Analog waveform, Configuration pulse waveform, Indicates a trigger event You can change alarm, waveform these settings (p. 47) calculation You can switch Displays acquired between channel data as waveforms. -
Page 106: Viewing Waveforms
5.1 Viewing Waveforms 5.1 Viewing Waveforms Scrolling Waveforms A waveform that is being measured or that has already been measured can be scrolled leftward and rightward using the keys. SCROLL/CURSOR Later Earlier You can scroll to any part of a waveform while mea- Screen Display suring. -
Page 107: Magnifying And Compressing Horizontally
5.1 Viewing Waveforms Magnifying and Compressing Horizontally Waveforms can be magnified (expanded or com- pressed) along the time axis by changing the time per horizontal division. Detailed waveform data is usually best observed with the time axis expanded, while longer-term trends are best observed with it compressed. -
Page 108: Selecting Display Options
5.2 Selecting Display Options 5.2 Selecting Display Options Displaying Gauges A gauge corresponding to the measurement range of each channel can be displayed at the left side of the screen, for confirming measurement values. The color of the gauge matches the waveform display color of its input channel. -
Page 109: Displaying Cursor Values
A/B cursors can be enabled for any channel. • Cursor values may be displayed as “OVER” or “-OVER” instead of numerical values. Refer to “LR8432-20 Measurement Values” (p. A13). • When there is no data over the specified cursor, the cursor value is displayed... - Page 110 5.2 Selecting Display Options There are two ways to display cursor values: displaying a list of values or dis- playing the values of only two channels. Cursor values in the list Cursor Select the waveform screen. The A/B cursors and the values are displayed.
-
Page 111: Specifying A Waveform Time Span
5.2 Selecting Display Options Specifying a Waveform Time Span Specify a waveform time span when saving a partial waveform or applying numerical calculations (Trace cursors or Vertical cursors). When [Switch to Calc] is selected, numerical calcula- tion can be performed while checking the A/B cursor. Refer to“Apply Calculations to a Specific Time Span (Manual Calculation Only)”... -
Page 112: Viewing Input Signals As Numerical Values
5.2 Selecting Display Options Viewing Input Signals as Numerical Values Numerical values can be displayed in three ways: numerical values only, waveforms and numerical values, and numerical values and comments. Displayed numerical values are those of the current input signals. With a link to the channel selected in the channel setting in this screen, the list of numerical values and comments is displayed as below. - Page 113 13 charac- ters are indicated by smaller display characters.) • Numerical values may be displayed as “OVER” or “-OVER”. “LR8432-20 Measurement Values” (p. A13). • When there is no data, the numerical value is displayed as “---”.
-
Page 114: Inserting Event Marks (Search Function)
5.3 Inserting Event Marks (Search Function) 5.3 Inserting Event Marks (Search Function) You can insert up to 100 event marks at any point while measuring, to help find them later. Refer to “Searching Event Marks” (p. 108). Event marks can be inserted while viewing waveforms or by applying external signals. -
Page 115: Inserting Event Marks Using External Input Signals
5.3 Inserting Event Marks (Search Function) Inserting Event Marks Using External Input Signals Event marks can be inserted by applying external input signals. Refer to Input signal specifications in section “9.2 External Trigger Input” (p. 159). Select the [System] screen. Select [External Trig In]. -
Page 116: Searching Event Marks
5.3 Inserting Event Marks (Search Function) Searching Event Marks Any event mark can be found by searching. Select the Waveform Screen. When [Channel] displayed, switch to [Event]. The event setting items are displayed. Apply For the [MoveNo.] setting, select the number of the event you want to find. -
Page 117: Saving & Loading Data
6.1 About Saving and Loading Data Saving & Chapter 6 Loading Data Measurement data acquired by the instrument can be saved to a CF card or USB flash drive. (p.111) The CF card is treated as Drive A:, while the USB flash drive is treated as Drive B:. - Page 118 6.1 About Saving and Loading Data *5. When opening a CSV file in a spreadsheet program, note that the number of rows that can be loaded at one time is limited (p. A7) When an option other than [Separator: Comma] has been selected on the [System] screen, the file extension will be .TXT rather than .CSV.
-
Page 119: Using A Cf Card/Usb Flash Drive
CF card for this purpose due to the supe- rior data protection offered by that media. Proper operation of media other than Hioki optional CF cards is not guaranteed. • USB flash drives with security functionality such as password or... -
Page 120: Cf Card Insertion & Removal
6.2 Using a CF Card/USB flash drive CF Card Insertion & Removal Inserting a CF card Cover Open the CF card slot cover. Press the Eject button in if it is in the released position. Face the CF card with the arrow mark () on top, and insert it in the direc- tion of the arrow all the way in the slot. -
Page 121: Formatting A Cf Card/Usb Flash Drive
6.2 Using a CF Card/USB flash drive Formatting a CF Card/USB flash drive The CF card or USB flash drive can be formatted with a computer or the instrument. Format a new CF card or USB flash drive before use. This procedure describes how to format a CF card or USB flash drive in the instrument. -
Page 122: Saving Data
A/B cursors. (Saving a waveform section is not available with Auto Save) To save a screen image, display the de- Save sired screen before saving. LR8431-20 and 8430-20 waveform data, display image, and setting data can be read by the LR8432-20. -
Page 123: Automatic Saving
6.3 Saving Data Automatic Saving Before measuring, configure saving on the [Setting] screen. Waveforms and numerical calculation results can be saved automatically. Folders are created for saved data according to data type, and files are automatically numbered (p.109). For waveform data, folders named with the current date (YY-MM-DD) are created auto- matically. -
Page 124: Selecting The Manual Saving Method [Quick Save]/[Select & Save]
6.3 Saving Data Selecting the Manual Saving Method [Quick Save]/[Select & Save] Two manual saving methods are available: [Quick Save] [Select & Save], both of which offer the same setting options. When saving measurement data, folders are created on the CF card or USB flash drive for each data type, and files are automatically numbered (p.109) Select the screen. -
Page 125: Saving Waveform Data (With The Save Key)
6.3 Saving Data Saving Waveform Data (with the SAVE Key) Waveform data is saved in files named WAVEnnnn.MEM in folders named with the date of recording (YY-MM-DD), created in the [HIOKI_LR8432]- [DATA] folder (p.109). To save a partial waveform, specify the time span to save beforehand (p.103). Select &... -
Page 126: Capturing A Screen Image (With The Save Key)
6.3 Saving Data Capturing a Screen Image (With the SAVE Key) Captured screen image files are automatically named SCRnnnnn.BMP in a folder named [HIOKI_LR8432]-[PICTURE] (p.109). Select & Save Quick Save Display the screen to capture, and press the key. SAVE (Select from the dialog that appears (Before pressing the SAVE... -
Page 127: Saving Numerical Calculation Results (With The Save Key)
6.3 Saving Data Saving Numerical Calculation Results (With the SAVE Key) Numerical calculation settings are necessary before saving results (p.131). Numerical calculation result files are automatically named MEASnnnn.CSV a folder named [HIOKI_LR8432]-[MEASUREMENT] (p.109). Select & Save Quick Save (Select from the dialog that appears (Before pressing the SAVE key, make... -
Page 128: Saving Setting Configurations
CF card or USB flash drive. Select the [Setting] screen. Select [Save Set.]. Apply The Save dialog appears. Select whether to save to the LR8432-20’s memory or to a CF card or USB flash drive. Apply [Memory] (When is selected) Select [Save] for the con- figuration instance (No.) -
Page 129: Loading Data On The Instrument
Select [Load Set.]. Apply The loading dialog appears. Select whether to load a set- ting configuration from LR8432-20’s memory or CF card or USB flash drive. Apply [Memory] (If you selected Select [Load] for the con- figuration you want to load. -
Page 130: Loading Waveform Data And Screen Images
6.4 Loading Data on the Instrument Loading Waveform Data and Screen Images Binary waveform data or captured screen images can be reloaded into the instrument. Select the File Screen. The contents of the CF card are displayed. Select a file to load Displays the child folder. -
Page 131: Data Management
6.5 Data Management 6.5 Data Management You can manage data stored on a CF card r USB flash drive in the instrument. • Load a file (when the file is selected) (p.121) • Move displayed folders (when the folder is selected) (p.124) •... -
Page 132: Viewing Folder Contents And The Parent Folder
6.5 Data Management Viewing Folder Contents and the Parent Folder Select the File Screen. The contents of the card are displayed. Select a folder to view. View child folder (view contents of the currently highlighted folder) (press the ENTER key and select [Change] in the displayed control dialog box) -
Page 133: Renaming Files And Folders
6.5 Data Management Renaming Files and Folders Folders and files on a CF card can or USB flash drive be renamed. File names may consist of up to 26 regular characters. Select the File Screen. The contents of the CF card are displayed. -
Page 134: Copying Data
6.5 Data Management Copying Data Files and folders can be copied between a CF card and USB flash drive. What if the file I want to copy is not displayed? Select the File Screen. Refer to“Switching removable storage” (p. 123). Refer to“Viewing Folder Contents and the Parent Folder”... -
Page 135: Sorting Files
6.5 Data Management Sorting Files Files can be sorted in ascending or descending order according to a selected sort key. Select the File Screen. Apply The control dialog box appears. Select [Sort]. Apply Select the key on which to sort. Apply Select the desired sort order. -
Page 136: Transferring Data To A Computer (Usb Drive Mode)
6.6 Transferring Data to a Computer (USB Drive Mode) 6.6 Transferring Data to a Computer (USB Drive Mode) Data saved to a CF card can be transferred to a computer using the supplied USB cable. Before connecting the USB cable to the instrument, set the USB mode on the [System] screen to [USB... -
Page 137: Connecting The Usb Cable
6.6 Transferring Data to a Computer (USB Drive Mode) Connecting the USB Cable ® ® ® ® Compatible OS: Windows XP, Windows Vista , Windows 7, Windows ® Windows • Do not eject the CF card or pull out the USB cable during data transfer. - Page 138 6.6 Transferring Data to a Computer (USB Drive Mode) To exit USB Drive Mode Click the Safely Remove Hardware ( ) icon in the Windows ® notification area. Click the appropriate line “Safely remove USB Mass Storage Device – Drive(H:)” where H is ®...
-
Page 139: Numerical/Waveform Calculations
7.1 Performing Numerical Calculation Numerical/Waveform Chapter 7 Calculations 7.1 Performing Numerical Calculation Calculations can be applied to measured data. Seven types of numerical calculation are available, four of which can be applied at the same time. Refer to “7.2 Numerical Value Calculation Expressions”... - Page 140 7.1 Performing Numerical Calculation Two methods are available for applying calculations, as follows. Calculating in real time during Calculating After Measuring measurement (Auto calculation) (Manual calculation) Configure numerical calculations before Configure numerical calculations after starting measurement. Calculations are per- measurement (p. 137). formed automatically after measurement (p.
-
Page 141: Key Operation During Setting
7.1 Performing Numerical Calculation Key Operation During Setting Select the [Setting] screen. Move the cursor to the item to be set. Open the setting options for the item to be set. Select from the listed op- tions. Apply... -
Page 142: Calculating Values In Real Time During Measurement (Automatic Calculation)
7.1 Performing Numerical Calculation Calculating values in real time during measurement (Automatic calculation) Numerical calculations are automatically performed in real time during measure- ments. Select [On]. Select a type of calculation. Setting options: ( ∗ default setting) Average, P-P, Maximum, Minimum, Time To Max, Time To Min, Sum, Off(No calculations performed) ∗... - Page 143 7.1 Performing Numerical Calculation Split Calc. is set to [On]. Split Calc. is set to [Ref Time]. Configure the split calculation setting. (Select [Close]. at the end.) Setting options: ( ∗ default setting) Off∗ Only the calculation value obtained last is saved. Calculation values obtained from the measurement start during regular time intervals ([Length]) are saved.
- Page 144 7.1 Performing Numerical Calculation Start the measurement. Select the [Wave+Calc] display on the Waveform screen. Numerical calculation results are displayed. The results of the se- lected calculation number are displayed. Via a link to the channel select- ed on this screen, the calcula- tion results are displayed in a list as below.
-
Page 145: Manual Calculation
7.1 Performing Numerical Calculation Manual Calculation Start and finish measuring. Select the Waveform Screen. You can select it from the [Setting] screen. Select [Wave+Calc] display. Enable (set to ) numerical [On] calculation. Select [Calc1] [Calc4] and move to the setting options. -
Page 146: Apply Calculations To A Specific Time Span (Manual Calculation Only)
7.1 Performing Numerical Calculation Apply Calculations to a Specific Time Span (Manual Calculation Only) After measuring, calculation can be applied to a specified time span. Make any other calculation settings before specifying the calculation time span (p. 137). Display A/B Cursors. Position the A/B cursors to define the calculation time span. -
Page 147: Numerical Value Calculation Expressions
7.2 Numerical Value Calculation Expressions 7.2 Numerical Value Calculation Expressions Obtains the average value of waveform data. ∑ Average AVE: Average value -- - n : Data count di : Data on channel number i Maximum Obtains the value of the difference value Peak Value (peak-to-peak value) between maxi-... - Page 148 7.2 Numerical Value Calculation Expressions Setting [Split Calc.] [On] [Ref Split time Time] saves the calculation value at a [On] When certain time interval. is selected When [On] is selected: Set [Length]. The calculation value for Split calcu- Measure- Measure- the specified time is automatically lation (at ment start...
-
Page 149: Performing Waveform Calculation
7.3 Performing Waveform Calculation 7.3 Performing Waveform Calculation Waveform calculation can be selected from Four operations, Sum, Average, Mov- average, or Heat flow rate. (CHA and CHB can be selected among the channels from CH1 to CH10, those from P1 to P4, and the calculation channels from W1 to W9 with a channel number that is smaller than the number of the calculation channel to be set. - Page 150 7.3 Performing Waveform Calculation : ON Select the channel (W1 to W10) : OFF and set the calculation to (ON). [calculation formula.] Select ENTER press the key. The coefficient settings dialog box is displayed. Select the calculation type and set necessary items. Calculation type Setting item ENTER...
- Page 151 7.3 Performing Waveform Calculation The calculation formula can be entered in the [Conv/Calc] screen. The W1 calculation formula can be copied to other channels. (p. 74) Select the [Conv/Calc] screen. Select [Calc]. Select the waveform calculation formula W1 to W10 for the channel ( The dialog box is displayed.
-
Page 152: Setting The Waveform Display Color
7.3 Performing Waveform Calculation Set the display method for waveform calculation channels as necessary. The display method can be changed even after measurement. Setting the Waveform Display Color A waveform display color can be set for each waveform calculation channel. Select from the waveform display color setting options. -
Page 153: Waveform Calculation Formula
7.4 Waveform Calculation Formula 7.4 Waveform Calculation Formula bi: The i-th piece of data of calculation results Waveform Description calculation type Moving average ∑ (i 1, 2, = − t i k dt: The t-th piece of data obtained through the source channel k: When the moving point number (1 to 1000) i is less than k, k = i. - Page 154 7.4 Waveform Calculation Formula...
-
Page 155: System Environment Settings
System Environment Chapter 8 Settings Settings affecting the clock, SAVE key operation and self testing are made from the System screen. Screen and Key Operation Settings Specify operating behavior when recovering from power outages (Start Backup) (p. 148) Set backlight power saving (p. -
Page 156: Screen And Key Operation Settings
8.1 Screen and Key Operation Settings 8.1 Screen and Key Operation Settings Select the [System] screen. Move to a setting item. Open the setting options for the item to be set. Select from the listed op- tions. Apply Using the Auto-Resume Function (Resume After Power Restoration) If a power outage or other power loss causes an interruption in recording (while the LED on the left side of the... -
Page 157: Enabling And Disabling The Backlight Saver
8.1 Screen and Key Operation Settings Enabling and Disabling the Backlight Saver A backlight saver can be activated after a specified number of minutes during which no operation key is pressed. The backlight saver turns off the backlight of the LCD, prolonging the lifetime of the backlight by turning it off when not needed. -
Page 158: Selecting The Horizontal (Time) Axis Display
8.1 Screen and Key Operation Settings Selecting the Horizontal (Time) Axis Display Select the display method for the horizontal axis at the bottom of the screen. 1d2h3m4s 12-07-01 12:10:30 Select from the [Time Disp] setting options. Setting options:( ∗ default setting): Time* Displays the time span from the start of measurement. -
Page 159: Csv File Saving Settings
8.2 CSV File Saving Settings 8.2 CSV File Saving Settings CSV File Data Decimal and Separator Characters Select from the [Decimal Mark] setting options. Setting options:( ∗ default setting) ∗ Select the period character. Comma Select the comma character. Select from the [Separator] setting options. -
Page 160: Making System Settings
8.3 Making System Settings Setting the Date and Time The LR8432-20 is equipped with an auto-calendar, automatic leap year detection, and a 24-hour clock. If the clock is not set to the correct time, measurement start time (trigger time) and file date information will be incorrect. -
Page 161: Initializing The Instrument (System Reset)
8.3 Making System Settings Initializing the Instrument (System Reset) This procedure resets all settings to their factory defaults. The system is reset by pressing and holding the START/STOP key while turning the instrument’s POWER switch on. For details about the factory default settings, Refer to “Appendix 5 List of Default Settings”... -
Page 162: Switching The Usb Mode
Type B USB Communication Logger Utility software from a com- puter (using a USB cable). Read files on a CF card that is con- nected to the LR8432-20 from a Type B USB Drive computer (using a USB cable). -
Page 163: Self-Test
8.3 Making System Settings Self-Test The following self tests are available. Results are displayed on the screen. If any faults are found, have the instrument repaired. Contact your authorized Hioki distributor or reseller. Select the [System] screen. Select the self test to... - Page 164 8.3 Making System Settings...
-
Page 165: Chapter 9 External Control
9.1 Connecting to the External Control Terminals External Chapter 9 Control The external control terminals on the instrument support trigger signal input and out- put. Top View ALARM (Output) A signal is output whenever the alarm (common with instrument ground) criteria are satisfied (p. - Page 166 9.1 Connecting to the External Control Terminals • Ground the instrument and computer using a common wiring. If the instrument and computer do not share the same earthing location, there will be a potential difference. Connecting a USB cable while there is a potential difference can cause a malfunc- tion or failure.
-
Page 167: External Trigger Input
9.2 External Trigger Input 9.2 External Trigger Input Triggering can be controlled by applying a signal from an external trigger source. This allows synchronous operation of multiple instruments by parallel triggering (p. 163). External signal input (EXT.TRIG) Trigger event occurs. Trigger Input Signals Voltage range HIGH level: 3.0 to 5.0 V, LOW level: 0 to 0.8 V... -
Page 168: External Signal Output (Trigger Output)
9.3 External Signal Output (Trigger Output) 9.3 External Signal Output (Trigger Output) You can output a signal when a trigger event occurs. This allows synchronous oper- ation of multiple instruments by parallel triggering (p. 163) Pulse wave is output. (TRIG.OUT) Trigger event occurs Trigger Output Signals Open collector output (with voltage output), active LOW... - Page 169 9.3 External Signal Output (Trigger Output) Signal Output Procedure Connect the external trigger signal destination For the connection and signal ground to external control termi- method (p. 158) nals 2 (TRIG.OUT) and 1 (GND), respectively. Press the key to open the [System] screen.
-
Page 170: Alarm Signal Output (Alarm Output)
9.4 Alarm Signal Output (Alarm Output) 9.4 Alarm Signal Output (Alarm Output) This signal is output when alarm criteria are satisfied. Specify the desired alarm criteria. Refer to “4.2 Alarm Output” (p. 88) Alarm signal output (ALARM) When alarm criteria are satisfied About the Alarm Output Signal Output signal Open-drain output (with voltage output), active LOW... -
Page 171: Synchronous Measurements With Multiple Instruments
9.5 Synchronous Measurements with Multiple Instruments 9.5 Synchronous Measurements with Multiple Instruments Multiple instruments can be synchronized with each others using the external control terminals. Parallel synchronization EXT.TRIG TRIG OUT Set one instrument to master, and set the others Master to slave. - Page 172 9.5 Synchronous Measurements with Multiple Instruments Set the slave instrument. Press the key to open the [System] screen. Set the External Trg In setting to Trigger Press the key to open the [Trig&Alm] screen. Set as follows. Trig Func: On Timing: Start Trig Source Start: OR Ext Trig Start: On...
-
Page 173: Chapter 10 Specifications
Humidity: 80% RH or less (no condensation) Guaranteed accura- 1 year cy period Guaranteed accura- 1 year cy period from adjust- ment made by Hioki Product warranty pe- 1 year riod Operating Indoors, Pollution degree 2, altitude up to 2000 m (6562 ft.) environment... - Page 174 Chapter 10 Specifications Basic Specifications Dielectric strength 350 V AC for 15 seconds (between each analog input channel and chassis, and between analog input channels) Power supply • Model Z1005 AC Adapter Rated supply voltage 100 V to 240 V AC (A voltage fluctuation of ±10% is taken into account for the rated power voltage.) Rated supply frequency 50 Hz/60 Hz...
- Page 175 Chapter 10 Specifications Display Section Display resolution Waveform: Max. 20 divisions (time axis) × 10 divisions (voltage ax- (1 division = 20 dots (time axis) × 20 dots (voltage axis)) (The number of displayed time axis divisions depends on the dis- play configuration.) Dot pitch 0.198 mm ×...
- Page 176 Chapter 10 Specifications USB flash drive • Setting configurations Storage contents • Measurement data (binary and csv format) (data between A-B cursors can be saved) • Screen images (bitmap format) • Calculation results Function not available when the USB external interface is in use. Usable device USB flash drive CF card...
- Page 177 Chapter 10 Specifications Measurement Input Section Measurement For the range, f.s. = 10 V • Voltage/heat flow: ±0.1% f.s. ( 1-5 V accuracy • Thermocouple: K, J, E, T: (-200 ° C or higher and less than -100 ° C) 1.5 °...
- Page 178 Chapter 10 Specifications with 100 Ω maximum signal source impedance Common mode rejection ratio 100 dB minimum (with 50 Hz or 60 Hz input and digital filter disabled) 140 dB minimum (with 50 Hz input with 5 s recording interval, and 50 Hz digital filter enabled) (with 60 Hz input with 2 s recording interval, and 60 Hz digital filter enabled)
- Page 179 Chapter 10 Specifications Basic Specifications Hybrid display • Simultaneous waveform and gauge display (Up to two gauges) configurations • Waveform display • Simultaneous waveform and numerical value display • Simultaneous numerical value and comment display • Numerical value display • Numerical calculation display (simultaneous calculation results and waveforms) •...
- Page 180 Chapter 10 Specifications Trigger Section Trigger output Open-collector output (with 5 V voltage output, active low) Pulse width: at least 10 ms You can choose to enable output at trigger activation only or at both trigger activation and measurement start. Trigger input and Push-button terminals output terminals...
- Page 181 Chapter 10 Specifications Miscellaneous Calculation result After measurement, the final calculation value is automatically auto save saved to a CF card or USB flash drive in a text format. Split calculation: The calculation value at a certain time interval is saved in a text for- mat in real time.
- Page 182 Chapter 10 Specifications Miscellaneous Real-time saving Saves real-time waveform data to CF card or USB flash drive in bi- nary or csv format Data recorded during each recording length can be save in a sep- arate file Overwriting save is available Up to 3.5 M data points in binary format can be loaded from a spec- ified point (using one analog channel) Power to the instrument must not be interrupted while data is being...
-
Page 183: Maintenance And Service
Replaceable Parts and Operating Lifetimes Useful life depends on the operating environment and frequency of use. Operation cannot be guaranteed beyond the following periods For replacement parts, contact your authorized Hioki distributor or reseller. Part Life LCD (to half Approx. - Page 184 Lithium Battery time deviate substantially when the instrument is switched on, it is the time to replace that battery. Contact your authorized Hioki distributor or reseller. The fuse is housed in the power unit of the instrument. If the power does not turn on, the fuse may be blown.
- Page 185 Customers should not at- be damaged. turn on. tempt to perform parts re- placement and repair. Contact your authorized Hioki distributor or re- seller for service. A waveform does • Is the “Waiting for pre-trigger” mes- When pre-triggering is sage displayed?
-
Page 186: Cleaning
(p.175) Please purchase a new battery pack. Please contact your authorized Hioki distributor or re- seller.If the instrument is not used for more than a month, please remove the battery pack for stor- age. -
Page 187: Disposing Of The Instrument
11.3 Disposing of the Instrument 11.3 Disposing of the Instrument The instrument contains a lithium battery for memory backup. When disposing of this instrument, remove the lithium battery and dispose of battery and instrument in accordance with local regulations. Removing the Lithium Battery •... - Page 188 11.3 Disposing of the Instrument CALIFORNIA, USA ONLY This product contains a CR Coin Lithium Battery which contains Perchlorate Material - special handling may apply. See www.dtsc.ca.gov/hazardouswaste/perchlorate...
-
Page 189: Appendix
Appendix 1 Error Messages and Remedial Actions Appendix Appendix 1 Error Messages and Remedial Actions Error messages consist of either “Error” or “Warning” displays. A screen message appears whenever an error occurs. In either case, take the remedial action indicated. Error Messages To clear an error message, press the ENTER... - Page 190 Appendix 1 Error Messages and Remedial Actions Message Remedial Action The entered numerical value is out of the valid Exceeding the setting range. range. Enter a valid value. When [Type] [Range] is selected, the mea- Measurement range was surement range is automatically changed to changed.
- Page 191 (not enough battery capacity). CF card or instrument may be broken. Contact your authorized Hioki distributor or reseller. The removal storage is not inserted, or does not have enough free space.
- Page 192 PC. If the error persists, try a different remov- File system error able storage. If this error occurs while using a good remov- (incompleted information). able storage, the instrument may be damaged, in which case contact your authorized Hioki dis- tributor or reseller.
- Page 193 If this error occurs while using a good remov- (failed to recognize the format). able storage, the instrument may be damaged, in which case contact your authorized Hioki dis- tributor or reseller. The number of files to be processed exceeds File system error the limit, so processing cannot be performed.
- Page 194 Appendix 1 Error Messages and Remedial Actions Message Remedial Action File system error (directory error) File system error (invalid file type) File system error (file rename error) File system error Turn the instrument off and back on. If the fault persists, perform system reset (p.153).
-
Page 195: Appendix 2 File Naming
Appendix 2 File Naming Appendix 2 File Naming File names are constructed as follows (must be exactly eight characters, not includ- ing extension). W A V E 0 0 0 1 . M E M 3. File Extension 1. File Type 2. - Page 196 ® lion rows in Excel 2007). Larger CSV files can be split by the following methods: • Use a CSV file-splitting program (downloadable for free from Hioki’s website). • Before saving, select the [Split Save] saving method in the instrument.
-
Page 197: Appendix 3 Text File (Csv) Internal Format
Appendix 3 Text File (CSV) Internal Format “ Appendix 3 Text File (CSV) Internal Format Text files consist of header and data portions. The header includes the following information related to measurement data. (1) File name and version, (2) Title comment, (3) Start trigger time, (4) Channel setting row content, (5) Channel setting rows, (6) Data row content, (7) Data rows "File name","WAVE0003.CSV","V 1.00"... -
Page 198: Appendix 4 Binary File Size Calculation
Appendix 4 Binary File Size Calculation Appendix 4 Binary File Size Calculation (Byte units) File size = Header size + Data size Header size = Text header size + Binary header size Text header size = 512 × (4 + number of analog channels × 2 + number of pluse channels ×... -
Page 199: Appendix 5 List Of Default Settings
Appendix 5 List of Default Settings Appendix 5 List of Default Settings When shipped from the factory or initialized to factory defaults, the settings are as follows. Screen Setting Item Default Setting Screen Setting Item Default Setting Trig& Trig Func Setting Interval 10ms Timing... -
Page 200: Appendix 6 Maximum Recordable Time
When saving data in text format (CSV), the maximum recording time is reduced to 1/ 10 of the value indicated in the table or less. (d: days/ h: hours/ min: minutes/ s: seconds) Recording capacity LR8432-20 Interval 9727 9728 9729... -
Page 201: Appendix 7 Reference
Appendix 7 Reference Appendix 7 Reference LR8432-20 Measurement Values Under the conditions below, “OVER” or “-OVER” is displayed for the numerical cal- culation or cursor value and the calculation value or saved data is handled as shown in the table below. -
Page 202: Appendix 8 Concerning Noise Countermeasures
Appendix 8 Concerning Noise Countermeasures Appendix 8 Concerning Noise Countermea- sures Mechanism of Noise Introduction into Thermocouple Temperature Mea- surements What are the sources of noise? Within a factory, power is provided by large current flows at 50 Hz/60 Hz. The main loads are primarily L loads, such as motors and solenoids;... - Page 203 Appendix 8 Concerning Noise Countermeasures Equivalent Circuit of Noise Introduction Path Measurements are directly affected by normal mode voltages from electromagnetical- ly induced noise resulting from electromagnetic coupling into looped instrument input lines by AC magnetic fields produced by inverters and commercial power lines, as well as the capacitive coupling that results from interline capacitance.
- Page 204 Connecting the chassis GND on the signal side to the instrument chas- When connecting the chassis ground of the LR8432-20 to the chassis ground of the device being tested and then to ground, use a wire that is as short and as thick as possible to bring both pieces of device to equal potential.
- Page 205 When the instrument is being powered by batteries and the AC adapter is not con- nected, the ground current loop is eliminated, making it possible to reduce the effects of common mode noise. For measurements of short duration, powering the LR8432-20 with batteries is an effective method for eliminating noise. Common Mode Noise Countermeasures...
- Page 206 GND on the LR8432-20. Note that doing so has no effect if the LR8432-20 is not itself con- nected to ground through the three-prong power cord, etc.
- Page 207 “+”and “-” input terminals so that the noise does not enter the LR8432-20. When inserting a capacitor, use one with a rated voltage that is equal to or exceeds the input voltage.
-
Page 208: Appendix 9 Using The Application Program
A USB driver also needs to be installed on the computer to enable communica- tions with the instrument. The application program can be installed from the supplied CD, or you can download the latest version from the Hioki web site. Use the following procedure to install the software on the computer. Verify operating environment compatibility before installing. - Page 209 Appendix 9 Using the Application Program Because the USB mode on the [System] screen must be set to [USB Comm.], it is not possible to record data to or load data from a USB flash drive while using the Logger Utility application soft- ware.
-
Page 210: Installing Logger Utility
Appendix 9 Using the Application Program Installing Logger Utility Follow the procedure below to install Logger Utility. This explanation is for installing ® the software on Windows XP. The messages displayed may differ slightly depend- ing on other operation system or settings you are using. Important If you are running software such as antivirus software, be sure to end the soft- ware before you start the installation. - Page 211 Appendix 9 Using the Application Program In the installer, click [Next] and confirm the installation destination. Click The end user license agreement is displayed. Read the EULA, then select Agree] [Next] , and click The installation destination folder can be changed on this screen. If you are not changing the instal- [Next] lation destination, click...
- Page 212 Appendix 9 Using the Application Program Click to start install- [Next] ing. Click Installation starts. Progress is displayed during in- stallation. To interrupt installation in [Cancel] progress, click Click Installation finished...
-
Page 213: Installing The Usb Driver
Install the USB driver before you use the instrument with a USB connection. (Insert the CD found in the package into the CD-ROM drive.) Install the driver. • Run [SetupDriver32.msi] in the CD. If [Logger Utility] is already installed, run the CD from the following location. [c:\Program Files\HIOKI\LoggerUtility\Driver\SetupDriver32.msi] ® ® ® ®... - Page 214 Appendix 9 Using the Application Program Click [Next] Start installing. Click Installing. ® For Windows During the installation, a mes- sage saying that the software ® has not passed Windows Logo testing will appear a few [Continue Any- times, click way] to continue installing.
- Page 215 Sometimes another dialog box requesting your permission to 1 Click install the software may ap- 2 Click “Al- pear. When it does, check ways trust software from “HIOKI E.E. CORPORA- TION” [Install] and click continue. When installation is com- pleted and the dialog box...
-
Page 216: Connecting The Instrument To The Computer With A Usb Cable
Appendix 9 Using the Application Program Connecting the Instrument to the Computer with a USB Cable Install the USB driver before you use the instrument with a USB connection. (p. A25) • Do not pull out the USB cable during data transfer. Doing so would prevent proper data transfer. - Page 217 Appendix 9 Using the Application Program ® Windows Connect the instrument and computer with the USB cable. [Found New Hardware Wiz- After the “Found New Hardware” window appears, the ard] dialog box will appear. Check “No, not this time” and click [Next] 1 Click 2 Click...
- Page 218 Appendix 9 Using the Application Program A message saying that the software has not passed ® Windows Logo testing will appear a few times, click [Continue Anyway] continue installing. Click When installation is com- plete, the next dialog will appear. Click [Finish] This completes the driver in- stallation.
-
Page 219: Starting And Ending Logger Utility
Appendix 9 Using the Application Program Starting and Ending Logger Utility Starting Logger Utility ® From the Start Menu of Windows , click [All Programs] [HIOKI] [Logger Utility] [Logger Utility]. Click Click Logger Utility starts with the settings in the same state as when the software was last ended. -
Page 220: Appendix 10Frequently Asked Questions
Appendix 10 Frequently Asked Questions Appendix 10 Frequently Asked Questions Here are some common questions and answers about the instrument. Installation and Settings Question Remedial Action Reference page How to measure the tempera- The instrument provides this func- Precautions in “2.3 tionality. - Page 221 Appendix 10 Frequently Asked Questions Question Remedial Action Reference page Can recording resume auto- Enable Auto Resume. Recording will “Using the Auto-Re- automatically resume after a power sume Function (Re- matically after a power outage? outage. sume After Power Because data measured before the Restoration)”...
-
Page 222: Triggering
Appendix 10 Frequently Asked Questions Question Remedial Action Reference page When connecting a thermo- Select INT when connecting a ther- “Temperature Mea- mocouple (or compensating leads) surement Settings” couple directly to the instru- directly to the instrument. (p.59) ment, should reference Overall measurement accuracy is junction compensation be set the sum of the accuracies of the... -
Page 223: Measuring
Appendix 10 Frequently Asked Questions Question Remedial Action Reference page How can I acquire data contin- Set as follows: “3.3 Setting Configu- Measurement Criteria ration 1 – Recording uously starting on April 1, [Interval] [Cont] : Off, 8 hr 0 min 0 s Settings”... -
Page 224: Data Saving
Hioki-specified CF card option for (p.111) data protection. Operation can only be guaranteed for Hioki CF card op- tions. Also, USB flash drive security features such as fingerprint authen- tication are not supported. Use a USB flash drive whose continuous current consumption does not ex- ceed 300 mA (peak 500 mA). - Page 225 Adapter connected, waveform data I did not use auto saving to re- will be backed up to the instrument’s movable storage. internal memory. For the LR8432-20 with a fully charged 9780 Battery Pack, the waveform backup time is 100 hours.
- Page 226 Appendix 10 Frequently Asked Questions Question Remedial Action Reference page If the power goes out while If the power goes out during real- “2.1 Using the Battery time save operation, the data on the Pack (Option)” (p.28) measurement is in progress, is CF card may be corrupted.
- Page 227 “File” menu.) ® When opened in Excel , the When saving data in CSV format on “Selecting the Hori- the LR8432-20, the displayed time is zontal (Time) Axis time displayed is elapsed time [Time Disp] determined by the set- Display”...
-
Page 228: Logger Utility
USB driver by deleting “HIOKI 8423, 8430, LR8400 USB Driver” or “HIOKI Logger USB Driver” on the “Add or Remove Pro- grams” screen under “Control Pan- els.” Then reinstall the USB driver. -
Page 229: Appendix 11Pulse Input Circuit Diagram
Appendix 11 Pulse Input Circuit Diagram Appendix 11 Pulse Input Circuit Diagram The following diagram illustrates an example connection to the instrument’s pulse input circuit: Instrument ALARM pin circuit architecture and example relay connection 100 kΩ 100 kΩ 150 pF... -
Page 230: Appendix 12Heat Flow
Appendix 12 Heat Flow Appendix 12 Heat Flow Heat flow Heat flow indicates a quantity of heat energy that flows through the unit area per unit time (unit: W/m Temperature, on the other hand, indicates a result of heat energy movement (varies depending on the thermophysical property of a material). - Page 231 Using Models Z2012, Z2013, Z2014, Z2015, Z2016, or Z2017 Heat flow sensors (Z2012, Z2013, Z2014, Z2015, Z20165, Z2017) and double-sided Thermally Conductive Tape (Z5008) can be purchased via an authorized Hioki dis- tributor or reseller.
- Page 232 Appendix 12 Heat Flow...
-
Page 233: Index
Index Index Index Number Decimal Mark .......... 151 Default setting ........A 11 0 pos ............67 Deleting (for saving data) ......54 4-20 mA ............. 36 Display Color .......... 149 Display Range .......... 66 Drive ............123 A/B cursors ........102 Alarm ............81... - Page 234 Index Index Save ............155 Length (Segment length) Auto Save ......54 ..........114 Level Calc Results ............ 82 ........119 Level Monitor File Type ..........26 ..........109 Level Trigger Numerical Calculation Results ..........82 ..119 Load Quick Save ..........121 .......... 114 Load Set.
- Page 235 Index Index Copy ............. 126 USB mode ..........154 Values ............23 Vertical cursors ........101 Voltage Measurement ......58 Waveform ..........117 Waveform + Calc ........115 Waveform Display Color ......66 Waveform screen ........97 Waveform(realtime) ........ 115 Window Trigger .........
- Page 236 Index Index...
Need help?
Do you have a question about the LR8432-20 and is the answer not in the manual?
Questions and answers