Hioki MEMORY HiLOGGER LR8400-20 Measurement Manual
Hide thumbs
Also See for MEMORY HiLOGGER LR8400-20:
- Instruction manual (298 pages) ,
- Instruction manual (300 pages)

Related Manuals for Hioki MEMORY HiLOGGER LR8400-20


Summary of Contents for Hioki MEMORY HiLOGGER LR8400-20
- Page 1 Measurement Guide LR8400-20 LR8401-20 LR8402-20 MEMORY HiLOGGER April 2010 Edition 1 LR8400B981-00 10-04H...
- Page 3 Introduction Introduction Thank you for purchasing the Hioki Model LR8400-20, LR8401-20, LR8402-20 Memory HiLogger. This Measurement Guide consists of some basic application examples. Before using the HiLogger, be sure to read the Instruction Manual carefully. The following documents are provided with the HiLogger. Refer to them as appropriate for your application.
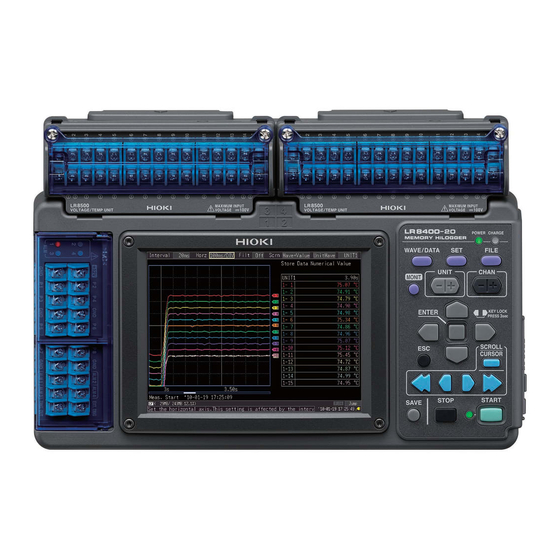
- Page 4 Operating Outlines and Screen Configurations Operating Outlines and Screen Configurations Front Panel Display Screen Universal Unit∗ Voltage/Temp Unit∗ POWER LED Lights when powered on. External Control CHARGE LED Terminals Lights while charg- • Pulse inputs ing the Z1000 Bat- • Alarm outputs tery Pack.
-
Page 5: Basic Key Operations
Operating Outlines and Screen Configurations Operation Keys Choose a screen Setup and display WAVE/DATA CH Selects among waveform/nu- Select channels. merical screen displays (p. 4). UNIT SET Switches input units. MONIT Displays the Settings screens, and switches among the screen Shows the current input wave- tabs with each press (p. - Page 6 Operating Outlines and Screen Configurations Waveform/Numerical Screens The screen switch- es each time you press the key. (sev- en display types) [Gauge+Wave] Screen [Wave] Screen [Gauge+Wave] Measurement data is displayed Measurement data is dis- as waveforms with gauges. played as waveforms. [Wave] [Wave+Value] [Value+Cmnt]...
-
Page 7: Settings Screens
Operating Outlines and Screen Configurations Settings Screens The screen switch- es each time you press the key. (sev- en display types) [Setting] Screen [CH] Screen Press the left/right keys to select be- Make settings for recording. Make input channel settings tween the Settings numerical calculation,... -
Page 8: File Screen
Operating Outlines and Screen Configurations File Screen Operational information is displayed along the bottom of the screen. File Screen View and manage files on the CF card/USB flash drive. -
Page 9: Measurement Preparations
Measurement Preparations Measurement Preparations Follow these steps to prepare before measuring. Make the necessary connections to the HiLogger, and turn the power switch on. Input Expansion Units (as needed) Connect the measure- Right ment input cables side Turn the power on. Right side Front Connect the AC adapter... -
Page 10: Measurement Procedure
Measurement Procedure Measurement Procedure Before measuring, be sure to read the "Operating Precautions" in the Instruction Manual. Read "Pre-Connection Inspection" Pre-measurement inspection in the Instruction Manual. Connect to the measurement object Configure settings for measurement Configure recording settings on the [Setting] screen. - Page 11 Measurement Procedure Start and finish measuring∗ When continuous recording ([Cont]) is disabled ([Off]), measurement stops automati- cally after the set recording time (there is no need to press Start Stop STOP). Measurement Measurement * Triggering is used to start and stop measurement by specified criteria, or at specified times.
- Page 12 AC Adapter (supplied) Measurement (input) leads Connect to power outlet Thermocouple CF Card ∗ ∗: Hioki option Insert a CF card Connect to the (Right side) measurement points Configure Measurement Settings Make recording timing settings on the screen.
- Page 13 Measuring Make input channel settings on the screen. [CH] Select Apply Setting Example Measurement Hints For maximum resolution, select the most Channel: CH1, Input: Voltage, Range: 2V ° sensitive range that includes the measured Channel: CH2, Input: TC, K, Range: 100 value.
- Page 14 • Although real-time saving to USB flash drive is available, we recommend using a CF card for optimum reliability and data preservation. • Performance cannot be guaranteed when using storage media other than a Hioki-specified CF card option. Measurement Hints ...
- Page 15 Measuring Start and finish measuring Press START. • Data is recorded to HiLogger memory. It is then automatically saved to the CF card. Recording stops one day after starting. • To stop recording early, press STOP. • To view waveforms or numerical values while measuring, see "Viewing Waveforms or Numer- ical Values"...
-
Page 16: Display Waveforms
Viewing Waveforms or Numerical Values Viewing Waveforms or Numeri- cal Values This section describes how to view waveforms and numerical values during and after measurement. Display Waveforms Press WAVE/DATA to display the Waveform/Value screen. The screens toggle each time the key is pressed. Gauges can be displayed, and numerical values and waveforms can be viewed simultaneously. -
Page 17: Scrolling The Waveform
Viewing Waveforms or Numerical Values Viewing a Measurement Waveform Scrolling the Waveform Scrolling Methods Show/hide A/B cursors Fast scroll Fast scroll backward forward Scroll backward Scroll forward The portion of a waveform that is currently Jumps to the latest waveform displayed can be confirmed by the posi- Press both simultaneously tion of the scroll bar. -
Page 18: View Measurement Values
Viewing Waveforms or Numerical Values View Measurement Values Measured values can be viewed as numerical values, waveforms and numerical values, or as numerical values and comments. Displayed numerical values are those of the current input signals. To display waveforms and numerical values Select [Wave+Value]. - Page 19 Viewing Waveforms or Numerical Values View CF Card / USB Flash Drive Contents Data saved by the LR8400-20, LR8401-20, LR8402-20 can be confirmed on the File screen. It is stored on the CF Card/USB flash drive as follows. The numbers in the file names are automatically generated sequentially.
- Page 20 Observing Data on a Computer Observing Data on a Computer Converting waveform data to text format To analyze data using a spreadsheet program such as Excel, first convert the waveform (binary) data to text (CSV) format using the HiLogger or Logger Utility program. This procedure describes how to convert to text format using the Logger Utility.
- Page 21 Observing Data on a Computer Save in Text (CSV) Format In the menu bar, click [File] [Save File in Text Format] [Save File in Text Format] dialog appears. Select the sheet of measurement data to save. Select the check boxes for the channels to save. Set the following: [File name] Enter any file name.
- Page 22 Observing Data on a Computer Computer Connection (for communication) Connect a computer to the HiLogger with a LAN or USB cable to view recorded data and make HiLogger settings on the computer. Use the supplied Logger Utility application program to monitor waveforms, numerical val- ues, and warning output states in real time, and to collect measurement data from up to five HiLoggers on one computer.
Need help?
Do you have a question about the MEMORY HiLOGGER LR8400-20 and is the answer not in the manual?
Questions and answers