JUMO Logoscreen Operating Instructions Manual
Paperless recorder for secure acquisition of fda-compliant measurement data
Hide thumbs
Also See for Logoscreen:
- Operating manual (136 pages) ,
- Operating instructions manual (68 pages)
Table of Contents
Advertisement
Quick Links
Download this manual
See also:
Operating Manual
Advertisement
Table of Contents

Related Manuals for JUMO Logoscreen


Summary of Contents for JUMO Logoscreen
- Page 1 Paperless Recorder for secure acquisition of FDA-compliant measurement data B 95.5011.1 Operating Instructions 08.04 / 00415645...
- Page 2 Menu structure of the paperless recorder...
-
Page 3: Table Of Contents
Contents Introduction Preface ......................5 Arrangement of the documentation ............6 Typographical conventions ................. 9 Instrument description Displays and controls ................11 Operating principle and graphic elements ..........14 Operation and visualization Start menu ....................18 3.1.1 Overview ...................... 18 3.1.2 Logging in and logging out ................ - Page 4 Contents...
-
Page 5: Introduction
1 Introduction 1.1 Preface Please read this Operating Manual before commissioning the instrument. Keep the manual in a place that is accessible to all users at all times. Please assist us to improve this operating manual, where necessary. Your suggestions will be appreciated. However, if any difficulties should arise during start-up, please do not carry out any manipulations. -
Page 6: Arrangement Of The Documentation
The product description illustrates the security and operating concepts behind description the system, and the results that can be achieved by JUMO in the course of validation of an installation. It is intended to serve as an introduction to the system, and not as a formal technical document. - Page 7 B 95.5011.2.1 Interface Description (LON interface) This provides information on the connection and use of modules of the “JUMO mTRON automation system”. B 95.5011.2.3 Interface Description (PROFIBUS-DP interface) This provides information on the connection of a paperless recorder to a PROFIBUS-DP system.
- Page 8 (rights files), device lists etc. The different message types are: “Information”, “Warnings” and “Errors”. Audit trail records cannot be modified. Device audit trail data are not shown in PCAT, only in PCA3000. All documents are available for downloading at: www.jumo.net...
-
Page 9: Typographical Conventions
1 Introduction 1.3 Typographical conventions Warning signs The symbols for Danger and Caution are used in this manual under the following conditions: Danger This symbol is used when there may be danger to personnel if the instructions are ignored or not followed correctly! Caution This symbol is used when there may be damage to equipment or data if the instructions are ignored or not followed correctly! - Page 10 1 Introduction Representation Keys Keys are shown in a box. Both symbols and text are possible. If a key has a multiple function, then the text shown is the one that corresponds to the function that is active at the moment. Screen texts Program Texts that are displayed in the setup program are indicated by italic script.
-
Page 11: Instrument Description
2 Instrument description 2.1 Displays and controls Power LED (green) is on continuously as soon as power is applied. Flashes when screen saving is active. Pressing any key will de-activate screen saving. Status LED (red) is on continuously while an alarm is present Color display 320 x 240 pixel, 27 colors Cover... - Page 12 2 Instrument description CompactFlash slot for exchanging data (measurement data, configuration data, user lists) between the recorder and the PC Signal LED; lights up on accessing the CompactFlash memory card. The card must not be removed while being accessed. Channel line Status line Softkeys Ejector for the...
- Page 13 2 Instrument description Version with stainless steel Status LED (red) front is on continuously while an alarm is present Power LED (green) is on continuously as soon as power is applied. Flashes when screen saving is active. Pressing any key will de-activate screen saving. Softkeys screen-dependent function, represented by text or symbols...
-
Page 14: Operating Principle And Graphic Elements
2 Instrument description 2.2 Operating principle and graphic elements Keys The recorder is operated from eight keys. Three of these have fixed functions, the other five (softkeys) have screen-dependent functions. v Chapter 2.1 “Displays and controls” Softkeys The functions of the softkeys appear in the bottom line of the display, as symbols or in plain text. - Page 15 2 Instrument description CompactFlash / internal memory indicates the free capacity of the CompactFlash memory or the internal backup memory. Which symbol is shown, can be set in the “Parameterization” menu. v Chapter 3.6 “CompactFlash card” Free capacity of the CompactFlash memory card. Free capacity of the internal backup memory.
- Page 16 2 Instrument description...
-
Page 17: Operation And Visualization
3 Operation and visualization After starting up the paperless recorder by switching on the supply (power ON), you will see the start logo (company logo). During screen build-up, the recorder is initialized with the data of the last configuration. After the initialization phase, the view that was last selected at the visualization level is shown, provided that it was active at the time when the instrument was switched off (power OFF). -
Page 18: Start Menu
3 Operation and visualization 3.1 Start menu 3.1.1 Overview The start menu is the central point from which the various instrument levels branch out. The following levels are available: - visualization, - parameters - configuration - event list / AT (audit trail), - CompactFlash card and - device info Log in and log out... -
Page 19: Logging In And Logging Out
3 Operation and visualization 3.1.2 Logging in and logging out Logging in and logging out is one of the most important functions of the recorder. Logging in and logging out h Call the “Log-in and log-out” function, and the following menu is started automatically: h Select the required function h Enter selection with E The following functions are available in the menu:... - Page 20 3 Operation and visualization h Select ID (user name) and confirm with Logging in h Enter password via softkeys. If the simplified password entry has been switched off by the PC Security Manager Software (PCS), please enter the password as described in Chapter 3.8 “Text entry”.
- Page 21 3 Operation and visualization h Select the “Log-out” function. Logging out The user who is currently logged in is shown on the screen. h Please press to log out. Logging out If it was established in the PC Security Manager Software (PCS) that no without signature has to be executed when logging out, you are logged out now.
- Page 22 3 Operation and visualization h Select the function “change password” and press the Altering the key. password h From the list, select the user who the password has to be altered for, and confirm with h Enter the current password (conclude with h Enter the new password (conclude with The new password is entered as described in Chapter 3.8 “Text entry”.
-
Page 23: Visualization
3 Operation and visualization 3.2 Visualization Start menu After selecting the level Start menu Visualization, the group manager Visualization appears. Group The instrument manages six visualization groups of measurement inputs. Each manager group can consist of up to six analog and three digital channels. Operation within the visualization level is always group-oriented. -
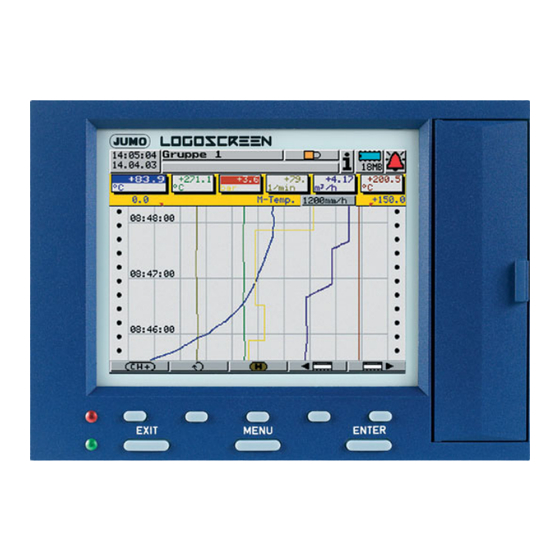
Page 24: Vertical Diagram
3 Operation and visualization 3.2.1 Vertical diagram Vertical diagram representation can be accessed from the group manager (v page 23), after a group has been selected: - present measurements of the analog inputs of the group - measurement on a red background ⇒ out of limit Unit of measurement Scaling start of the selected channel Lower limit index of the selected channel... -
Page 25: Horizontal Diagram
3 Operation and visualization 3.2.2 Horizontal diagram In the horizontal diagram, the analog and, in addition, the digital channels of a group are registered horizontally, from left to right. Present diagram speed Background color: gray = normal operation, blue = timed operation, orange = event operation Channel name of the digital channels... -
Page 26: Evaluation Of The Stored Measurement Data
3 Operation and visualization 3.2.3 Evaluation of the stored measurement data It is possible to evaluate the measurement data of a group if the status of the group (Group status) has been configured to Displ.+store. History Using this function, all measurement data of the internal RAM (approx. 350,000 measurement data for all groups) can be displayed and evaluated. - Page 27 3 Operation and visualization Zoom If the zoom factor has to be adjusted, or specific values have to be searched, then it is necessary to switch the softkey functions. h Press softkey The degree of compression of the measurement data on the screen is given as a ratio in steps (1:1, 1:2, 1:5, 1:10, 1:20, 1:50 and 1:100).
- Page 28 3 Operation and visualization Window for defining the search criteria Position of the value found “no value found” display Current zoom Start search The example above shows the search for the first occurrence of a measurement >50 on channel 1 on the 14.04.03 within the period from 15:16:48 to 15:44:24.
-
Page 29: Bar Graph Representation
3 Operation and visualization 3.2.4 Bar graph representation In bar graph representation, the latest measurements of the group are shown as bar graphs, in addition to the numerical display. Scaling end Upper limit index Latest measurement (numerical) Latest measurement as bar graph Out-of-limit On out-of-limit, the color changes to red. -
Page 30: Numerical Representation
3 Operation and visualization 3.2.5 Numerical representation In numerical representation, the currently measured values of a group are shown in large characters. The exact measurements can then be read easily from a distance of several meters. The window of the selected channel is in the foreground so that the channel name, description and unit can be seen. -
Page 31: Numerical 1-Channel Representation
3 Operation and visualization 3.2.6 Numerical 1-channel representation The numerical 1-channel representation is called up from the numerical representation, via the softkey In the numerical 1-channel representation, the latest measurement of a channel is shown in large letters both numerically and as a bar graph. Channel name Latest measurement... -
Page 32: Reports
3 Operation and visualization 3.2.7 Reports Definition A report is a set of statistics covering a specific period of time, which contains the minimum, maximum, average and, possibly, the integration value. Types The recorder can run five different types of report: - periodic report (a report of a specific length of time, which is repeated periodically) - external report/batches... -
Page 33: Batch Reports
3 Operation and visualization 3.2.8 Batch reports Batch reporting enables the creation of a flexible form to describe a batch process within the recorder. It can only be run parallel to an external report and is active when the parameter Configuration Report/Batches Ext.Report/ Batches... - Page 34 3 Operation and visualization General Line 1 Line 2 Line 3 Line 4 Line 5 Line 6 Line 7 Line 8 Line 9 Line 10 The screen arrangement is identical for both batch reports. It consists of 10 lines on the screen and 2 columns. The left column “Text field (1)”...
- Page 35 3 Operation and visualization Text field (1) Text field (1) has to be set up before commissioning the system. Each line consists of a maximum of 15 characters. Example: Parameter setting for line 1 Parameter for line 1 Parameter setting Configuration Report/Batches Program name...
- Page 36 3 Operation and visualization Example: Parameter setting for line 6 Parameter for line 6 Parameter setting Configuration Report/Batches Binary-linked text Ext.Report/Batches Batches Line 6 Contents right column Configuration Report/Batches Logic inp1-2 Ext.Report/Batches Batches Line 6 Binary linking Configuration Report/Batches Ext.Report/Batches Batches Line 6 from text No.
- Page 37 3 Operation and visualization Text field (4) Text field (4) is filled automatically by the recorder and cannot be altered. Example: Parameter setting for line 8 Parameter for line 8 Parameter setting Configuration Report/Batches Batch start Ext.Report/Batches Batches Line 8 Contents right column Example: Parameter setting for line 9 Parameter for line 9...
- Page 38 3 Operation and visualization Batch texts How can something be edited? Here is the summary again: Texts can be edited on the instrument and by using the setup software. They can also be transferred online to an instrument, through the setup software.
- Page 39 3 Operation and visualization Current batch report Change to the previous/ next visualization Change between “current” and last “completed” batch report Edit all editable parameters in the right column Switch the four right-hand softkeys to additional functions Show report data of batch report Show data of batch report as history in “horizontal diagram”...
- Page 40 3 Operation and visualization Texts in the right column can only be edited here, in the current batch report. After calling up the function, the field to be modified can be selected using the buttons. How the field is modified, depends on the field type.
- Page 41 3 Operation and visualization Completed The screenshot shows a completed batch report that does not include the batch report possibility of executing an electronic signature. Change to the previous/ next visualization Change between “completed” and “current” batch report Switch the four right-hand softkeys to additional functions Show report data of batch report Show data of batch report as history in...
- Page 42 3 Operation and visualization Completed The screenshot shows a completed batch report that includes the possibility batch report of executing an electronic signature. Whether an electronic signature can be executed, is decided through the PC Security Manager Software (PCS). Execute electronic signature Line 2 Line 1 Executing...
- Page 43 3 Operation and visualization Signing batches Only a completed batch protocol can be made visible and signed in the at a later stage recorder. If you fail to sign, the electronic signature can be executed at a later stage in the PC Evaluation Software (PCA3000).
-
Page 44: Parameterization
3 Operation and visualization 3.3 Parameterization The following can be set at the parameter level: - contrast, - speed indication, - memory indication, - display off (screen saving), - fine calibration and - date and time Functions which have been disabled using the PC Security Manager Software (PCS) cannot be called up. - Page 45 3 Operation and visualization Contrast The contrast of the screen can be set here. This ensures that the screen is always highly legible, even under difficult light conditions. Speed Here, “time/div“ or “mm/h” can be selected for the speed display in the indication vertical and horizontal diagrams.
- Page 46 3 Operation and visualization Fine calibration Using fine calibration, the analog measurements can be calibrated (adjusted). The adjustment is carried out using a linear equation. After selecting the channel, first set the parameter Fine calibration Calibration status = ON, then enter the parameters for fine calibration. Actual start value Start value of the actual line Target start value...
-
Page 47: Configuration
3 Operation and visualization 3.4 Configuration The configuration level can only be called up if the user who is logged in has the right to do so. The rights are administered with the PC Security Manager Software (PCS). Window As for the other levels, the principle of configuration is also based on menu-led technology window technology. -
Page 48: Event List / At
3 Operation and visualization 3.5 Event list / AT The following tabular lists are concealed behind the menu item: - event list and - audit trail list. Different events can initiate texts in the recorder, which are included in the event list. - Page 49 3 Operation and visualization Standard texts The recorder offers standard texts as listed in the following table: Standard text Comment Grx Chany low alarm ON x = group number Grx Chany low alarm OFF y = channel number Grx Chany high alarm ON Grx Chany high alarm OFF Logic input x ON Logic input x OFF...
- Page 50 3 Operation and visualization Start menu The event list is called up via the start menu: Event list h Select operating level Event list h Enter selection with E Event list Call up audit trail list...
-
Page 51: Audit Trail List
3 Operation and visualization 3.5.2 Audit trail list Starting from the event list, call up the audit trail list using the button. Current entry in short form Select current Call up event list entry Current entry in full length The following are entered in the audit trail list: - each operator intervention with time stamp, name, ID, alteration (reason for alteration). -
Page 52: Compactflash Card
3 Operation and visualization 3.6 CompactFlash card The CompactFlash card menu can only be called up if the user who is logged in has the right to do so. The rights are administered using the PC Security Manager Software (PCS). Automatic The data stored in the paperless recorder are automatically saved to the storage of... - Page 53 3 Operation and visualization CompactFlash Measurement data not yet saved are written to the card CompactFlash memory card. All running reports are concluded and written to the CompactFlash memory card, together with the measurement data not yet saved. All measurement data in the memory (also those which have already been fetched) are written to the CompactFlash memory card.
- Page 54 3 Operation and visualization Status Status messages of the CompactFlash card menu are shown in a separate messages window in the menu. - If you use the key to confirm a message, the CompactFlash menu is automatically terminated. - If you use the key to confirm a message, only the message is deleted, the CompactFlash menu continues to be active.
- Page 55 3 Operation and visualization Status message Description You start the function CF card ! User list, but the The user list was not accepted! user list could not be accepted for unknown reasons. Remedy: Check card on PC and generate list again, if necessary.
-
Page 56: Device Info
3 Operation and visualization 3.7 Device info The device info window displays general information about the instrument. It also includes the errors “Battery empty” and “Data lost”. If one of these instrument errors occur, the info symbol flashes in the status line. Start menu The device info is called up from the start menu: Device info... - Page 57 3 Operation and visualization Error The following errors may occur: Error Description none Instrument OK Data lost A discharge of the lithium battery/storage capacitor occurred during the last lengthy power interruption. Consequently, the measurement data stored up to now in the SRAM only will be lost. The data in the internal backup memory will be retained.
-
Page 58: Text Entry
3 Operation and visualization 3.8 Text entry Entry options The configurable texts can be entered either through the setup program or on the instrument itself. This section describes the entry on the instrument. Character The screen below is shown when a text (e. g. Configuration Group selection config. - Page 59 3 Operation and visualization Character Using the button, you can restrict the number of visible restriction characters. The fewer characters are displayed, the easier the selection.
- Page 60 3 Operation and visualization...
-
Page 61: Index
4 Index Alarm Annual report Arrangement of the documentation Audit trail Bar graph representation Batch report – Completed batch report Current batch report Executing the signature Signing batches at a later stage Batch reports Batch texts Batches – Channel description Channel line –... - Page 62 4 Index – Evaluation of measurement data Evaluation software Event definition Event list Event message Events Exit key External report Falling below range Fine calibration Group manager Group or instrument (device) name High limit History Horizontal diagram Horizontal diagram representation Information Instrument (device) info Instrument documentation in printed form...
- Page 63 4 Index – Memory display Menu key Monthly report No value found Note signs Numerical 1-channel representation Numerical representation Out of limit Parameterization Password Password alteration Periodic report Power LED Principle of configuration Product description Report Representation Returning Sales documentation in printed form Scaling Screen saving Screen texts...
- Page 64 4 Index Status LED Status line Status message Supplementary text Synchronization time Text entry Texts Time Time & Date Typographical conventions Underrange Unit of measurement User Logged-in user Signing a batch Standard (default) password Standard (default) user Value found Vertical diagram representation Visualization Warning signs Warranty...
- Page 68 JUMO GmbH & Co. KG JUMO Instrument Co. Ltd. JUMO PROCESS CONTROL INC. Street address: JUMO House 885 Fox Chase, Suite 103 Moltkestraße 13 - 31 Temple Bank, Riverway Coatesville, PA 19320, USA 36039 Fulda, Germany Harlow, Essex CM20 2TT, UK...
Need help?
Do you have a question about the Logoscreen and is the answer not in the manual?
Questions and answers