JUMO LOGOSCREEN nt Operating Instructions Manual
Paperless recorder with tft display, compactflash card, and usb interfaces
Hide thumbs
Also See for LOGOSCREEN nt:
- Interface description (56 pages) ,
- Interface description (68 pages) ,
- Installation instructions manual (48 pages)

Related Manuals for JUMO LOGOSCREEN nt


Summary of Contents for JUMO LOGOSCREEN nt
- Page 1 JUMO LOGOSCREEN nt Paperless recorder with TFT display, CompactFlash card, and USB interfaces B 706581.1 Operating Instructions 2014-05-22/00504667...
- Page 2 Menu structure of the paperless recorder v Chapter 8 "Device Manager" v Chapter 7 "Memory Manager" v Chapter 6 "Alarm and Event Lists" v Chapter 4 "Visualization" v Chapter 5 "Memory Presentation (History)" New device functions The device software version 187.03.xx is replaced by version 187.04.xx. The following ad- ditional functions are available with the new version: - additional horizontal recorder image;...
-
Page 3: Table Of Contents
Contents Introduction Preface ......................7 Arrangement of the Documentation ............8 Typographical Conventions ..............10 Instrument Description Displays and Controls ................15 Operating Principle Operating Principle and Graphic Elements ........... 19 Operating Example .................. 24 Group and Plant Management (Batches) ..........26 Visualization Activating the Operator Level .............. - Page 4 Contents Memory Presentation (History) Vertical presentation ................48 Horizontal presentation ................50 Alarm and Event Lists Call from One of the Visualization Modes ..........52 Call from the Memory Presentation ............54 Symbols ....................54 Memory Manager Device Manager Close Device Manager ................60 Log-in and Log-out ..................
- Page 5 Contents Web server 10.1 General ...................... 78 10.2 Online Visualization (All Visualizations Except Batches) ...... 81 10.3 Three freely programmable HTML pages ..........83 10.4 Online Visualization of Current Batch Reports ........84 10.5 QuadView ....................85 10.6 General information ................. 88 10.7 Online visualization (all visualizations other than batches) ....
- Page 6 Contents...
-
Page 7: Introduction
1 Introduction Preface Please read this manual before commissioning the instrument. Keep the instructions in a place which is accessible to all users at all times. Please assist us in improving these instructions where necessary. Your comments will be appreciated. If any difficulties should arise during commissioning, you are asked not to carry out any manipulations that could endanger your rights under the instrument warranty! -
Page 8: Arrangement Of The Documentation
1 Introduction Arrangement of the Documentation The documentation for this instrument is addressed to equipment manufacturers (OEMs) and users with appropriate technical expertise. It consists of the following parts: Instrument documentation in printed form B 706581.1 Operating instructions The operating instructions are an extract from the operating manual and cover the basic operation of the paperless recorder. - Page 9 PC, or across a network. Internet All documents are available for downloading at www.jumo.net h Start the product search on the home page. h Enter 706581 and start the search. h Select the paperless recorder.
-
Page 10: Typographical Conventions
1 Introduction Typographical Conventions Warning signs The signs for Danger and Caution are used in this manual under the following conditions: Danger This symbol is used when there may be danger to personnel if the instructions are ignored or not followed correctly! Warning This symbol is used when there may be damage to equipment or data if the instructions are ignored or not followed correctly! - Page 11 1 Introduction Presentation modes Screen texts Texts that are displayed in the setup program are indicated by italic script. Program manager Menu items Edit Menu items in the setup and instrument software referred to in this operating Device data manual are shown in italics. Menu name, menu item and submenu item are separated from each other by “...
- Page 12 1 Introduction...
-
Page 13: Instrument Description
2 Instrument Description Inputs/outputs Power supply 0…18 analog inputs max. AC 100...240V +10/-15%, 0…24 binary inputs/outputs max. 48...63Hz AC/DC 20...30V, 48...63Hz (maximum of 3 module slots, can be fitted with 6 analog inputs Interface or 3 analog inputs as standard and 8 binary inputs/outputs) 1x Ethernet 10/100 Mbits/sec 4x USB interfaces... - Page 14 2 Instrument Description Device features Front panel Zinc die-cast with lid Stainless steel (enclosed) Interfaces 2x USB None locatesd on front panel External memory CF-card located on front None panel, maximum 4 GB Operation Control knob Touchpad Interfaces 2x USB, 2x USB, located on 1x RS232/RS485,...
-
Page 15: Displays And Controls
2 Instrument Description Displays and Controls Recorder with zinc die-cast Power LED (green) panel is on continuously as soon as power is applied. TFT color display Status LED (red) 320 x 240 pixels, 256 colors is on continuously if an alarm is present. Cover ®... - Page 16 2 Instrument Description Recorder with zinc die-cast Header Status & Numerical panel title bar measurement display USB host USB device for data exchange for communication with the (measurement data, setup program or PCC configuration data, user lists) between the Ejector for the CompactFlash recorder and the PC memory card CompactFlash slot...
- Page 17 2 Instrument Description Recorder with stainless steel Power LED (green) panel is on continuously as soon as power is applied. TFT color display Status LED (red) 320 x 240 pixels, 256 colors is on continuously if an alarm is present. Touchpad The touchpad is used to configure and operate the recorder.
- Page 18 2 Instrument Description...
-
Page 19: Operating Principle
3 Operating Principle Operating Principle and Graphic Elements Header Fixed functions Variable functions with changing symbols Function is activated when the control knob is pressed. The functions of the paperless recorder are selected in the header. The selected function is indicated by a blue background. Recorder with control knob - Function selection by rotating the control knob (to right or left). - Page 20 3 Operating Principle Operator level (visualization of current data) Alarm and event lists Memory manager Device manager Group step-on Channel step-on Numerical measurement display (diagram view) Memory presentation / history (visualization of the data in internal memory) Group selection Device manager v Chapter 8 Memory manager v Chapter 7...
- Page 21 3 Operating Principle Status This line (bar) shows alarm and error messages, as well as general information, and title bar and information about the active representation mode (e.g. sampling rate). It is automatically blanked out by the system, if necessary. If the text is shown in red, this indicates an error message.
- Page 22 3 Operating Principle Numerical The numerical measurement display is available for the presentation modes: measurement - Curves, display - history (of the curve presentation) and (diagram - digital diagram view) available. In the curve presentation, the numerical display can be switched on or off. This switching on or off also applies to the history presentation.
- Page 23 3 Operating Principle Visualization window (diagram) Symbols for data acquisition: Comment has been entered Event occurred Alarm is no longer present Alarm has been signaled In the visualization window, the measurement data are shown in graphical form. Alarms are indicated by a red or orange color for the curve (can be configured in the setup program).
-
Page 24: Operating Example
3 Operating Principle Operating Example Start The normal display is active. Operation h Select the operator level by rotating the control knob. h Activate the operator level by pressing the control knob. - Page 25 3 Operating Principle h Select the operator level by rotating the control knob. h Activate the bar graph presentation by pressing the control knob. Result The bar graph presentation starts.
-
Page 26: Group And Plant Management (Batches)
3 Operating Principle Group and Plant Management (Batches) Within the recorder, all analog inputs, binary inputs, counters and integrators, are collected together into groups. A maximum of nine groups is available as a total. Each group can consist of a maximum of 6 analog inputs, 6 binary inputs (or outputs), and 4 counters/integrators. - Page 27 3 Operating Principle In order for a batch to be usable, its main group must be active (status = “Display” or “Display, save”) and at least one analog channel in the group must be assigned. Batch for plant Main group The number of plants is configured through the parameter Device manager Configuration Batches/plants...
- Page 28 3 Operating Principle...
-
Page 29: Visualization
4 Visualization Activating the Operator Level The type of visualization (curve presentation, bar graph etc.) is selected at the operator level. Note that the appearance of the operator level can be influenced by the configuration. h Select the operator level by rotating the control knob. h Activate the operator level by pressing the control knob. -
Page 30: Overview Of Header Lines
4 Visualization Overview of Header Lines Curve presentation (diagram) Bar graph presentation Text picture presentation Process image presentation Binary presentation Reports Batches (current) Batches (completed) Counters and integrators Comment entry The comment entry does not have its own header. The current header will remain when this function is activated. -
Page 31: Curve Presentation
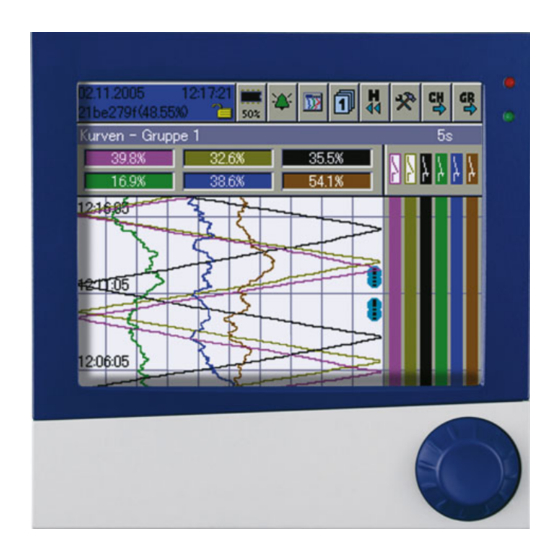
4 Visualization Curve Presentation For this type of display one distinguishes between vertical and horizontal pre- sentation. Only one of the two presentation types can be active for all groups. v Configuration Screen Show diagrams v Configuration Screen Diagram display 4.3.1 Vertical presentation In the display, signals are continuously displayed on the screen running from... -
Page 32: Horizontal Presentation
4 Visualization Memory This function starts the presentation of the data that are available in the history presentation memory. v Chapter 5 "Memory Presentation (History)" Numerical This function is used to switch the numerical measurement display (diagram measurement header) and binary traces on or off, as well as to activate the envelope display. display Channel This function activates the scaling display. -
Page 33: Bar Graph Presentation
4 Visualization Bar Graph Presentation In this visualization mode, the analog inputs are presented both numerically and in bar graph form. In addition to the analog channels, the digital inputs can also be visualized at the bottom of the display. An alarm (Alarm 1 or Alarm 2) is indicated by an orange or red background. -
Page 34: Text Picture Presentation
4 Visualization Text Picture Presentation In the presentation, the analog channels are presented numerically, together with the channel name and the channel description. In addition to the analog channels, the digital inputs can also be visualized at the right-hand edge of the display. -
Page 35: Process Image Presentation
4 Visualization Process Image Presentation The display shows selected measurement signals and background pictures in a maximum of nine process images. The setup program is used to prepare and configure the images. Each process image can be freely configured by the user. One background image (316 ×... -
Page 36: Vertical Presentation
4 Visualization 4.7.1 Vertical presentation In the display, signals are continuously displayed on the screen running from top to bottom. Diagram header Switch on and off Diagram header 4.7.2 Horizontal presentation In the display, signals are continuously displayed on the screen running from right to left. -
Page 37: Reports
4 Visualization Reports Each one of the reports covers all the analog channels in a group. Each group has its own configurable report. The current reports are visualized in the presentation. Group step-on Channel step-on Report step-on Group selection Maximum Minimum Average Time period... -
Page 38: Batches/Plants
4 Visualization Batches/Plants When recording batch processes, a distinction is made between the plant and the batch. The instrument can combine and record the data from up to 3 plants in batches (batch report). The number of batches for a plant is not limited. The instrument distinguishes between “current batch”... - Page 39 4 Visualization Edit This function can be used to edit the batch text fields that are available batch (configured for this purpose). When the function has been called up, the first editable field in the screen template will be activated. h Press the control knob to start editing.
-
Page 40: Completed Batches
4 Visualization 4.9.2 Completed Batches Change batch/plant Batch evaluation Batch Completed batches can be evaluated in three different ways: evaluation - Curves (graphical presentation) - Report (numerical presentation) - Attachments (e.g. recipes) h Rotate the control knob to select a type of presentation, then press the knob to activate this type. -
Page 41: Batch Control With Barcode Reader
4 Visualization 4.9.3 Batch Control with Barcode Reader If a barcode reader is connected to the interface “RS232 for barcode reader” (connector 2) or “RS232/RS485” (connector 7), then the batch start, batch stop, and input of batch texts in a current batch report, can be controlled by the barcode reader. - Page 42 4 Visualization Activate and display (if required) batch report for batch (plant) 3: Start and stop If the batch report is configured for start/stop via barcode reader, then it will be batch started and stopped as follows. report Start batch: h Scan bar code for “Batch report for batch (plant) 1 —...
- Page 43 4 Visualization Activate batch If a line in a batch report is configured for barcode activation, the activation texts proceeds as follows. Activate text: h Scan bar code for “Batch report for batch (plant) 1 — 3”. Scan text. The first line of the activated batch report that has been configured for text input via bar code will automatically be filled with the text that corresponds to the bar code.
-
Page 44: Counters And Integrators
4 Visualization 4.10 Counters and Integrators In this presentation, the current states of the counters and integrators (totalizers) are displayed, as well as the operating hours counter. Up to 9 counters and integrators can be shown in one screen template. The functional characteristics (counter, integrator or operating hours counter) are defined in the device configuration. -
Page 45: Comment Entry
4 Visualization 4.11 Comment Entry This function can be used to enter a text (max. length 31 characters) that is entered in the event list when the input is completed. In curve presentation (in the displayed group), the text entry is marked by a pencil symbol. - Page 46 4 Visualization...
- Page 47 5 Memory Presentation (History) The Memory presentation function can be used to display and check data from the internal main memory (SRAM) of the instrument. The size of the memory for memory presentation can be configured. The memory presentation can be activated in the visualization modes “Curve presentation”...
-
Page 48: Vertical Presentation
5 Memory Presentation (History) Vertical presentation End memory presentation Channel step-on Numerical measurement display (Min / Max changeover) Zoom and Search Scroll pages Scroll lines Event list Present cursor position A cursor is now shown in the center of the visualization window. The corresponding measurements are shown in the line for “Numerical measurement display”. - Page 49 5 Memory Presentation (History) page, as required. “Scroll pages” can be ended by pressing the control knob. Zoom and This function affects how many measurements are used to calculate a point in search the diagram, and to search for measurements according to date and time. Zoom The factory setting is “1:1”, which means that every measurement in the History memory will be displayed.
-
Page 50: Horizontal Presentation
5 Memory Presentation (History) Numerical This function decides whether the MAX or MIN values are shown in the measurement “Numerical measurement display”. Min or Max values arise when more display measurements are recorded than are displayed. This will be the case if “Min/ Max recording”... - Page 51 6 Alarm and Event Lists The alarm and event lists can be called up in two ways: - A call from one of the visualization modes, e.g. curve presentation (diagram) (Chapter 4.2 "Overview of Header Lines") - A call from the memory presentation (Chapter 5 "Memory Presentation (History)").
-
Page 52: Alarm And Event Lists Call From One Of The Visualization Modes
6 Alarm and Event Lists Call from One of the Visualization Modes h In the header line, rotate and press the control knob to select and activate the bell symbol. h Select the required list. Activate alarm list Complete list of alarms Batch-related alarm lists if the number of... - Page 53 6 Alarm and Event Lists h Rotate the control knob to select a list, then press the knob to activate the list. Example In the example, you can see a complete event list. Close list h Close the event list by pressing the control knob. The visualization that was active before the list was called up will now be displayed again.
-
Page 54: Call From The Memory Presentation
6 Alarm and Event Lists Call from the Memory Presentation h In the header line, rotate and press the the control knob to select and activate the bell symbol. Only the event list for the active group will be shown in the memory presentation. -
Page 55: Memory Manager
7 Memory Manager The memory manager contains functions for data exchange between the paperless recorder and CF memory cards or USB memory sticks. Symbols The symbol for the Memory manager (menu: Memory manager) in the header can be shown in different ways. This shows the available memory of the CompactFlash memory card that has been inserted. - Page 56 7 Memory Manager Activation for USB stick Access to the Memory manager menu via the header is not possible with a USB memory stick. If one of the visualization modes (Chapter 4 - e.g. Curve Presentation) is active when a USB memory stick is inserted, the menu automatically appears and remains active until the memory stick is removed again.
- Page 57 7 Memory Manager The functions of the memory manager are the same for CF cards and USB memory sticks. For USB sticks, the menu entries have "USB stick" instead of "CF card". Close memory Close the memory manager and reactivate the previous visualization. manager (Exit) Safely The function should always be called before removing a CF card or a USB...
- Page 58 7 Memory Manager General information The function CF card update reads out data that have not yet been read out. After read-out, data are not marked as read in the recorder but are not deleted. Function Backup CF card reads all data from internal memory, including what had already been read.
-
Page 59: Device Manager
8 Device Manager The functions of the Device manager vary, depending on whether a user is logged in or not. No user logged in “User” logged in User Close Device Manager “Master” logged in Log-in and log-out Device information Device audit trail Configuration Parameterization Service functions... -
Page 60: Close Device Manager
8 Device Manager Close Device Manager Close the device manager and reactivate the previous visualization. Log-in and Log-out h Select the Device manager in the header, by rotating the control knob. h Activate the Device manager by pressing the control knob. h In the Device manager activate the function Log in. - Page 61 8 Device Manager h Select “OK” with the control knob, and press the control knob. h Enter the password by rotating and pressing the control knob, and finish the entry with “OK”. You are now logged in to the system.
-
Page 62: Device Information
8 Device Manager Device information This function provides you with information on the hardware and software components of the instrument. The momentary values of all the internal and external inputs can also be checked. The control knob can be rotated to display every single table. The function is terminated by pressing the control knob. - Page 63 8 Device Manager Info Module 1 = bottom module slot Module 2 = middle module slot Module 3 = top module slot Date and time of last reconfiguration Switching state of relay 1 (fitted as standard); 0= not switched Hardware Bottom module slot Middle module slot Top module slot...
- Page 64 8 Device Manager Module 1 The picture below shows a module that has been fitted with 6 analog inputs. Depending on the hardware level, the picture may look different. Module 1 is in the bottom module slot. The * indicates that an offset or fine calibration is Display of the current active on this channel.
- Page 65 8 Device Manager Module 3 The picture below shows a module that has been fitted with a relay card (6 relays). Depending on the hardware level, the picture may look different. Module 3 is in the top slot. Switching state of relays (0 = not switched).
- Page 66 8 Device Manager Eth. info 1 Information about the current Ethernet configuration Eth. info 2 Information about the current Ethernet communication Parameter Description Ethernet status 1 Received Ethernet packets Ethernet status 2 Received Ethernet packets with errors Transmitted Ethernet packets Ethernet status 3 Ethernet status 4 Transmitted Ethernet packets with errors...
-
Page 67: Device Audit Trail
8 Device Manager Description Parameter Received TCP packets Ethernet status 5 Received TCP packets with errors Ethernet status 6 Ethernet status 7 Transmitted TCP packets Ethernet status 8 Transmitted TCP packets with errors Received Lease time, in seconds Ethernet status 9 USB info Information appears in the window via the USB interfaces. -
Page 68: Configuration
8 Device Manager Configuration This function can be used to alter the configuration of the recorder. v B 706581.0. An alteration of the configuration results in the current recording being closed down and the new data being recorded in a separate time frame from the “old”... -
Page 69: Service
8 Device Manager Service The “Service” functions will also not be available if no user is logged in, or the user who is logged in does not possess access rights for these functions. Config. -> The current configuration can be saved within the device as the new factory factory settings setting. - Page 70 8 Device Manager...
-
Page 71: Entering Text And Values
9 Entering text and values Text entry 9.1.1 Entering characters If a Text entry field is selected, and then activated by pressing the control knob, then a text can be entered or altered. The cursor (position marker) is at the end of the current setting. The active key or function that will be performed when the control knob is pressed is shown in blue. - Page 72 9 Entering text and values Character h Move the cursor onto the required character, and press the control knob. entry Another selection window will open. Reject entry Upper case letter Lower case letter h Rotate the control knob to select upper case (capital) or lower case (small) letters, or reject an entry, and activate/confirm the choice by pressing the control knob.
-
Page 73: Insert Spaces
9 Entering text and values Select h Select “ ” and press the control knob. temperature All the temperature units that can be selected will now be shown. For better unit legibility, the degree sign (°) and the unit of measure (C or F) are separated, and must be individually selected. -
Page 74: Reject Entry
9 Entering text and values 9.1.7 Reject entry h Select the “Cancel” button ( ) and press the control knob. Character entry will now be ended. The text that was entered is not accepted, and the dialog window is closed. The previously active setting is retained. Entry via selection field If a selection field is selected, and then activated by pressing the control knob, then the text (value) can be entered from a previously defined list. -
Page 75: Entering Values
9 Entering text and values Entering values 9.3.1 Whole numbers (integers) There are two possibilities for entering integer numbers: - selection by altering the individual digits of a number, or - selection by incrementing and decrementing. Digit-by-digit For this entry, each digit of the number (units, tens, ...) and the sign are entry of an selected with the control knob. -
Page 76: Real Numbers (Floating Point)
9 Entering text and values 9.3.2 Real numbers (floating point) To enter real numbers (with a decimal point), each digit of the number (units, tens, etc.), the decimal point position, and the sign are selected with the control knob. Sequence - Position the cursor. -
Page 77: Web Server
10 Web server The web server functionality depends on the software version of the device. Which device software version is installed? v Chapter 8.3 "Device information" Up to 187.03.xx v Chapter 10.1 "General" to Chapter 10.5 "QuadView" As of 187.04.xx v Chapter 10.6 "General information"... -
Page 78: General
10 Web server 10.1 General The web server is integrated in the paperless recorder as a standard feature. Four different modes of presentation are available: "Online Visualization (All Visualizations Except Batches)" "Three freely programmable HTML pages" "Online Visualization of Current Batch Reports" "QuadView"... - Page 79 10 Web server Home page Online visualization automatically comes up as the home page if the web server is started by the browser or, if it has already been activated, the user (left) clicks the "Recorder" link. Areas The web server's display is divided into three areas: - Header - Navigation - Visualization area...
- Page 80 10 Web server Navigation Configurable device name; read automatically Online visualization v Chapter 10.2 Three freely programmable HTML pages; created with the setup program v Chapter 10.3 Online visualization of current batch reports v Chapter 10.4 Start of QuadView Configuration of QuadView v Chapter 10.5 Individual pages can be brought up by clicking (left mouse button).
-
Page 81: Online Visualization (All Visualizations Except Batches)
10 Web server 10.2 Online Visualization (All Visualizations Except Batches) Data that are displayed correspond to the configured groups of the recorder. Next group Next channel History Groups Visualization Alarm/event list The sample screen shows the web server's home page. This page can be used to represent channels in the same manner as on the recorder's screen. - Page 82 10 Web server Example Switching to bar graph presentation h (Left) click the Visualization menu. h (Left) click the bar graph. Result: The bar graph visualization type is activated.
-
Page 83: Three Freely Programmable Html
10 Web server 10.3 Three freely programmable HTML pages The sample screen shows one of three freely programmable HTML pages. These pages can be created and modified with the setup program. Further information can be obtained from the instructions on the setup program (B 706581.6). -
Page 84: Online Visualization Of Current Batch Reports
10 Web server 10.4 Online Visualization of Current Batch Reports When batch pages of a plant are called up, the current data from the recorder is read and displayed. Batch recording is active or inactive Editable text field; (left) click and enter text The "Appendix"... -
Page 85: Quadview
10 Web server 10.5 QuadView Visualization for up to four devices is possible with QuadView. The visualizations may involve one device or up to four different ones. Different visualizations can be activated for each display (for example two views of a device, curve presentation and bar graph display). - Page 86 10 Web server Result: IP addresses (or DNS names) that have been entered are saved as cookies in the PC and remain intact until cookies are deleted (forexample by the PC browser). h Click "Start" or "Start visualization". Result: QuadView starts. In the example shown here, two different recorders are accessed (recorder 1 top left and top right, recorder 2 bottom left and bottom right).
- Page 87 10 Web server Unlike a normal online visualization, the header contains modified buttons. View all four visualizations View only top left visualization View only top right visualization View only top right visualization View only bottom right visualization QuadView...
-
Page 88: General Information
10 Web server 10.6 General information The web server is integrated into the paperless recorder as standard. Three different display types are available: "Online Visualization (All Visualizations Except Batches)" "Online Visualization of Current Batch Reports" "QuadView" The web server can be queried from the PC with the following programs (among others) without a SVG viewer having to be installed. - Page 89 10 Web server Start page The start page is automatically shown after a successful logon. Distribution The display of the web server is divided into two areas: - Navigation - Visualization area Navigation Start and configuration of the 4-fold view (QuadView) v Chapter 10.9 Online visualization of the current batch reports...
-
Page 90: Online Visualization (All Visualizations Other Than Batches)
10 Web server Visualization The visualization area shows the current data from the paperless recorder. Up- area dating occurs automatically through the web server. 10.7 Online visualization (all visualizations other than batches) The operation conforms to the operation as described in Chapter 10.2. -
Page 91: Online Visualization Of The Current Batch Reports
10 Web server 10.8 Online visualization of the current batch reports If batch reports from a plant are requested then the current data is extracted from the recorder and shown. Display available batch report Click text edit fields (marked in yellow) with the left mouse button and enter text (once authorization has been obtained) The "attachment"... -
Page 92: Quadview
10 Web server 10.9 QuadView Up to four devices can be visualized with the 4-fold view (QuadView). This ap- plies to the same device or to two to four different devices. For each display, different visualizations can be activated (e.g. the curve presentation and the bar graph display of a device in two views). - Page 93 10 Web server Delete configu- ration By left-clicking "[-]" the configuration will be deleted and new addresses can be entered.
- Page 94 10 Web server...
-
Page 95: Appendix
11 Appendix 11.1 Bar code 11.1.1 Batch control Plant 1 Plant 2 Plant 3 Start Stop Reset entry... -
Page 96: Batch Texts
11 Appendix 11.1.2 Batch texts Product name SUPER PRODUCT NORMAL PRODUCT TOOTHED DISK 34 AXIS ROD 45 Product 645736 numbers 012876... - Page 97 11 Appendix 345435 Job numbers A83737 A4555455 A455445 Personnel 4576 number 7665...
- Page 98 11 Appendix...
- Page 99 12 Index Numerics 1-channel presentation 4-fold view Alarm and event lists – Alarm limits Alarm lists Arrangement of the documentation Audit trail Backup -> CF card Bar code Bar graph presentation – – Batch analyze automatic start change edit Batch start/stop Batch status Batches Start manually...
- Page 100 12 Index Curve presentation – Data readout via interface with a CF memory card Device Information Device Manager Device manager Diagram header Diagram view Display Display off Displays and controls Edit batch Electrostatic discharge (ESD) Entering values Eth. info Event lists Event mode Ext.
- Page 101 12 Index Info Installation Instructions Instrument documentation in printed form Instrument documentation in the form of PDF files Integrators Introduction IP address Keys Log-in Log-in and Log-out Log-out Max. value Memory manager Memory managers Memory presentation Module Normal display Normal mode Note signs Numerical measurement display Operating mode...
- Page 102 12 Index Power LED Presentation modes – Process image presentation QuadView – Report Report step-on Returning Rights Sampling rate Save all + update CF card Screen saver Screen texts Scroll Search Service Stainless steal stainless steel Status bar Status LED Symbols Text entry –...
- Page 103 12 Index logged in logged out Standard (default) password Standard (default) user Version vertical presentation Visualization Visualization window Warning signs Warranty Web server Writing configuration data to CF card / reading from CF card Zoom...
- Page 104 12 Index...
- Page 108 JUMO GmbH & Co. KG JUMO Instrument Co. Ltd. JUMO Process Control, Inc. Street address: JUMO House 6733 Myers Road Moritz-Juchheim-Straße 1 Temple Bank, Riverway East Syracuse, NY 13057, USA 36039 Fulda, Germany Harlow - Essex CM20 2DY, UK Phone:...
Need help?
Do you have a question about the LOGOSCREEN nt and is the answer not in the manual?
Questions and answers