PerkinElmer FL 6500 Installation Instructions Manual
Fluorescence spectrometer
Hide thumbs
Also See for FL 6500:
- Installation instructions manual (6 pages) ,
- Installation instructions manual (28 pages) ,
- Installation instructions manual (10 pages)
Advertisement
Quick Links
FL 6500/ 8500 I ntegrating Sphere I nstallation
This instruction sheet describes the installation of this accessory which is used with the FL 6500/8500
Fluorescence Spectrometer.
Read these instructions before you install this accessory.
NOTE:
Contacting P erkinElm er
Supplies, replacement parts, and accessories can be ordered directly from PerkinElmer, using the part
numbers.
See our website:
http://perkinelmer.com
PerkinElmer's catalog service offers a full selection of high-quality supplies.
To place an order for supplies and many replacement parts, request a free catalog, or ask for
information:
If you are located within the U.S., call toll free 1-800-762-4000, 8 a.m. to 8 p.m. EST. Your order will
be shipped promptly, usually within 24 hours.
If you are located outside of the U.S., call your local PerkinElmer sales or service office.
Features
• Used for getting Quantum Yield
• Available sample type: Powder/Liquid
• Provide the Simplification and the de Mello's method
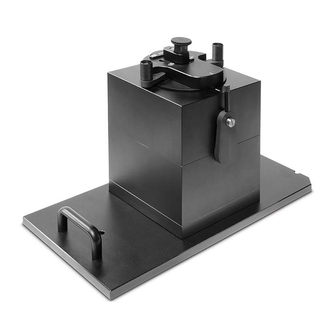
Figure 1 FL 6500/8500 Integrating Sphere [P/N:N4201017]
I nstructions
PerkinElmer, 710 Bridgeport Avenue,
09931483B
Shelton, CT 06484-4794, U.S.A
Produced in the USA.
Advertisement

Related Manuals for PerkinElmer FL 6500


Summary of Contents for PerkinElmer FL 6500
- Page 1 09931483B FL 6500/ 8500 I ntegrating Sphere I nstallation I nstructions This instruction sheet describes the installation of this accessory which is used with the FL 6500/8500 Fluorescence Spectrometer. Read these instructions before you install this accessory. NOTE: Contacting P erkinElm er Supplies, replacement parts, and accessories can be ordered directly from PerkinElmer, using the part numbers.
-
Page 2: Dimensions And Specifications
09931483B Dim ensions and Specifications Physical characteristic Specification Outline Dimensions (mm) 130 x 267 x 170 (WDH) Weight 2.86 Integrating Sphere Diameter (mm) 101.6 Sample Holder size 12.5 x 12.5 Connectable Cells Description Standard cell, 10 x 10 mm Micro cell, 10 x 10 mm Configuration of the I ntegrating Sphere Figure 2 Integrating Sphere Configuration Figure 3 Quartz Cell with Low Profile Stopper [P/N: N4202030]... -
Page 3: Installation
Figure 4 Lid and Cell Holder Cap I nstallation 1. Prepare the FL 6500/8500 Fluorescence Spectrometer to install this accessory. 2. Connect the power cord and the communication cable. 3. Loosen the accessory fixing bolt and remove the current sample accessory. - Page 4 09931483B 6. After checking the pogo pin position of the sample compartment, place the Integrating Sphere into the pogo pin well. Figure 8 Install the Accessory 7. Tighten the accessory fixing bolt. Figure 9 Tightening the Accessory Fixing Bolt 8. Remove the lid part of the Integrating Sphere and separate the cell holder cap. Figure 10 Remove the Lid Part 9.
- Page 5 09931483B Correction Spectra for I ntegrating Sphere When using the integrating Sphere for the first time, a correction factor for the integrating NOTE: sphere must be created and stored. The spectrum could be altered because of light scattering, or instrumental condition like lamp fluctuation.
- Page 6 09931483B 3. After setting parameters as below picture, click the Max RFU icon. When the Max RFU measurement is finished, click the Start button. 4. When the pop-up window appears, place the Rhodamine 101 triangular cell in the integrating sphere, Click Yes to start measurement. NOTE: The mounting direction of Rhodamine 101 is as follows.
- Page 7 09931483B 5. After the measurement is finished, select the measured graph and click the Save Correction button. 6. Click Yes to the Ex Correction factor for Integrating Sphere. NOTE: Be careful not to save the file name as an existing EX.cor.
- Page 8 09931483B 7. After saving the excitation correction factor for Integrating Sphere, select Synchronous (Low) in the Scan Mode of the Spectrum Correction Settings tab. 8. Click Start. When pop up window appears, click OK. 9. Select the saved excitation factor for the integrating sphere and click Open.
- Page 9 09931483B 10. When the pop up window appears, after shaking the prepared MgO diffuser well and mount it. Click Yes. 11. When the measurement is completed from 200 to 600 nm, the following pop-up window will appear. Click OK and select the saved EM. cor File in the existing device.
- Page 10 09931483B 12. Confirm that data of 600 ~ 850 nm is added. 13. Select the measured Synchronous spectrum and click Save Correction button. 14. Click Yes to save the Emission Correction factor for Integrating Sphere. NOTE: Be careful not to save the file name as an existing EM.cor.
- Page 11 09931483B 2. How to apply the correction factor in measurement 1. Execute the Spectrum FL software. 2. Select the Quantum Yield mode. 3. When setting parameters, select File in the Ex.corr tab. 4. Click the File select button and select the saved correction factor file. Click OK.
- Page 12 09931483B 5. Apply the correction factor in the same way as in steps 3-4 for the Emission. M easurem ent Perform the measurements according to the purpose of the experiment. • Absolute mode: Simplification method Quantum yield = Ec/(La-Lc) 1. Double click on the Spectrum FL software.
- Page 13 09931483B 2. Check the recognition of Accessory. 3. Click Quantum Yield mode. 4. Select Absolute Calc Mode and Simplification Calc Method in the Data Collection tab. 5. Set up the measurement parameters in turn. In Absolute mode, select File from Ex. Corr and Em. Corr tab, then select the correction factor NOTE: for integrating sphere.
- Page 14 09931483B 13. Enlarge the graph intersection. 14. Check the intersection value and separates the excitation and emission areas of each graph based on the intersection value. 15. When the area is set, the Quantum yield value is automatically calculated and displayed. 16.
- Page 15 09931483B 1. Double click on the Spectrum FL software and select the measurement mode. 2. Check the recognition of Accessory. 3. Click the Quantum Yield mode. 4. Select Absolute Calc Mode and De Mello Calc Method in the Data Collection tab. 5.
- Page 16 09931483B 11. Turn the knob to Indirect position, select OK. 12. Turn the Knob to Direct position, select OK. 13. Confirm the spectrum and results. 14. Calculate the quantum yield in the result window. 15. Enlarge the graph intersection. 16. Check the intersection value and separates the excitation and emission areas of each graph based on the intersection value.
- Page 17 09931483B 17. When the area is set, the Quantum yield value is automatically calculated and displayed. • Relative Quantum Yield Relative Quantum Yield method is not required an Integrating Sphere accessory. This method is determined by comparing the reference with known quantum yield with the sample in question. And it is needed Absorbance and Refractive Index values.
- Page 18 09931483B 5. Set up the measurement parameters. In Relative Quantum Yield mode, select On from Ex. Corr and Em. Corr tab. NOTE: 6. Select sample table Tab and add the sample. One of the samples must be set to standard, and the Absorbance, Refractive and Quantum Yield NOTE: values must be entered.
Need help?
Do you have a question about the FL 6500 and is the answer not in the manual?
Questions and answers