Hioki PW3390 Instruction Manual
Power analyzer
Hide thumbs
Also See for PW3390:
- Measurement manual (2 pages) ,
- Instruction manual (108 pages) ,
- Firmware update procedures (2 pages)
Table of Contents
Advertisement
Quick Links
Advertisement
Table of Contents

Related Manuals for Hioki PW3390


Summary of Contents for Hioki PW3390
-
Page 3: Table Of Contents
Contents Contents Introduction.................1 Confirming Package Contents............2 Safety Notes................4 Usage Notes................7 Chapter 1 Overview __________________________________ 11 Product Overview.............. 11 Features................12 Operating Overview ............14 Chapter 2 Names and Functions of Parts, Basic Operations & Screens__________________ 15 Names and Functions of Parts.......... 15 Basic Operations............... - Page 4 Viewing Efficiency and Loss Measurement Values ..89 4.7.1 Displaying Efficiency and Loss ..........89 4.7.2 Selecting the Calculation Formula ......... 90 4.7.3 Measurement Examples ............91 Viewing Motor Measurement Values (Model PW3390-03 only) ..........94 4.8.1 Motor Input Settings............... 96...
- Page 5 Contents 4.8.2 Measuring Motor Electrical Angle......... 102 4.8.3 Detecting the Motor Rotation Direction......... 105 Chapter 5 Operating Functions _______________________ 107 Timing Control Functions ..........107 Averaging Function ............110 Data Hold and Peak Hold Functions....... 112 5.3.1 Data Hold Function............... 112 5.3.2 Peak Hold Function ..............
- Page 6 7.11.3 Deleting Files and Folders ........... 154 7.11.4 Renaming Files and Folders ..........155 Chapter 8 Connecting External Devices ________________ 157 Connecting Multiple PW3390 (Synchronized Measurements) ........157 Controlling Integration with External Signals ....161 Using Analog and Waveform D/A Output ....... 164 8.3.1...
- Page 7 Contents 10.3 Functions Specifications ..........199 10.4 Setting Specifications............204 10.5 Measurement Item Details ..........207 10.6 Calculation Formula Specifications......... 210 10.7 Wiring System Diagram Specifications ......217 Chapter 11 Maintenance and Service ___________________ 219 11.1 Cleaning................219 11.2 Trouble Shooting............. 219 11.3 Error Indication..............
- Page 8 Contents...
-
Page 9: Contents
Introduction Introduction Thank you for purchasing the Hioki PW3390 Power Analyzer. To obtain maximum performance from the product, please read this manual first, and keep it handy for future reference. To measure current, the power analyzer requires clamp-on current probes or AC/DC current probes (Options, (p. -
Page 10: Confirming Package Contents
When you receive the instrument, inspect it carefully to ensure that no damage occurred during shipping. In particular, check the accessories, panel switches, and connectors. If damage is evident, or if it fails to operate according to the specifications, contact your authorized Hioki distributor or reseller. Confirm that these contents are provided. - Page 11 • 9728 PC Card 512M (512 MB CF Card + Adapter) • 9729 PC Card 1G (1 GB CF Card + Adapter) • 9830 PC Card 2G (2 GB CF Card + Adapter) • 9794 Carrying Case (PW3390 dedicated hard type) • Special-order: Rack mounting hardware (EIA/JIS)
-
Page 12: Safety Notes
Safety Notes Safety Notes This instrument is designed to comply with IEC 61010 Safety Standards, and has been thoroughly tested for safety prior to shipment. However, mishandling dur- ing use could result in injury or death, as well as damage to the instrument. How- ever, using the instrument in a way not described in this manual may negate the provided safety features. - Page 13 Safety Notes Other symbols Symbols in this manual Indicates the prohibited action. (p. ) Indicates the location of reference information. Indicates quick references for operation and remedies for troubleshooting. Indicates that descriptive information is provided below. Menus, commands, dialogs, buttons in a dialog, and other names on the screen and the keys are indicated in brackets.
- Page 14 Safety Notes Measurement categories This instrument complies with CAT II (1000 V) and CAT III (600 V) safety requirements. To ensure safe operation of measurement instruments, IEC 61010 establishes safety standards for vari- ous electrical environments, categorized as CAT II to CAT IV, and called measurement categories. CAT II Primary electrical circuits in equipment connected to an AC electrical outlet by a power cord (portable tools, household appliances, etc.) CAT II covers directly measuring electri-...
-
Page 15: Usage Notes
Before use Before using the instrument the first time, verify that it operates normally to ensure that the no damage occurred during storage or shipping. If you find any damage, contact your authorized Hioki distributor or reseller. Before using the instrument, make sure that the insulation on the voltage cords is undamaged and that no bare conductors are improperly exposed. - Page 16 Troubleshooting section "11.2 Trouble Shooting" (p. 219) and Error Indi- cations section "11.3 Error Indication" (p. 222) before contacting your authorized Hioki distributor or reseller. • To avoid damage to the instrument, protect it from physical shock when transporting and handling.
- Page 17 Usage Notes Handling the cords and current sensors Connect the current sensors or voltage cords to the instrument first, and then to the active lines to be measured. Observe the following to avoid electric shock and short circuits. • Do not allow the voltage cord clips to touch two wires at the same time. Never touch the edge of the metal clips.
- Page 18 Contact your authorized Hioki distributor or reseller as soon as possible. Continuing to use the instrument may result in fire or electric shock.
-
Page 19: Chapter 1 Overview
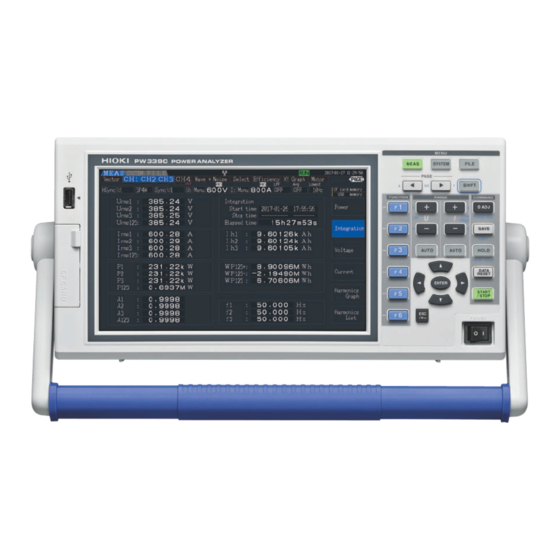
Chapter 1 Overview 1.1 Product Overview The Hioki PW3390 Power Analyzer is a high-precision, broad-range instrument for measuring electrical power from DC to inverter frequencies. Four input channels are provided to support single- and three- phase inverter motor system measurements. -
Page 20: Features
1.2 Features 1.2 Features Supports multiple power system configurations • Four isolated voltage and current input channels are provided to support simultaneous multi- system measurements such as inverter primary and secondary power. • Measure power system wiring configurations from single-phase to three-phase, four-wire. •... - Page 21 • With the instrument connected to a computer by LAN, USB cable, or RS-232C, use the PC application program to acquire data on the computer and control the instrument remotely. Download the PC application program from Hioki's website. (http://www.hioki.com) • Even without the PC application program, the same operations can be performed using a browser to access the HTTP server function.
-
Page 22: Operating Overview
1.3 Operating Overview 1.3 Operating Overview Be sure to read "Usage Notes" (p. 7) before measuring. Follow the procedures below to perform measurements. Data saving and analysis on the computer can be performed as necessary. Initial Instrument Preparations 3.2 ( p.26) Pre-Operation Inspection Always perform these checks before connect- ing, and when turning the power on. -
Page 23: Names And Functions Of Parts, Basic Operations & Screens
2.1 Names and Functions of Parts Names and Functions of Parts, Basic Operations Chapter 2 & Screens 2.1 Names and Functions of Parts Handle Front Use to carry the instrument, and fold it down to serve as a stand. Bottom part of this page USB memory interface Operation keys Connect a USB flash drive storage device. - Page 24 2.1 Names and Functions of Parts Operation keys MENU keys (Screen selection) Press a key to select a screen (the lit key indicates the current selection). Displays the Measurement screen for viewing measurement values. Voltage and cur- rent ranges can be selected, and low-pass filter settings can be changed. (p.
-
Page 25: Output Terminal
185 p. 184 Rear side CH A torque signal input BNC jack Power inlet Connect the Hioki L9217 BNC connection cable to Voltage input terminals this terminal (PW3390-03 [model with motor anal- Connect the supplied power Connect Hioki-specified voltage ysis and D/A output] only). -
Page 26: Basic Operations
2.2 Basic Operations 2.2 Basic Operations To select a display screen To select the displayed screen page Press the keys to change. Press , or to display the corre- p. 21, p. 23 sponding screen. p. 21 to p. 23 Help comment To select and change display contents and settings Describes the object at the current... -
Page 27: Display Items And Screen Types
2.3 Display Items and Screen Types 2.3 Display Items and Screen Types 2.3.1 Common Display Items These items are displayed on every screen. Displayed Screen Displayed Page Operating State Indicators Key-Lock Indicator Time Display Interface Indicators Storage Media Indicators Storage Media Indicators Time Display Level indicators for the CF card and USB memory Displays the current date and time. -
Page 28: Measurement Screen
2.3 Display Items and Screen Types 2.3.2 Measurement Screen These display items appear only on the Measurement screen. Δ-Y Transform Low-pass filter Harmonic sync Sync source source Wiring mode Voltage range Current range Lower measurement limit Peak Over display indicators Average Sync Unlocked Current peak over range... -
Page 29: Screen Types
1 to 4 as numerical values and as vectors. harmonic graphs and lists for each channel. [Motor] [Wave + Noise] Displayed only on the PW3390-03 (model with motor analysis and D/A output). This page displays measured values for the This page displays voltage, current, and noise motor analysis. - Page 30 Make detailed measurement criteria settings Make D/A output-related settings on this page. on this page. [Motor] [Calc] Displayed only on the PW3390-03 (model with motor analysis and D/A output). Make motor measurement-related settings Make calculation-related settings on this page. on this page.
- Page 31 2.3 Display Items and Screen Types Press the keys to change the screen page as follows. To previous page [System] [Time] Configure system environment settings Set measurement timers and the number and perform system reset on this page. of parameters to save on this page. [Interface] Make settings related to synchronization, data saving and interfaces on this page.
- Page 32 2.3 Display Items and Screen Types...
-
Page 33: Measurement Preparations
3.1 Operations in general Measurement Chapter 3 Preparations 3.1 Operations in general Apply the appropriate adhesive labels to the Initial Instrument Preparations voltage cords and current sensors. Then bun- dle the voltage cables together with the spiral 3.2 ( p.26) tubes. -
Page 34: Initial Instrument Preparations
3.2 Initial Instrument Preparations 3.2 Initial Instrument Preparations Perform the following before starting measurement the first time. Put the provided input cord labels for each voltage cord and current sensor The labels are provided to clearly indicate which cable connects to each input jack. Before applying the labels Wipe any dust from the surface of the voltage measurement cables and current sensors, and ensure that it is dry. - Page 35 3.2 Initial Instrument Preparations Procedure Hold two cable leads (one each red and black) side-by-side. Start bundling from one end of the leads. Wind the spiral tube around the leads. Wrap the two leads together with the spiral tube. The five supplied spiral tubes should be applied with suitable spacing.
-
Page 36: Pre-Operation Inspection
3.3 Pre-Operation Inspection Before using the instrument the first time, verify that it operates normally to ensure that the no damage occurred during storage or shipping. If you find any damage, contact your authorized Hioki distributor or reseller. Pre-connection inspection... -
Page 37: Connecting The Power Cord
3.4 Connecting the Power Cord 3.4 Connecting the Power Cord Be sure to read the "Usage Notes" (p. 7) before connecting power. Connect the power cord to the power inlet on the instrument, and plug it into an outlet. Connection Procedure Power Inlet Check that the instrument’s power switch is turned off. -
Page 38: Connecting The Voltage Measurement Cables
3.6 Connecting the Voltage Measurement Cables 3.6 Connecting the Voltage Measurement Cables Be sure to read the "Usage Notes" (p. 7) before connecting measurement cables. Plug the voltage measurement cable leads into the voltage measurement jacks on the instrument (the number of connections depends on the lines to be measured and selected wiring mode). - Page 39 Current sensors with a black plastic connector (whose model numbers lack the -05) can be connected to the instrument’s current input terminal by using the optional CT9900 Conversion Cable. PW3390 side CT9900 Conversion Cable When connecting the CT6865 (rated for 1000 A) or CT6846 (rated for 1000 A) with the CT9900 Conver-...
- Page 40 The CT7642, CT7742, CT7044, CT7045, and CT7046 Current Sensors can be used to measure large currents of 1000 A and greater. When using these current sensors, connect them to the instrument via the CT9920 Conversion Cable. PW3390 side CT9920 Conversion Cable Current sensor side When connecting a sensor via the CT9920 Conversion Cable, it is necessary to configure a setting to select the current sensor being used.
-
Page 41: Turning The Power On And Off
2. Disconnect the power cord and all cables from the instrument. 3. Contact your authorized Hioki distributor or reseller. For best precision, after turning on the instrument, allow a warm-up period of at least 30 minutes to elapse before performing zero-adjustment. -
Page 42: Selecting The Wiring Mode
3.9 Selecting the Wiring Mode 3.9 Selecting the Wiring Mode Select the wiring mode to match the phase system(s) to be measured. Eight wiring modes are available. To open the [Wiring] page Press the key and select the [Wiring] page with the To select the wiring mode Press the key to select... - Page 43 3.9 Selecting the Wiring Mode Wiring configuration diagram Wiring Mode 1. Single-phase, 2-wire (1P2W) × Wiring configuration diagram Pages p.217 and p.218 for additional wiring diagrams. Wiring Mode 2. Single-phase, 3-wire (1P3W) + single-phase, 2-wire (1P2W) × Wiring Mode 3. 3-phase, 3-wire (3P3W2M) + single-phase, 2-wire (1P2W) ×...
- Page 44 3.9 Selecting the Wiring Mode Wiring Mode 4. Single-phase, 3-wire (1P3W) × Connection diagrams Connection diagrams can also be found on p.217 and p.218. Wiring Mode 5. 3-phase, 3-wire (3P3W2M) + single-phase, 3-wire (1P3W) Wiring Mode 6. 3-phase, 3-wire (3P3W2M) ×...
- Page 45 3.9 Selecting the Wiring Mode Wiring Mode 7. 3-phase, 3-wire (3P3W3M) + single-phase, 2-wire (1P2W) Wiring Mode 8. 3-phase, 4-wire (3P4W) + single-phase, 2-wire (1P2W) Wiring Description Select this wiring mode when measuring DC lines. 1P2W Single-phase, 2-wire 1P3W Single-phase, 3-wire -...
-
Page 46: Setting The Current Sensors
3.10 Setting the Current Sensors 3.10 Setting the Current Sensors Selecting the current sensors in use If a CT7044, CT7045, CT7046, CT7642, or CT7742 large current sensor has been connected to the instrument's current input terminal via the CT9920 Conversion Cable, set the model or output rate of the current sensor in use. - Page 47 3.10 Setting the Current Sensors Configuring current sensor phase correction Generally speaking, phase error tends to increase gradually for current sensors in the high-frequency domain of the frequency band (see illustrative figure below). Power measurement error in the high-frequency domain can be reduced by using information about the sensor’s unique phase characteristics to correct phase error.
- Page 48 3.10 Setting the Current Sensors Determine the frequency and phase difference for the sensor to which correction is being applied based on the table of current sensor phase characteristics (Reference: "Configuring current sensor phase correction" (p. 39)). (Refer to the “Frequency” column for the frequency and the “Input/output phase difference representative values” column for the phase difference.) Example for CT6862: To set a frequency of 300.000 kHz and a phase difference of -10.96°...
-
Page 49: Attaching To The Lines To Be Measured And Zero Adjustment
• If the instrument is equipped with motor analysis functionality, zero adjustment is not applicable for analog DC input on channels A and B. Perform the special zero adjustment from the Motor screen. "4.8 Viewing Motor Measurement Values (Model PW3390-03 only)" (p. 94) Attach voltage measurement cables to measurement lines Example:... - Page 50 For accurate measurements, settings such as range and sync source must be properly config- ured. Executing quick setup automatically configures the following settings to the Hioki-recom- mended values for the selected wiring mode (phase system): voltage and current ranges, sync source, lower measurement frequency limit, integration mode, harmonic sync source and rectifi- cation system.
-
Page 51: Verifying Correct Wiring (Connection Check)
3.12 Verifying Correct Wiring (Connection Check) 3.12 Verifying Correct Wiring (Connection Check) Correct attachment to the lines is necessary for accurate measurements. Refer to the measured values and vector displays to verify that the measurement cables are correctly attached. For 1P2W systems For systems other than 1P2W •... - Page 52 3.12 Verifying Correct Wiring (Connection Check)
-
Page 53: Viewing Measurement Values
4.1 Measurement Value Display Procedure Viewing Measurement Chapter 4 Values 4.1 Measurement Value Display Procedure The following procedure displays measurement values. Display Procedure (the following shows 1P2W wiring mode) Display the page [CH] Use the keys to select display contents Displays the Harmonic Graph or Harmonic List. - Page 54 4.1 Measurement Value Display Procedure Selecting Measured Items for Display From all measured items, select those you want to display on one screen. Press to display the [Select] page. First press an key to select the number of items to be displayed. 4 Items Display 8 Items Display 16 Items Display...
- Page 55 4.1 Measurement Value Display Procedure Display Item Selection Procedure Display the [Select] page (a blinking cursor appears) Move the cursor to the item to change Accept (the pull-down menu appears) Select the item to display Enter Cancel Press when finished making changes.
- Page 56 4.1 Measurement Value Display Procedure About Valid and Displayable Ranges The valid measurement range (the range of guaranteed accuracy) is 1% to 110% of the full-scale range (except that valid voltage is limited to 1000 V in the 1500 V scale). The display range of this unit is between the zero surpress level to 120% of the measurement range.
-
Page 57: Viewing Power Measurements, And Changing The Measurement Configuration
4.2 Viewing Power Measurements, and Changing the Measurement Configuration 4.2 Viewing Power Measurements, and Changing the Measurement Configura- tion 4.2.1 Displaying Power Measurements When viewing power measurements, [Power], [Voltage], and [Current] are displayed so that measured values can be confirmed. Press to display the Measurement screen, and select the desired [CH] page with the... - Page 58 4.2 Viewing Power Measurements, and Changing the Measurement Configuration Displaying Voltage Press . The screen shows settings for Wiring mode 7, (3 phase 3 wire (3P3W3M)+1 phase 2 wire (1P2W)). Voltage Waveform Peak+ RMS Voltage Voltage Waveform Peak- Rectified Mean Value of RMS Conversion Simple Averaged Voltage Fundamental Voltage...
-
Page 59: Selecting Ranges
4.2 Viewing Power Measurements, and Changing the Measurement Configuration 4.2.2 Selecting Ranges Measurement ranges are selected as described below. • If the maximum voltage or current rating is exceeded, immediately stop mea- suring, shut off power to the measurement lines, and disconnect from the mea- surement object. - Page 60 4.2 Viewing Power Measurements, and Changing the Measurement Configuration Range Setting Procedure Ranges can be set on the following Measurement screen pages: [Vector], [CH] (any), [Wave + Noise], [Select], and [Input]. Change the range with the RANGE keys. For Manual range selection, press the key of RANGE keys to select the desired range.
- Page 61 4.2 Viewing Power Measurements, and Changing the Measurement Configuration Setting from the [Wave + Noise] Page of the Measurement Screen Display the [Wave + Noise] page Select [U/I] Select the channel to change Press the RANGE keys to select the range Press to display...
- Page 62 4.2 Viewing Power Measurements, and Changing the Measurement Configuration Setting from the [Input] Page of the Setting Screen Display the [Input] page Select the channel to change Press the RANGE keys to select the range (Changes the selected [U range] range]) To change the [U range]...
- Page 63 4.2 Viewing Power Measurements, and Changing the Measurement Configuration Auto-Ranging Span This setting determines auto-ranging behavior, and can be specified for each wiring system. Select [Wide] if the range changes frequently due to large fluctuations. • The measurement range increments by one when a Peak Over state occurs or when any RMS value exceeds 105% f.s.
-
Page 64: Selecting The Sync Source
4.2 Viewing Power Measurements, and Changing the Measurement Configuration 4.2.3 Selecting the Sync Source Select the source to determine the fundamental cycle (between zero crossings) on which various calcula- tions are to be based. As a general usage, for each wiring, select the voltage of the measurement channel for the channel mea- suring the alternating current, and 50 msDC for the channel measuring the direct current. - Page 65 4.2 Viewing Power Measurements, and Changing the Measurement Configuration Setting the Zero-Crossing Filter When U or I is selected, set the level of the zero-crossing filter. (Ex.) Set to display waveforms from “0”. When [OFF] is selected, accuracy is undetermined, so always select the Weak or Strong setting when viewing measurement values.
-
Page 66: Frequency Measurement Settings
4.2 Viewing Power Measurements, and Changing the Measurement Configuration 4.2.4 Frequency Measurement Settings By configuring U or I settings for each input channel, the instrument can simultaneously measure multiple frequencies in different wiring systems. Frequency Measurement Display System • 0.5000 Hz → 9.9999 Hz → 10.000 Hz → 99.999 Hz → 100.00 Hz → 999.99 Hz → 1.0000 kHz → 5.0000 kHz •... - Page 67 4.2 Viewing Power Measurements, and Changing the Measurement Configuration Setting the Lowest Measurement Frequency on the Setting Screen Display the [Input] page Select [Lowest freq] Select with the keys • The frequency measurement range is 0.5 Hz to 5 kHz (within the sync frequency range).
-
Page 68: Selecting The Rectification Method
4.2 Viewing Power Measurements, and Changing the Measurement Configuration 4.2.5 Selecting the Rectification Method Select the voltage or current rectification method to be used for calculating apparent power, reactive power, and power factor. Two rectification methods are selectable for each voltage and current input. Make this selection before measurement. -
Page 69: Setting Scaling (When Using Vt(Pt) Or Ct)
4.2 Viewing Power Measurements, and Changing the Measurement Configuration 4.2.6 Setting Scaling (when using VT(PT) or CT) Set the VT or CT ratio when using an external VT(PT) or CT. When a ratio has been set, [VT] [CT] is displayed above each range setting on the [CH] pages. -
Page 70: Setting The Low-Pass Filter
4.2 Viewing Power Measurements, and Changing the Measurement Configuration 4.2.7 Setting the Low-Pass Filter The instrument includes a low-pass filter function to limit the measurement frequency range. Enable the filter to remove harmonic components or extraneous noise when measuring. Filter cut-off frequency can be selected from the following four settings, and can be set differently for each wiring system. -
Page 71: Integration Value Observation
4.3 Integration Value Observation 4.3 Integration Value Observation 4.3.1 Displaying Integration Values Current (I) and active power (P) are integrated on all channels simultaneously. Positive, negative and total values are displayed. Displaying Integration Contents Press , select a channel [CH] with , then press Integration in progress... - Page 72 4.3 Integration Value Observation Before Starting Integration Verify that the clock is set correctly. "Clock" (p. 129) Select the integration mode. 4.3.2 ( p.66) Set the desired time control functions (interval, timer, and clock controls). 4.3.4 ( p.69) Set "OFF" for time settings when integrating manually. Make appropriate settings for saving to CF card, and when using the D/A output, as needed.
- Page 73 4.3 Integration Value Observation • Maximum integration time is 9999 hours, 59 minutes and 59 seconds, after which integration automatically stops. • Integration start, stop and reset by the operating keys and external control act on all integra- tion items simultaneously. •...
-
Page 74: Setting The Integration Mode
4.3 Integration Value Observation 4.3.2 Setting the Integration Mode Select the integration mode for each channel. Two choices are available for each wiring system. • Integrates RMS current and active power during every measurement interval (50 ms). RMS Mode • Each polarity is integrated only for active power. •... -
Page 75: Manual Integration Method
4.3 Integration Value Observation 4.3.3 Manual Integration Method This method starts and stops integration by manual operation. Procedure Displayed Integration Value Before starting integration Start Stop Reset Disable (set to ) the timer and clock timing [OFF] control settings. "Integration Combined with Timing Control" (p. 69) Retaining Start Time... - Page 76 4.3 Integration Value Observation Saving Integration Data at Each Interval During manual integration, integration values can be saved in combination with interval time. Measurement items selected as described in section "7.5.3 Selecting Measurement Items to Save" (p. 143) can be saved to CF card at the specified interval. Can be set in "Interface"...
-
Page 77: Integration Combined With Timing Control
4.3 Integration Value Observation 4.3.4 Integration Combined with Timing Control After specifying timer and clock settings, press to cause integration to start and stop at the speci- fied times. Integration can be controlled by the following three timing methods. Manually Controlled Integrated value Integration Start... - Page 78 4.3 Integration Value Observation Timer-Controlled Integration Integration is performed for the specified duration, and stops when the timer expires. Calculation results are held constant when the timer stops. If auto-saving is enabled, integration values are saved to CF card when integration starts and stops. If an interval time is also specified, total integration values up to that point are saved at each interval.
- Page 79 4.3 Integration Value Observation Clock-Controlled Integration After pressing , the instrument waits until the specified clock start time. Integration then begins and continues until the specified clock stop time. If auto-saving is enabled, integration values are saved to CF card at the specified start and stop times. If an interval time is also specified, total integration values up to that point are saved after each interval.
-
Page 80: Viewing Harmonic Measurement Values
4.4 Viewing Harmonic Measurement Values 4.4 Viewing Harmonic Measurement Values 4.4.1 Displaying the Harmonic Bar Graph The results of harmonic analysis of voltage, current and active power on the same channel can be dis- played as a bar graph. Numerical data for the cursor-selected order is also displayed. Press to display the Measurement screen. - Page 81 4.4 Viewing Harmonic Measurement Values Changing Display Settings Select the item Displays the pull-down Vertical axis display menu Maximum harmonic order to display Selects from the pull-down menu Displayed item Channels in the same wiring Enter Cancel Channel Changes channels in the same wiring system. (Example) In the 3P4W wiring CH1, CH2, CH3, CH123 Display...
-
Page 82: Displaying The Harmonic List
4.4 Viewing Harmonic Measurement Values 4.4.2 Displaying the Harmonic List The results of harmonic analysis of voltage, current and active power on the same channel can be displayed as a list. Press to display the Measurement screen. Press to select the desired [CH] page, and press Displayed... -
Page 83: Displaying Harmonic Vectors
4.4 Viewing Harmonic Measurement Values 4.4.3 Displaying Harmonic Vectors The voltage, current, and phase angle of each harmonic order are displayed in a vector plot showing the phase relationship between voltage and current. Numerical values for the selected order are also displayed. Press and then to select the... - Page 84 4.4 Viewing Harmonic Measurement Values Changing Display Settings Select the item (channel) Displays the pull-down menu Measurement Channel Selects from the pull-down menu Enter Cancel Measurement Change the channels to be displayed. Setting channels that are not used to Channel [OFF] can simplify the display.
-
Page 85: Selecting The Harmonic Sync Source
When DC100 ms is selected, 50 Hz is measured as the fifth-order harmonic, and 60 Hz as the sixth- order harmonic. Using an external signal as the sync source (PW3390-03) • This setting is available only when Motor analysis function is installed and CH B is set for pulse input. -
Page 86: Selecting The Thd Calculation Method
4.4 Viewing Harmonic Measurement Values 4.4.5 Selecting the THD Calculation Method Select whether to use THD-F or THD-R method to calculated total harmonic distortion. The selected cal- culation method is applicable to both harmonic voltage and current. The percentage of total harmonics relative to the fundamental waveform THD-F This setting is generally used in testing that conforms to IEC and other standards. -
Page 87: Viewing Waveforms
4.5 Viewing Waveforms 4.5 Viewing Waveforms 4.5.1 Displaying Waveforms Waveforms of voltage and current measured on up to four channels can be displayed separately accord- ing to voltage, current, or channel. Waveforms are sampled at 500 kS/s, with the displayed time span per screen determined by the timing of the harmonic sync source. - Page 88 4.5 Viewing Waveforms Displaying Separate Channel Waveforms [CH] Select (Separate Channel) Voltage Scale (Positive-only display) Current Scale (Negative-only display) Positive Peak Waveform Display En- Value (pk+) able/Disable (p. 81) Negative Peak Value (pk-) Waveform color ap- pears when enabled (ON). RMS (rms) •...
- Page 89 4.5 Viewing Waveforms Hiding and Displaying Waveforms Select whether to display or not display waveforms. Available settings are [U/I] and [CH]. Display waveforms Do not display waveforms Select the channel to change Displays the pull-down menu Selects from the pull-down menu Enter Cancel Sampling value for 500 kS/s...
-
Page 90: Resizing Waveforms
4.5 Viewing Waveforms 4.5.2 Resizing Waveforms Waveforms can be reduced and enlarged for convenient viewing, and to confirm details. Make this setting using the cursor keys on the [Wave + Noise] page. "4.5.1 Displaying Waveforms" (p. 79) Changing Vertical Axis Magnification Voltage and current waveforms can be vertically resized (magnification is the same for all channels). -
Page 91: Viewing Noise Measurement Values (Fft Function)
4.6 Viewing Noise Measurement Values (FFT Function) 4.6 Viewing Noise Measurement Values (FFT Function) Perform FFT analysis on a selected channel's voltage and current to display noise up to 200 kHz as a graph and as numerical values. This function is convenient for monitoring an inverter's carrier frequency, harmonic noise ingress on commercial power lines, or DC power. - Page 92 4.6 Viewing Noise Measurement Values (FFT Function) Displaying Waveforms and Noise The waveform to be analyzed and it's noise analysis results can be displayed at the same time. Noise Voltage Numerical Value Display the Wave + Noise page Wave + Noise Select Voltage and Current Waveforms Waveform Colors...
-
Page 93: Setting The Sampling Frequency And Points
4.6 Viewing Noise Measurement Values (FFT Function) 4.6.2 Setting the Sampling Frequency and Points Set the FFT sampling rate and number of points according to the frequency of the noise to be analyzed. These settings are on the [Calc] page of the Setting screen. Display the Calc page... -
Page 94: Setting The Minimum Noise Frequency
4.6 Viewing Noise Measurement Values (FFT Function) The highest frequency that can be analyzed depends on the sampling setting as follows. Sampling Rate 500 kS/s 250 kS/s 100 kS/s 50 kS/s 25 kS/s 10 kS/s Highest Frequency 200 kHz 50 kHz 20 kHz 10 kHz 5 kHz... - Page 95 4.6 Viewing Noise Measurement Values (FFT Function) Settings on the Setting Screen Display the Calc page Select the item Select with the keys A numerical noise value is recognized as a peak value when its amplitude is greater than the levels of the next lower- and higher-frequency points in voltage and current FFT calculation results, and the ten high- est peak values are acquired.
-
Page 96: Measurement Channel And Window Function Settings
4.6 Viewing Noise Measurement Values (FFT Function) 4.6.4 Measurement Channel and Window Function Settings Select the measurement channels and Window function for noise analysis calculations. Calc Display the page Select Analysis CH Window type Select with the keys What is a Window type? Noise analysis is performed by applying FFT calculations to a specific interval of a waveform defined by the specified number of points at the specified sampling rate. -
Page 97: Viewing Efficiency And Loss Measurement Values
4.7 Viewing Efficiency and Loss Measurement Values 4.7 Viewing Efficiency and Loss Measure- ment Values This instrument uses active power and motor power values to calculate and display efficiency (η [%]) and loss [W]. For example, inverter input-output efficiency and internal loss, and motor input-output efficient and loss, as well as total efficiency, can be calculated by a single instrument. -
Page 98: Selecting The Calculation Formula
4.7 Viewing Efficiency and Loss Measurement Values 4.7.2 Selecting the Calculation Formula η η η Up to three formulas ( 1 to 3, and Loss1 to Loss3) can be selected for Efficiency ( ) and Loss calcula- tions. Select the calculation items from all Pin and Pout active power values to be applied to the following formulas. -
Page 99: Measurement Examples
4.7 Viewing Efficiency and Loss Measurement Values 4.7.3 Measurement Examples Here is an efficiency and loss measurement example. Before measuring, perform the preparations in "Chapter 3 Measurement Preparations" (p. 25)), and make the appropriate connections and settings. Measuring Efficiency and Loss of a Switching Power Supply Example: The input and output sides of the switching power supply are connected to CH 1 and CH 2 of the instrument, respectively. - Page 100 4.7 Viewing Efficiency and Loss Measurement Values Measuring Efficiency and Loss of an Inverter Example: Inverter input is connected to CH 3, and the outputs are connected to CH 1 and CH 2 of the instrument. Connection Example Output side Input side Required items: •...
- Page 101 CH A. How to connect torque meter or tachometer, see 8.5 ( p.174). Connection Example Required items: Requires the PW3390-03 (model with motor analysis and D/A output). • L9438-50 Voltage Cord ×4 • 9272-05 Clamp On Sensor ×2 ....input side •...
-
Page 102: Viewing Motor Measurement Values (Model Pw3390-03 Only)
4.8 Viewing Motor Measurement Values (Model PW3390-03 only) 4.8 Viewing Motor Measurement Values (Model PW3390-03 only) Motor analysis can be performed using the PW3390-03 (model with motor analysis and D/A output). When the motor analysis function is installed, the [Motor] page appears on the Measurement and Setting screens. - Page 103 4.8 Viewing Motor Measurement Values (Model PW3390-03 only) Executing Zero Adjustment Execute zero adjustment to compensate for input signal bias before measuring analog DC voltage on CH A or CH B. If a non-zero value is displayed for torque or rotation rate when no torque or rotation is occurring, execute zero adjustment before applying any torque or rotation input.
-
Page 104: Motor Input Settings
4.8 Viewing Motor Measurement Values (Model PW3390-03 only) 4.8.1 Motor Input Settings Set to suit the motor to be measured, or the connected torque sensor or tachometer. "8.5 Using the Motor Testing" (p. 174) Basic Operating Procedure Motor Sync Source... - Page 105 4.8 Viewing Motor Measurement Values (Model PW3390-03 only) Selecting the Input Frequency Reference Source To calculate motor slip, select a reference source for measuring the motor input frequency. f1, f2, f3, f4 "4.2.4 Frequency Measurement Settings" (p. 58) Slip Calculation Formula...
- Page 106 4.8 Viewing Motor Measurement Values (Model PW3390-03 only) When [AnalogDC] is selected When [CHA input] is set to [AnalogDC], set these three items to suit the sensor: [CHA range], [CHA scaling], and [CHA unit]. ± Example: When the rated torque is 500N m and the torque sensor’s output range is...
- Page 107 4.8 Viewing Motor Measurement Values (Model PW3390-03 only) When [Freq] is selected When [CHA input] is set to [Freq], make these four settings to suit the sensor: [CHA unit], [Rated torque], [Freq range fc], and [Freq range fd]. Example 1: Using a torque sensor rated at 500 for an output span of 60 kHz ±20 kHz...
- Page 108 4.8 Viewing Motor Measurement Values (Model PW3390-03 only) Setting the Rotation Signal Input (CH B) Select the type of rotation signal to be applied to CH B CHB input Analog DC For DC voltage proportional to the rotation rate Pulses For pulse signals proportional to the rotation rate Available setting items depend on the state of the following settings.
- Page 109 4.8 Viewing Motor Measurement Values (Model PW3390-03 only) The measurement range when CH B units are set to Hz is 0.5 Hz to 5 kHz. No. of Poles × Pulse Input Frequency Measurement values are calculated as 2 × Pulse Count Setting When the pulse signal input frequency is higher than the measurement range, set the appropriate pulse count.
-
Page 110: Measuring Motor Electrical Angle
4.8 Viewing Motor Measurement Values (Model PW3390-03 only) 4.8.2 Measuring Motor Electrical Angle If the [Harm sync src] is set to [Ext] when pulses are input to CH B for the rotation signal, voltage and current phase shift based on the pulses can be seen. - Page 111 4.8 Viewing Motor Measurement Values (Model PW3390-03 only) Phase Zero Adjustment (PHASE ADJ) Press and then to correct (zero) any phase difference between the rotation signal input pulse and U1 fundamental content. • Phase zero adjustment is available only when CH B is set for pulse input and...
- Page 112 4.8 Viewing Motor Measurement Values (Model PW3390-03 only) Setting the phase zero adjustment correction value manually You can set the phase zero adjustment correction value as desired. ° The phase zero adjustment correction value can be set as desired within the range of -180.00 °...
-
Page 113: Detecting The Motor Rotation Direction
4.8 Viewing Motor Measurement Values (Model PW3390-03 only) 4.8.3 Detecting the Motor Rotation Direction When the A phase pulse and the B phase pulse of the incremental-type rotary encoder are input in the CH B and CH Z rotation signal input jacks, the rotation direction of the axis can be detected and polar code can be assigned to the number of rotations. - Page 114 4.8 Viewing Motor Measurement Values (Model PW3390-03 only)
-
Page 115: Operating Functions
5.1 Timing Control Functions Operating Chapter 5 Functions 5.1 Timing Control Functions Three types of timing controls are available: interval, count-down timer, and real-time clock settings. Tim- ing control can be applied to CF card saving and integration operations. "4.3 Integration Value Observation" (p.63), "7.5.2 Auto-Saving Measurement Data" (p.141) Controls repeating operations at a specific interval. - Page 116 5.1 Timing Control Functions Before starting integration and saving using timing control functions • Before using automatic saving or integration, ensure that the real-time clock is correctly set (p.129). • The timing control cannot be set to CF card saving and integration independently. •...
- Page 117 5.1 Timing Control Functions Setting Method Press and the keys to display the [Time] page. Interval control setting Select the item Timer control setting keys to set. Clock control settings Interval (The interval setting is also available on the [Interface] page.) Select an interval time from 50, 100, 200, or 500 ms;...
-
Page 118: Averaging Function
5.2 Averaging Function 5.2 Averaging Function The averaging function averages measured values and displays the result. This function can be used to obtain more stable display values when measured values fluctuate and cause large variations in the dis- play. Performs averaging on all instantaneous measurement values, including harmonics and motor sync source. - Page 119 5.2 Averaging Function Configuring averaging on the Measurement screen The averaging setting is displayed under [Avg] at the top of the Measurement screen. Press the key and then use the keys to select the desired setting. Press the keys repeatedly to vary the setting among the following values: ↔...
-
Page 120: Data Hold And Peak Hold Functions
5.3 Data Hold and Peak Hold Functions 5.3 Data Hold and Peak Hold Functions 5.3.1 Data Hold Function Pressing disables updating of all displayed measurement values and waveforms. In this state, data on other screens can be viewed as it was when was pressed. -
Page 121: Peak Hold Function
5.3 Data Hold and Peak Hold Functions 5.3.2 Peak Hold Function Pressing after pressing activates the Peak Hold state, in which only those items that exceed their previous maximum values are updated. This is convenient, for example, to measure motor inrush current. - Page 122 5.3 Data Hold and Peak Hold Functions • Waveform displays and integration values are unaffected by Peak Hold. • When averaging is enabled, the maximum value is recognized only after measured values have been averaged. • Data Hold and Peak Hold functions cannot be activated simultaneously. •...
-
Page 123: X-Y Plot Function
5.4 X-Y Plot Function 5.4 X-Y Plot Function Select parameters for x and y (horizontal and vertical) axes in the basic measurement items to create simple X-Y graphs. Plot screens can be saved and printed as screen capture images. XY Graph Display Press key to display the [XY Graph]... -
Page 124: Delta Star Transform Function
5.5 Delta Star Transform Function 5.5 Delta Star Transform Function Δ For 3P3W3M wiring systems (wiring mode 7 on p.37), (Delta) wiring configuration values are converted to Y (Wye) wiring values ('star' configuration) so that measured values are equivalent to those of 3P4W lines. When this function is enabled, even when a motor has internal Wye wiring and the central (neutral) point is inaccessible, it can be measured using phase voltage to emulate the Wye configuration. - Page 125 5.5 Delta Star Transform Function Setting Procedure Display the Input page Select Δ -Y convert] keys to select The Measurement screen appears as follows. Δ • -Y transform is only selectable for 3P3W3M wiring. Δ • When -Y transform is enabled, the vector diagram on the Wiring screen is the same as that for 3P4W (instead of the 3P3W3M vector diagram).
-
Page 126: Selecting The Calculation Method
5.6 Selecting the Calculation Method 5.6 Selecting the Calculation Method A function to change the calculation methods of apparent power and reactive power when the wiring is 3P3W3M (refer to "Wiring Mode 7. 3-phase, 3-wire (3P3W3M) + single-phase, 2-wire (1P2W)" (p. 37). When measuring the PWM waveform using the setting for rectification method "MEAN", it can improve the mutual compatibility with measurement values of other wattmeter. -
Page 127: Trend Function
5.7 Trend Function 5.7 Trend Function You can select up to eight basic measurement parameters and display fluctuations in their respective measured values as a graph. The generated screens can be saved as screenshots. Displaying the Trend screen Press key to display the [Trend] page. - Page 128 Using buttons or performing integration on the System screen may result in the graph display being cleared inadvertently. Hioki recommends avoiding opening the System screen if you wish to not clear the graph display. *For more information about the communications interface, see "Chapter 9 Operation with a Computer"...
- Page 129 5.7 Trend Function Configuring trend graphs Pressing the key will display the Trend Graph Setting screen. Pressing the key again or key will return to the Trend screen. Setting graphed parameters Select the measure- ment parameter for the graph number you wish to change.
- Page 130 5.7 Trend Function Setting the scale Select [Scale] for the graph number you wish to change. Press the key or the key to select the scale. Press the key for the AUTO setting. Press the key for the MANUAL setting. Scale 1/8, 1/4, 1/2, ×1, ×2, ×5, ×10, ×20, ×50, ×100, ×200, ×500 •...
- Page 131 5.7 Trend Function Setting the value that corresponds to the reference position (percent of full scale) [Base %] Select the graph number you wish to change. keys to set. Base%: -300.00% to +300.00% • The formula displayed above allows you to check the value of the plotted item that corre- sponds to the reference position.
- Page 132 5.7 Trend Function Value entry dialog box Entering values Select the value you wish to enter. Enter the selected value at the input cursor position with the key. Accept: Accept the entered value by pressing the or the key while is selected.
- Page 133 5.7 Trend Function Changing the sign [+/-] Select the Change the sign of the entered val- ue with the key. Move the input cursor Move the cursor left or right with the key or key, respectively. The input cursor only appears at value digits. It will skip the decimal point. Selecting the unit prefix Select the unit prefix with the key.
- Page 134 5.7 Trend Function...
-
Page 135: Changing System Settings
Changing System Chapter 6 Settings On the [System] page, view the instrument's version information and change settings such as display language, beep sounds, and screen colors. System Page Display Press followed by to display the [System] page. Select screen colors. Enable/disable beep sounds. - Page 136 Setting Item Descriptions Use the keys to select an item, and the keys to change its setting. Language Select the language for the display. English English Japanese Japanese Chinese Chinese Color Select the screen color scheme. Color1 Black Color2 Green Color3 Blue Color4...
- Page 137 Start page Select the screen to appear when the instrument is turned on. Wiring Initially display the wiring screen. Initially displays the Measurement screen that was displayed Last scr when the instrument was turned off. Zero suppress This setting establishes a level below which values are treated as zero for data acquisition purposes.
-
Page 138: Initializing The Instrument (System Reset)
6.1 Initializing the Instrument (System Reset) 6.1 Initializing the Instrument (System Reset) If the instrument operates abnormally, see "Before returning for repair" (p. 220)“. If the cause cannot be determined, perform a system reset. Select the item Press [Reset]. (A dialog box appears.) Enter Cancel System reset returns all except the display language and communication settings to their... -
Page 139: Factory Default Settings
The factory default settings are as follows. Setting Item Default Setting Setting Item Default Setting Wiring Mode 1 (1P2W x 4) Folder PW3390 Phase correction RS com speed* 38400 bps Sync source U1, U2, U3, U4 IP address* 192.168.1.1 U range... - Page 140 6.2 Factory Default Settings...
-
Page 141: Data Saving And File Operations
Compact Flash memory Important card (at least 32 MB) Max. supported capacity Up to 2 GB • Use only PC Cards sold by Hioki. Data format MS-DOS (FAT16/FAT32) format Compatibility and performance are not guar- anteed for PC cards made by other manu- facturers. -
Page 142: Inserting And Removing Storage Media
7.1 Inserting and Removing Storage Media 7.1 Inserting and Removing Storage Media Insert and remove CF cards and USB flash drives as follows. CF card To insert a CF card Open the CF card slot cover, and with the mark pointing toward the screen, insert the card in the direction shown by the arrow as far as it will go. - Page 143 7.1 Inserting and Removing Storage Media • Hioki cannot recover data from damaged or faulty storage media resulting from abnormalities. We are also unable to provide compensation for such data loss, regardless of the contents or cause of the failure or damage. We recommend mak- ing backups of all important data.
-
Page 144: The File Operation Screen
7.2 The File Operation Screen 7.2 The File Operation Screen The File Operation screen is described below. Indicates the current root position. This example shows the contents of the root (highest level) folder of a CF card. When more files folders are present than can be displayed at... -
Page 145: Media Formatting
7.3 Media Formatting 7.3 Media Formatting Format a media if it is not already formatted (initialized). Insert the media to be formatted (p. 134), and start formatting. Formatting procedure Display the page for the media you wish to format. (The format confirmation dialog appears.) To execute: To cancel:... -
Page 146: Saving Operations
7.4 Saving Operations Manual Saving (p. 139) A new file is cre- ated when any Storage me- M3390000.CSV of the following dia root folder PW3390 Save destination CF card are changed: M3390001.CSV USB flash drive (or any other folder) Save destination... -
Page 147: Measurement Data Saving
7.5 Measurement Data Saving 7.5 Measurement Data Saving Measurement data can be saved either manually or automatically. All measurement values including harmonics and peak values of FFT functions can be selected for saving. Files are saved in CSV format. Both manual and auto-saving are disabled while accessing storage media (Media- Busy indicator lights green, (p. - Page 148 7.5 Measurement Data Saving Selecting the Destination Folder and Measurement Items to Save Display the Interface page For manual saving: [Folder] For auto-saving: [Folder (Can be set when the auto save mode is ON.) (A dialog appears) keys to select characters Enter characters with the keys...
-
Page 149: Auto-Saving Measurement Data
7.5 Measurement Data Saving 7.5.2 Auto-Saving Measurement Data Each measurement value can be automatically saved at the specified time. Items that have been specified beforehand are saved. Saving Procedure Select the measurement items to be saved. (See 7.5.3 (p.143)) Enable auto-saving and select the destination folder (as necessary). (See Setting Auto-Saving below, and "Selecting the Destination Folder and Measurement Items to Save"... - Page 150 7.5 Measurement Data Saving Auto-Saving Operations Timing controls available for auto-saving are as follows. Save Save Save Save Save Interval Timing Control Interval Interval Interval Save Save Timer Control Timer Setting Auto Stop Real-Time Clock Timing Save Save Control Waiting Time Between Clock Start/Stop Settings Auto Start Auto Stop...
-
Page 151: Selecting Measurement Items To Save
7.5 Measurement Data Saving 7.5.3 Selecting Measurement Items to Save The items to be saved to storage media can be selected. The number of items that can be recorded depends on the interval timing setting. Interval 50ms 100ms 200ms 500ms Other Maximum 1300... - Page 152 7.5 Measurement Data Saving When [Harmonic] is Selected When [Harmonic] is selected for measurement contents to be saved, the output, highest, and lowest orders can be selected in addition to the items to be saved. Out order Select the orders for output. Selects all harmonic orders.
-
Page 153: Saving Noise Data And Waveform Data
7.6 Saving Noise Data and Waveform Data 7.6 Saving Noise Data and Waveform Data Saving Noise Data 7.6.1 This operation saves the waveform displayed on the [Wave + Noise] page as a CSV file. Saving Procedure Display the Wave + Noise page (Saves the noise waveform at this moment) -
Page 154: Saving Wave Data
7.6 Saving Noise Data and Waveform Data Saving Wave Data 7.6.2 This operation saves the waveform displayed on the [Wave + Noise] page as a CSV file. Saving Procedure Display the Wave + Noise page (Saves the waveform at this mo- ment) Save destination: CF card, USB flash drive... -
Page 155: Saving Screen Capture Images
7.7 Saving Screen Capture Images 7.7 Saving Screen Capture Images The currently displayed screen can be saved as a 256-color bmp bitmap file (BMP file name extension). Press to save a bitmap image of the current screen to the specified media. CF card, USB flash drive Save destination: (Save destination setting is the same as for Manual saving, (p. -
Page 156: Loading Screenshots
Press any key to return to the previ- ous screen. • Do not open images that were not saved by the PW3390. • For more information about how to load a file inside a folder, see "7.2 The File Operation... -
Page 157: Saving Setting Configurations
7.9 Saving Setting Configurations 7.9 Saving Setting Configurations Various instrument settings can be saved to storage media as settings files. Save Procedure (Example: saving to a CF card folder) Display the [CF card] page keys to select a folder to open a folder (A dialog appears.) keys to select a character... -
Page 158: Reloading Setting Configurations
In order to restore settings, the instrument model and sensor setup must be the same. Otherwise, the settings will not be restored. For example, the settings file for a PW3390-01 cannot be loaded by a PW3390-02. • Loading a settings file saved by an instrument running firmware older than Version 2.00 on an instrument running Version 2.00 or newer firmware may cause the Mea-... -
Page 159: File And Folder Operations
7.11 File and Folder Operations 7.11 File and Folder Operations 7.11.1 Creating Folders Both auto-saving and manual saving require that a save destination folder be created. Insert storage media before creating folders. (p. 134) Creation Procedure Display the [CF card] page (A dialog appears.) keys to select a... -
Page 160: Copying Files And Folders
7.11 File and Folder Operations 7.11.2 Copying Files and Folders Files can be copied between a CF card and USB flash drive. Insert the CF card and USB flash drive before copying. (p. 134) File Copying Procedure (Example: copying the root files from a CF card to a folder on a USB flash drive) Display the [CF card] page... - Page 161 7.11 File and Folder Operations Folder Copying Procedure (Example: copying a folder from a CF card to a USB flash drive) Display the [CF card] page keys to select the folder (A dialog appears.) Copy: If a duplicate folder exists : If a duplicate folder exists at the destination, an error is displayed.
-
Page 162: Deleting Files And Folders
7.11 File and Folder Operations 7.11.3 Deleting Files and Folders Files can be deleted from storage media. Insert the storage media before deleting files. (p. 134) Deleting Procedure (Example: deleting a file (or folder) from a CF card) Display the [CF card] page keys to select... -
Page 163: Renaming Files And Folders
7.11 File and Folder Operations 7.11.4 Renaming Files and Folders Files on storage media can be renamed. Insert the storage media before renaming a file. (p. 134) Renaming Procedure (Example: renaming a file (or folder) in the CF card) Display the [CF card] page keys to select the... - Page 164 7.11 File and Folder Operations...
-
Page 165: Connecting External Devices
External Devices 8.1 Connecting Multiple PW3390 (Synchronized Measurements) Up to eight PW3390 can be connected with optional Hioki 9683 Connection Cable (for synchronous measure- ments). When so connected, one PW3390 operates as master over the others set as slaves, providing multi- instrument synchronous measurements. - Page 166 8.1 Connecting Multiple PW3390 (Synchronized Measurements) Connecting Multiple PW3390 with Sync Cables This description uses an example of three PW3390. Required items: Three PW3390s, two Model 9683 Connection Cables Procedure Verify that all PW3390s are turned off. As shown below, connect the sync cables between the OUT and IN terminals of the master and each slave.
- Page 167 [SAVE] [COPY] as a synchronized event sets the manual save destina- tion folder appropriately and records data on each PW3390. "7.5.1 Manually Saving Measurement Data" (p. 139), "7.7 Saving Screen Capture Images" (p. 147) • To save measurement data to storage media with an interval time control combina- tion, set the same interval setting on the master and all slaves, and enable auto-sav- ing (set to ON).
- Page 168 8.1 Connecting Multiple PW3390 (Synchronized Measurements) Sync Cable Pin-Outs Sync Output (OUT): 8-pin mini-DIN plug pin Sync Input (IN): 9-pin mini-DIN plug pin configuration configuration +5 V +5 V +5 V 10 kΩ 120 Ω 10 kΩ Output Input Terminal...
-
Page 169: Controlling Integration With External Signals
8.2 Controlling Integration with External Signals 8.2 Controlling Integration with External Signals The synchronization interface provided by the instrument’s SYNC IN terminal can be used to start, stop, reset integration, and event via 0 V/5 V logic signals or short/open contact signals. Synchronization input (IN) 9-pin round connector pin layout and internal circuit diagram +5 V... - Page 170 8.2 Controlling Integration with External Signals Connecting the cable Required items: 9683 Connection Cable and external device that will be used to control the instrument Connect the cable to the SYNC IN terminal on the right side of the instrument. The end of the cable with the ferrite clamp is the IN end.
- Page 171 8.2 Controlling Integration with External Signals Integration value reset (pin No. 1) This control signal resets the integration value to zero. It has the same effect as pressing the DATA RESET key on the instrument’s control panel. 40 ms or greater 5 V (open) 0 V (short) The value is reset during this interval.
-
Page 172: Using Analog And Waveform D/A Output
8.3 Using Analog and Waveform D/A Output 8.3 Using Analog and Waveform D/A Output Analog (p. 167) or waveform output (p. 168) is possible for PW3390-02 and PW3390-03. • PW3390-02 Model with D/A output • PW3390-03 Model with motor analysis and D/A output Both D/A output provides 16 output channels, and is selectable from the basic measurement items. - Page 173 8.3 Using Analog and Waveform D/A Output D/A Output Connector Pin-Out Output ( ) waveform output Pin No. Pin No. Output content D/A1 (U1) D/A9 D/A2 (I1) D/A10 D/A3 (U2) D/A11 Instrument D/A4 (I2) D/A12 Rear Panel D/A5 (U3) D/A13 D/A6 (I3) D/A14 D/A7 (U4)
-
Page 174: Output Item Selection
8.3 Using Analog and Waveform D/A Output 8.3.2 Output Item Selection Select the items for D/A output. Up to 16 items can be selected. Make the settings on the [D/A Out] page of the Setting screen. Setting Procedure Display the D/A Out page Select... - Page 175 8.3 Using Analog and Waveform D/A Output • Waveform output can be selected only for channels 1 through 8 (D/A1 to D/A8). Channels 9 through 16 (D/A9 to D/A16) are for analog output only. • The output parameters for LR8410 Link-compatible loggers are the same as the out- put parameters for channels 9 through 16 (D/A9 to D/A16).
- Page 176 8.3 Using Analog and Waveform D/A Output About Waveform Outputs • Output signals are waveforms of the instantaneous values of input voltages and currents. • Voltage inputs and current sensor inputs are mutually isolated. • Combine with an oscilloscope to observe waveforms of phenomena such as device inrush current. Specifications Output voltage Select from either ±1 V or ±2 V, crest Factor 2.5 or higher...
-
Page 177: Output Level
8.3 Using Analog and Waveform D/A Output 8.3.3 Output Level ± Full-scale D/A output span is 5 V DC. This corresponds to the full-scale measurement input spans as follows. Selected Output Item Full Scale Voltage and current of each channel, Sum of voltage and current dc, CH A, CH B, Pm, Slip: Measurement range (with polarity) (dc, pk+ and pk- for each U1 to U4, I1 to I4, U12, U34, U123, I12, pk+, pk-: Measurement range (with polarity) ×... -
Page 178: D/A Output Examples
8.3 Using Analog and Waveform D/A Output 8.3.4 D/A Output Examples Voltage and current (rms, mn, ac, fnd, thd), Voltage and current (dc, pk+, pk-), apparent power active power, reactive power Power phase angle Power factor Outputs 0 V when the frequency is less than the measurement lower limit frequency (the display will indicate 0.0000 Hz). - Page 179 8.3 Using Analog and Waveform D/A Output Data Hold Output retaining Output retaining Time Output retaining Stop Integration Stop Integration Data Hold Stop Integration Integration Reset Start Integration Resume Integration Resume Integration Data Hold Start Integration Cancel Updated at each interval (1) Analog output changes when integration starts, and is held constant after integration stops.
-
Page 180: Connecting The Instrument To A Lr8410 Link-Compatible Logger
8.4 Connecting the Instrument to a LR8410 Link-compatible Logger The instrument can be connected to Hioki model LR8410 Link-compatible logger (LR8410 Wireless Log- ging Station or LR8416 Wireless Heat Flow Logger) via Bluetooth ® , enabling it to send measured values for D/A output parameters wirelessly to the logger (D/A9 to D/A16, up to 8 parameters). -
Page 181: Configuring And Connecting The Adapter
Unused Escape sequence characters Not permitted • For more information about how to configure Hioki LR8410 Link-compatible loggers such as the LR8410, see the instruction manual for the logger with which you wish to use the instru- ment. • Changing the instrument’s measurement range while its measured values are being automat- ically saved by an LR8410 Link-compatible logger will prevent the logger from saving the val- ues properly. -
Page 182: Using The Motor Testing
Lock Required items: Hioki L9217 Connection Cords (as needed), input devices Procedure Confirm the that instrument and input devices are turned off. As shown in the examples on the next page, connect the output jacks on the input devices to the instrument using the connection cords. - Page 183 • When using CH Z (original position signal or Z-phase), apply a train of at least four pulses to CH B. Motor Analysis Settings on the Instrument, Displaying Measured Values See section "4.8 Viewing Motor Measurement Values (Model PW3390-03 only)" (p. 94) for measurement displays and instrument setting procedures.
- Page 184 8.5 Using the Motor Testing...
-
Page 185: Operation With A Computer
• The dedicated application, USB driver, and the Communication Command Instruction Manual can be downloaded from our website (http://www.hioki.com). • To communicate with the instrument, use only one of the following: remote control, the dedicated application, or communication commands. Simultaneous use of multiple com- munication methods will cause the instrument to malfunction, for example by interrupting communication with the computer. -
Page 186: Control And Measurement Via Ethernet ("Lan") Interface
• See the application program's operating manual for operating procedures. • See the Communication Command Instruction Manual for command communication procedures. (Both are downloadable from http://www.hioki.com). 9.1.1 LAN Settings and Network Environment Configuration Configure the Instrument's LAN Settings • Make these settings before connecting to a network. Changing settings while con- nected can duplicate IP addresses of other network devices, and incorrect address information may otherwise be presented to the network. - Page 187 9.1 Control and Measurement via Ethernet ("LAN") Interface Setting Items IP address Identifies each device connected on a network. Each network device must be set to a unique address. The instrument supports IP version 4, with IP addresses indicated as four deci- mal octets, e.g., "192.168.0.1".
-
Page 188: Instrument Connection
• Straight-through Cat 5, 100BASE-TX-compliant Ethernet cable (up to 100 m, commercially available). For 10BASE communication, a 10BASE-T-compliant cable may also be used. • Hioki 9642 LAN Cable (option) When connecting one instrument to a single computer (prepare one of the following): •... - Page 189 Connect to the Ethernet jack on the instrument. Connect to a 100BASE-TX hub. When connecting the instrument to a single computer (connect the instrument to the computer) Use the Hioki 9642 LAN Cable and cross-over adapter (9642 accessory) Cross-Over Adapter Ethernet Interface Jack Connect the Ethernet cable to the cross-over adapter.
-
Page 190: Remote Control Of The Instrument By Internet Browser
9.2 Remote Control of the Instrument by Internet Browser 9.2 Remote Control of the Instrument by Internet Browser The instrument includes a standard HTTP server function that supports remote control by an internet browser on a computer. The instrument’s display screen and control panel keys are emulated in the browser. -
Page 191: Operating Procedure
9.2 Remote Control of the Instrument by Internet Browser 9.2.2 Operating Procedure The instrument's screen and control panel emulations appear in the browser. Click on the control panel keys to perform the same operations as the instrument keys. To enable automatic browser screen updating, set the Update Time in the Auto Update menu. Control Panel Emulation Instrument Screen Emulation Auto Display... -
Page 192: Control And Measurement Via Usb Interface
(Compatible to the Windows 7 (32-bit, 64-bit), Windows 8 (32-bit, 64-bit), Windows 10 (32-bit, 64-bit).) The dedicated application and USB driver can be downloaded from our website (http://www.hioki.com). 9.3.1 Connecting to the Instrument Connect the instrument to the computer with a USB cable. No USB port on computer instrument settings are necessary to establish the USB connection. -
Page 193: Control And Measurement Via Rs-232C Interface
• See the application program's operating manual for operating procedures. • See the Communication Command Instruction Manual for command communication procedures. (Both are downloadable from http://www.hioki.com). 9.4.1 Connecting to the Instrument Recommended cable: 9637 RS-232C Cable (9pin-9pin/1.8 m, crossing cable) Connect the instrument to a computer with a RS-232C cable. -
Page 194: Setting The Rs-232C Communications Speed
9.4 Control and Measurement via RS-232C Interface 9.4.2 Setting the RS-232C Communications Speed Display the [Interface] page Select a setting item [RS com speed] Select with the keys Reboot the instrument when changing the settings. Setting the PC's communications speed Use the same communications protocol settings as are being used by the instrument. - Page 195 9.4 Control and Measurement via RS-232C Interface Cross wiring D-sub 9pin, female D-sub 9pin, female PC side PW3390 side...
- Page 196 9.4 Control and Measurement via RS-232C Interface...
-
Page 197: Chapter 10 Specifications
USB (function), USB memory, LAN, CF card, RS-232C, Synchronous control Dimensions Approx. 340 W ×170 H ×156 D mm (13.39" W ×6.69" H ×6.14" D) (excluding protrusions) Mass Approx. 4.6 kg (162.3 oz.) when PW3390-03 Product warranty period 3 years Accessories See "Confirming Package Contents"( p.2) -
Page 198: Basic Specifications
10.2 Basic Specifications 10.2 Basic Specifications 1. Power Measurement Input Specifications Measurement line type Single-phase 2-wire (1P2W), Single-phase 3-wire (1P3W), 3-phase 3-wire (3P3W2M, 3P3W3M), 3-phase 4-wire (3P4W) Pattern 1 1P2W 1P2W 1P2W 1P2W Pattern 2 1P3W 1P2W 1P2W Pattern 3 3P3W2M 1P2W 1P2W... - Page 199 10.2 Basic Specifications 1. Power Measurement Input Specifications Data update interval 50 ms OFF/500 Hz/5 kHz/100 kHz (selectable for each wiring system) 500 Hz Accuracy defined under 60 Hz, add ±0.1% f.s. 5 kHz Accuracy defined under 500 Hz 100 kHz Accuracy defined under 20 kHz, add 1% rdg.
- Page 200 ±0.06% rdg.±0.055% f.s. ±0.06% rdg.±0.055% f.s. Add ±0.12% f.s. (f.s. = PW3390 range) when using 1 A or 2 A range. Combined accuracy when used with any of the following current measurement options: special-order high-accuracy 9709-05, high-accuracy CT6862-05, or high-accuracy CT6863-05 (with PW3390 range as f.s.)
- Page 201 10.2 Basic Specifications 1. Power Measurement Input Specifications Guaranteed accuracy period 6 months (and 1.25 times specified accuracy for one year) Conditions of guaranteed Temperature and humidity for guaranteed accuracy: 23°C±3°C, 80% RH or less accuracy Warm-up time: 30 minutes or more Input: Sine wave input, power factor of one, or DC input, zero ground voltage, within effective measure- ment range after zero-adjustment and within the specified range in which the fundamental wave satisfies the synchronization source conditions.
- Page 202 10.2 Basic Specifications Harmonic Measurement Specifications Number of measurement channels 4 Channels Harmonic measurements not available for multiple systems with different frequencies. Measurement items Harmonic rms voltage, harmonic voltage percentage, harmonic voltage phase angle, harmonic rms current, harmonic current percentage, harmonic current phase angle, harmonic active power, har- monic power percentage, harmonic voltage-current phase difference, total harmonic voltage distor- tion, total harmonic current distortion, voltage imbalance, current imbalance Measurement method...
- Page 203 ±0.03% f.s./°C 10 10 Effect of common mode voltage Not more than ±0.01% f.s. (with 50 V [DC or 50 Hz/60 Hz] between measurement jacks and PW3390 chassis) Effect of external magnetic field Not more than ±0.1% f.s. (at 400 A/m DC and 50 Hz/60 Hz magnetic fields)
- Page 204 6 months (For 1 year accuracy, calculate the specified accuracy for 6 months ×1.25) Conditions of guaranteed accura- Temperature and humidity: 23°C±3°C (73°F±5°F), 80% RH or less Warm-up time: 30 minutes or more, After zero adjustment of the PW3390 Temperature coefficient ±0.05% f.s./°C Pinout...
- Page 205 10.2 Basic Specifications Display Specifications Languages Japanese, English, Simplified Chinese Display type 9-inch TFT color LCD (800×480 dots) Dot pitch 0.246(V) mm ×0.246(H) mm LCD backlight Always ON, Auto OFF (after 1/5/10/30/60 minutes) Display numerical resolution 99999 counts (other than the integrated value) 999999 counts (Integrated value) Display refresh interval Measurement values: 200 ms (independent of internal data update interval)
- Page 206 10.2 Basic Specifications (5) RS-232C Interface Method RS-232C [EIA RS-232D], [CCITT V.24], [JIS X5101] compliant Connector D-sub9 pin connector ×1 Connection destination PC (simultaneous use of USB and LAN not supported; order of precedence with simultaneous con- nection: USB > LAN > RS-232C.) Communication format Full duplex, start-stop synchronization, 8-bit data, no parity, one stop bit, hardware flow control, CR+LF delimiter...
-
Page 207: Functions Specifications
10.3 Functions Specifications 10.3 Functions Specifications 1.AUTO range Function Function Automatically selects voltage and current ranges according to measured amplitude on each phase. Operating states Selectable on or off for each phase system Auto-ranging span Wide/Narrow (common to all wiring systems) Wide: When a phase system’s peak-over or rms value is above 110% f.s., increments one range, and, when all rms values within the phase system are below 10% f.s., decrements... - Page 208 Calculation items Active power (P) of each phase and system Motor power (Pm) when motor evaluation model PW3390-03 is installed Calculation accuracy Measurements applied to formulas are handled as 32-bit floating point values. When calculating parameters between wiring systems with different power ranges, the higher range is used.
- Page 209 10.3 Functions Specifications 5. Display Functions (1) Wiring Check screen Function The wiring diagram and voltage/current vectors are displayed for the selected wiring system(s). The correct range for the wiring system is shown on the vector display, to confirm proper measurement cable connections.
- Page 210 10.3 Functions Specifications (2) Trend screen Time axis 1.5 / 3 / 6 / 12 / 30 s/div , 1 / 3 / 6 / 10 / 30 min/div, 1 / 3 / 6 / 12 hour/div, 1 day/div Vertical axis Auto (The vertical axis is configured so that data in the screen display range fits on the screen.) Semi-auto (The zoom factor is set from the following values relative to the full-scale value for graphed parameters:...
- Page 211 9. Synchronous Control Function Function Synchronous measurements are available by using sync cables to connect one Model PW3390 as a master and one or more as slaves. Clocks and data updates are synchronized when the slave instrument is turned on.
-
Page 212: Setting Specifications
10.4 Setting Specifications 10.4 Setting Specifications 1. Input Settings Wiring modes Pattern 1 1P2W 1P2W 1P2W 1P2W Pattern 2 1P3W 1P2W 1P2W Pattern 3 3P3W2M 1P2W 1P2W Pattern 4 1P3W 1P3W Pattern 5 3P3W2M 1P3W Pattern 6 3P3W2M 3P3W2M Pattern 7 3P3W3M 1P2W Pattern 8... - Page 213 10.4 Setting Specifications 3. Calculation and Recording Settings Average OFF/FAST/MID/SLOW/SLOW2/SLOW3 Interval OFF, 50 ms, 100 ms, 200 ms, 500 ms, 1 s, 5 s, 10 s, 15 s, 30 s, 1 min, 5 min, 10 min, 15 min, 30 min, 60 min Timer control Elapsed time/Real-time clock Timer:...
- Page 214 10.4 Setting Specifications 8. Interface Settings Synchronization control Master/slave Synchronous event items HOLD, SAVE, COPY Saving data Select the items to record (Max. number of items is limited according to the interval setting.) Auto-save OFF/ON (CF card) Data save destination Destination folder Manual save destination USB memory, CF card (Specify the folder to save.)
-
Page 215: Measurement Item Details
10.5 Measurement Item Details 10.5 Measurement Item Details 1. Basic Measurement Items Pattern 1 Pattern 2,3 Pattern 4,5,6 Pattern 7,8 Pola Measurement items 1P2W+1P2W 1P3W/3P3W2M 1P3W/3P3W2M 3P3W3M/3P4W Display range rity Symbol Unit +1P2W+1P2W +1P2W+1P2W +1P3W/3P3W2M +1P2W (+/-) Frequency Hz 1, 2, 3, 4 1, 2, 3, 4 1, 2, 3, 4 1, 2, 3, 4... - Page 216 10.5 Measurement Item Details 2. Harmonic Measurement Items Pattern 1 Pattern 2,3 Pattern 4,5,6 Pattern 7,8 Pola Measurement items 1P2W+1P2W 1P3W/3P3W2M 1P3W/3P3W2M 3P3W3M/3P4W Display range rity Symbol Unit +1P2W+1P2W +1P2W+1P2W +1P3W/3P3W2M +1P2W (+/-) 1, 2, 3, 4 1, 2, 3, 4 1, 2, 3, 4 1, 2, 3, 4 U Range...
- Page 217 10.5 Measurement Item Details (2) With 50 A sensors Current/Phase (Wiring) System/ 15.000 V 30.000 V 60.000 V 150.00 V 300.00 V 600.00 V 1.5000 kV Voltage 1P2W 15.000 30.000 60.000 150.00 300.00 600.00 1.5000k 1P3W 30.000 60.000 120.00 300.00 600.00 1.2000k 3.0000k...
-
Page 218: Calculation Formula Specifications
10.6 Calculation Formula Specifications 10.6 Calculation Formula Specifications 1. Calculation Formulas for Basic Measurement Items Phase System 1P2W 1P3W 3P3W2M 3P3W3M 3P4W Items -- - Urms Urms Urms – ∑ Voltage RMS ---- - i ( )s Urms -- - Urms Urms Urms Urms... - Page 219 10.6 Calculation Formula Specifications Phase System 1P2W 1P3W 3P3W2M 3P3W3M 3P4W Items Irms -- - Irms Irms – ∑ Irms -- - Irms Irms Irms Current RMS ---- - Irms i ( )s i ( ) Irms -- - Irms Irms -- - Imn –...
- Page 220 10.6 Calculation Formula Specifications Phase System 1P2W 1P3W 3P3W2M 3P3W3M 3P4W Items – ∑ × ---- - i ( ) i ( ) i ( ) Active power • U(i)s. For 3P3W3M and 3P4W systems, phase voltage is used for waveform voltage (3P3W3M:U1s=(U1s-U3s)/3, U2s=(U2s-U1s)/3, U3s=(U3s-U2s)/3) •...
- Page 221 10.6 Calculation Formula Specifications 2. Motor analysis measurement items calculation formulas Items Setting Units Calculation Formulas – ∑ ---- - V (DC Voltage) For Analog DC A [V] × CH A scaling setting CH A For Frequency m, mN m, or kN m common to all mea- •...
- Page 222 10.6 Calculation Formula Specifications 3. Harmonic Measurement Calculation Formulas Phase System 1P2W 1P3W 3P3W2M 3P3W3M 3P4W Items Harmonic voltage k i ( ) kr i ( ) ki i ( ) Harmonic 1 – kr i ( ) ⎛ ⎞ θ...
- Page 223 10.6 Calculation Formula Specifications Phase System 1P2W 1P3W 3P3W2M 3P3W3M 3P4W Items Harmonic voltage × ------ k i ( ) content Harmonic current × --- - k i ( ) content Harmonic power × ----- - k i ( ) content ∑...
- Page 224 10.6 Calculation Formula Specifications 4. Noise measurement parameter calculation formulas Items Calculation Formulas Voltage noise Current noise : Post-FFT real part : Post-FFT imaginary part...
-
Page 225: Wiring System Diagram Specifications
10.7 Wiring System Diagram Specifications 10.7 Wiring System Diagram Specifications Single Phase 2-wire (1P2W) Each channels Single Phase 3-wire (1P3W) CH2/CH4 CH1/CH3 10 10 3-Phase 3-Wire 2-Measurement (3P3W2M) CH2/CH4 CH1/CH3... - Page 226 10.7 Wiring System Diagram Specifications 3-Phase 3-Wire 3-Measurement (3P3W3M) 3-Phase 4-Wire (3P4W)
-
Page 227: Maintenance And Service
If the date and time deviate substantially when the instrument is switched on, it is the time to replace that battery. Contact your authorized Hioki distributor or reseller. •... - Page 228 If the date and time deviate substantially Lithium battery Approx. 10 years when the instrument is switched on, or backup error is returned in self- test, it is the time to replace that battery. Contact your authorized Hioki distributor or reseller. Fan motor Approx. 6 years...
- Page 229 Is the pulse output the voltage output? ting of the CH B pulse input. Pulse of the open collector output cannot be de- 10.2 "6. Motor Analysis Specifications tected. (Model PW3390-03 only)" (p. 195) Number of motor rotations cannot be Confirm the cable wiring. measured...
-
Page 230: Error Indication
Sub CPU initializing error. Sub CPU boot error. DRAM error. DRAM error. Repair is required. SRAM error. SRAM error. Contact your authorized Hioki distributor or Invalid FLASH SUM. Firmware checksum error. reseller. Invalid Adjustment SUM. Adjusted value checksum error. Invalid Backuped values. - Page 231 Clock, timer, and clock start/stop settings can- not be changed while Slave mode is enabled. Cannot change the setting Attempted to set the clock, timer or clock "8.1 Connecting Multiple PW3390 (Syn- under slave mode. control settings with Slave mode enabled. chronized Measurements)" (p. 157)
- Page 232 11.3 Error Indication display Cause Remedy Error Cannot copy a folder not Attempted to copy a folder within a non- under the root folder. root folder. Cannot delete a folder not Attempted to delete a non-root folder. Try again from the computer. under the root folder.
- Page 233 If the error recurs, contact your authorized Hioki distributor or reseller. Contact your authorized Hioki distributor or reseller, if a repair should become necessary. If the measurement lines are energized when the instrument is turned on, the instru- ment may be damaged or an error message may appear, so before energizing the...
-
Page 234: Disposing Of The Instrument
11.4 Disposing of the Instrument 11.4 Disposing of the Instrument When disposing of this instrument, remove the lithium battery and dispose of battery and instrument in accordance with local regulations. Dispose the other options appropriately. • To avoid electric shock, turn off the power switch and disconnect the power cord and measurement cables before removing the lithium battery. -
Page 235: Appendix
Appendix 1 Block Diagram Appendix Appendix 1 Block Diagram Voltage Input Circuit High-Speed 9-inch WVGA Ω Power Analysis Engine Range Ω Isolation Current Sensor Input Circuit Range Ω CF Card Motor Analysis Input Circuit (Option) Channel A Input Circuit Ω Range USB Port Ω... -
Page 236: Appendix 2Measurement Data Saving Format
Appendix 2 Measurement Data Saving Format Appendix 2 Measurement Data Saving Format Header Structure Headers (item names saved at the head of the file) when measurement data is saved by manual or auto- saving are as follows. • Selected items are output in order from the top of the table, and from left to right. •... - Page 237 Appendix 2 Measurement Data Saving Format Harmonic Measurement Items Harmonic Frequency HFREQ Level HU1Ln Content HU1Dn Phase angle HU1Pn nth order voltage Level HU4Ln Content HU4Dn Phase angle HU4Pn Level HI1Ln Content HI1Dn Phase angle HI1Pn nth order current Level HI4Ln Content HI4Dn...
- Page 238 Appendix 2 Measurement Data Saving Format About Status Data The status data indicates the measurement state when the data was saved, and is displayed as a 32-bit hexadecimal digit, as follows. bit 31 bit 30 bit 29 bit 28 bit 27 bit 26 bit 25 bit 24...
-
Page 239: Appendix 3Physical Illustration
Appendix 3 Physical Illustration Appendix 3 Physical Illustration 156±2 (10) 340±2 (380.5) (Unit: mm) -
Page 240: Appendix 4Rack Mounting
Appendix 4 Rack Mounting Appendix 4 Rack Mounting The illustrated rack mounting brackets are available. For more information, contact your authorized Hioki distributor or reseller. Front View Rear View... -
Page 241: Index
Index Index Active Power .......49, 63, 66, 72, 74 D/A output ............166 Output examples .......... 170 All CH Set ............18 Data format ............133 Analog DC ...........97, 100 Data Hold ............159 Phase Zero Adjustment ........103 Data Saving ............138 Analog output ..........167, 168 Apparent Power... - Page 242 Index Fundamental wave component ......207 Motor .............. 96 Grounding ............29 Main page ............182 Manual Integration ........67, 68 MANUAL range ..........51, 52 Manual Save ......133, 136, 138, 139 Handle ..............15 Master .............. 157 Hann ..............
- Page 243 Index Real time .....71, 109, 131, 199, 203, 205 THD-F ..............78 Realtime ........14, 63, 64, 67, 69, 70 THD-R ..............78 Real-Time Clock ..........142 Timer ............70, 142 Real-time clock timing control ......107 Timer timing control .......... 107 Rectangular ............88 Timing Control Functions ....
- Page 244 Index 索 引...
Need help?
Do you have a question about the PW3390 and is the answer not in the manual?
Questions and answers