
Related Manuals for Hioki PW3336-01


Summary of Contents for Hioki PW3336-01
- Page 1 PW3336 PW3336-01 PW3336-02 Instruction Manual PW3336-03 PW3337 PW3337-01 PW3337-02 PW3337-03 POWER METER Apr. 2016 Revised edition 3 PW3336A981-03 16-04H * 6 0 0 4 0 9 4 3 3 *...
-
Page 3: Table Of Contents
Contents Contents Automatically setting the range Introduction............. 1 (auto-range operation) ......49 Confirming Package Contents......2 3.2.5 Setting the Synchronization Source Safety Information .......... 3 (SYNC) ..........51 Operating Precautions........5 3.2.6 Setting the Frequency Measurement Range ..........53 3.2.7 Setting the Timeout ......55 3.2.8 Displaying Measured Values as an Chapter 1 Overview Average (AVG: Averaging) ....57... - Page 4 Contents Switching between analog output and Setting the LAN’s default gateway ..125 waveform output ........92 Displaying the LAN’s MAC address ..126 Setting the rectifier for analog output ..93 Connecting the instrument to a computer with a LAN cable ........
- Page 5 Contents Appendix Appendix 1Detailed Specifications of Measurement Items (Display Items) ........A1 Appendix 2Detailed Specifications of Output..........A5 Appendix 2.1Detailed Specifications of Level Output ..........A5 Appendix 2.2Detailed Specifications of Waveform Output ......A6 Appendix 2.3Detailed Specifications of Selectable Items for D/A Output ..A7 Appendix 3Rack Mounting ......A11 Appendix 4Dimensional Diagram ....A13 Index...
- Page 6 Contents...
-
Page 7: Introduction
The instrument can measure relatively high current with the use of HIOKI Clamp on Sensors (clamp sensors), which are option, or current sensors. Hereafter, those sensors are collectively referred to as "current sen- sors". Please read the instruction manuals of each sensor for details before using. -
Page 8: Confirming Package Contents
When you receive the instrument, inspect it carefully to ensure that no damage occurred during shipping. In particular, check the accessories, panel switches, and connectors. If damage is evident, or if it fails to operate according to the specifications, contact your dealer or Hioki representative. Confirm that these contents are provided. -
Page 9: Safety Information
Safety Information Safety Information This instrument is designed to comply with IEC 61010 Safety Standards, and has been thoroughly tested for safety prior to shipment. However, mishandling during use could result in injury or death, as well as damage to the instrument . Using the instrument in a way not described in this manual may negate the provided safety features. - Page 10 Safety Information Notation Indicates the prohibited action. (p. ) Indicates the location of reference information. Indicates that descriptive information is provided below. Names of settings, buttons, and other screen elements are enclosed in brackets. (Bold character) The screen of this instrument displays characters in the following manner. Accuracy We define measurement tolerances in terms of f.s.
-
Page 11: Operating Precautions
• Before using the instrument for the first time, verify that it operates normally to ensure that no damage occurred during storage or shipping. If you find any damage, contact your dealeror Hioki representative. • Before using the instrument, make sure that the insulation on the connection cable is undamaged and that no bare conductors are improperly exposed. - Page 12 Operating Precautions Handling the Instrument To avoid electric shock, do not remove the instrument's case. The internal components of the instrument carry high voltages and may become very hot during operation. • Do not allow the instrument to get wet, and do not take measurements with wet hands.
- Page 13 Operating Precautions Observe the following to avoid electric shock and short circuits. • Turn off the power to lines to be measured before making connections to terminals to be measured and turning on the instrument. • Be sure to connect the voltage input and current input terminals correctly. An incor- rect connection could damage or short circuit this instrument.
- Page 14 1. Turn off the power switch of the instrument. 2. Disconnect the power cord from the outlet. 3. Turn off the power to the line to be measured. Remove the measurement cables. 4. Contact your dealer or Hioki representative.
- Page 15 Operating Precautions • For safety reasons, disconnect the power cord when the instrument is not used and before connecting it to a device to be tested. • To avoid damage to the instrument, do not input the voltage to the output terminals. Also do not short between any terminals.
- Page 16 Operating Precautions...
-
Page 17: Chapter 1 Overview
1.1 Product Overview Chapter 1 Overview 1.1 Product Overview The PW3336/ PW3337 is a power meter with power measurement capabilities for the full range of electrical equipment, from single-phase devices such as battery-driven devices and household electronics to industrial- use and three-phase electrical equipment. The instrument provides coverage from DC to inverter frequencies with support for voltages up to 1,000 V and direct-input currents of up to 65 A. - Page 18 1.2 Features Extensive measurement functionality, standard • Since processing for functions such as AC+DC (RMS), AC+DC Umn (voltage average value rectified RMS equivalent), DC (DC component), AC (AC component), FND (fundamental wave component), and har- monic measurement as well as integration measurement can be performed internally and in parallel, it is possible to obtain simultaneous measured values simply by switching the display.
-
Page 19: Names And Functions Of Parts
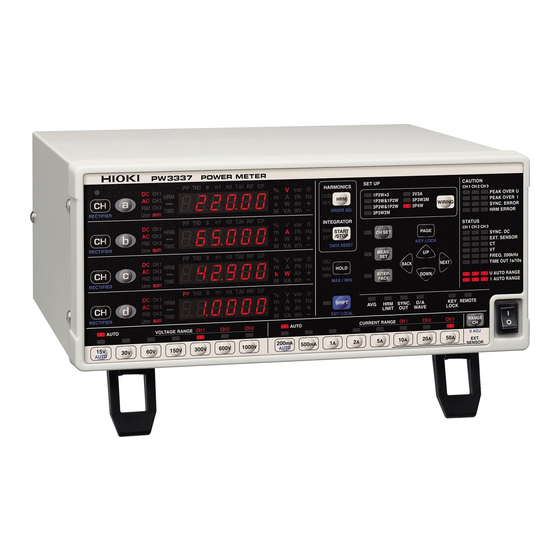
1.3 Names and Functions of Parts 1.3 Names and Functions of Parts Front Panel e.g.) PW3337-03 HRM/ ORDER SEL Harmonic display (switch among level, content percentage, and normal display) START/STOP /DATA RESET CH/ RECTIFIER (p.46) Starts/stops integration, resets integrated values (in the shift state). Switches the displayed channel and HOLD/ MAX/ MIN rectifier (in the shift state). - Page 20 1.3 Names and Functions of Parts Display parameters Pressing on the first row, on the second row, on the third row, or on the fourth row of the measured value display switches the display parameter, causing the selected display parameter to light up. Voltage (U) CF V Voltage crest factor (Ucf)
- Page 21 1.3 Names and Functions of Parts Rectifier indicator lamps (p.47) When using the AC+DC rectifier, both the DC and AC lamps light DC AC When using the AC+DC Umn rectifier, the DC, AC, and Umn DC AC Umn lamps light up. Lights up when using the DC rectifier.
- Page 22 1.3 Names and Functions of Parts Integration (INTEGRATOR) status indicator lamps (p.62) Indicates the status of integration based on START/STOP key operation or communications. RUN lamp on: Integration active RUN lamp flashing: Integration stopped RUN lamp off: Integration reset Indicates the status of integration based on external control. RUN lamp on, EXT lamp on: Integration active RUN EXT RUN lamp flashing, EXT lamp on: Integration stopped...
- Page 23 1.3 Names and Functions of Parts Wiring (WIRING) mode indicator lamps (p.40) These lamps light up when the following wiring modes are selected: 1P2W×2 1-phase/2-wire × 2 circuits (CH1 and CH2 are 1-phase/2-wire.) 1P3W 1-phase/3-wire 3-phase/3-wire, active power measurement using the two-pow- 3P3W er-meter method 3-phase/3-wire, active power measurement using the two-pow-...
- Page 24 1.3 Names and Functions of Parts Setting status indicator lamps These lamps indicate the instrument’s overall setting status. They light up when the corresponding function is ON. Lights up when the number of averaging iterations is set to a value other than the default value of 1.(p.57) Lights up when the harmonic analysis order upper limit HRM LIMIT is set to a value other than the default value of 50.(p.71)
- Page 25 1.3 Names and Functions of Parts Warning (WARNING) indicator lamps These lamps indicate channel warnings. When the following warning lamps and er- ror lamps are lit up, they indicate a hazardous state or inability to perform measure- ment accurately: Lights up when an overvoltage input warning occurs, indi- PEAK OVER U cating that the input voltage peak value has exceeded ±1,500 V or ±600% of the voltage measurement range.
- Page 26 1.3 Names and Functions of Parts Rear e.g.) PW3337-03 GP-IB connector D/A Output terminal * Voltage input terminal (U ) Input voltage signals. (p.28) (D/A OUTPUT) Connect a communica- Current input terminal ( I ) tions cable when using the Input current signals.
- Page 27 1.3 Names and Functions of Parts Bottom panel This instrument can be rack mounted. Appendix 3 Rack Mounting(p. A11) See: Parts removed from this instrument should be stored in a safe place to enable future reuse. Left side Right side When using the stands Vents Open the stands until they clicks into place.
-
Page 28: Measurement Workflow
1.4 Measurement Workflow 1.4 Measurement Workflow Install the instrument, connect wires and cords, and turn on the instrument. Installing the Instrument (p.5) CHECKS • Are the wires from the measurement targets shut off? • Is the instrument turned off, and has the power cord been disconnected? Connecting Wires and Cords Connect the measurement lines to the instrument and then connect the power cord to the instrument. - Page 29 1.4 Measurement Workflow Configure instrument settings. (These settings can also be changed during measurement.) Selecting the wiring mode (p.40) Setting the current input method (p.42) Selecting display parameters (p.44) Selecting voltage and current ranges (p.48) Setting the synchronization source (p.51) Selecting rectifiers (p.47)
- Page 30 1.4 Measurement Workflow Configure the following settings as necessary: Setting the frequency measurement range "3.2.6 Setting the Frequency Measurement Range" (p.53) See: Addressing display value variation: Displaying average measured values "3.2.8 Displaying Measured Values as an Average (AVG: Averaging)" (p.57) See: Measuring voltages in excess of 1,000 V: Using VT (PT) to make measurements "3.2.9 Setting the VT and CT Ratio"...
- Page 31 1.4 Measurement Workflow Start measurement. Activating power to the measurement lines Measuring and outputting data The instrument will display the measured values. You can change the voltage and current range as well as display parameters during measurement. Example: Voltage Current Active power Power factor When you wish to hold display...
- Page 32 1.4 Measurement Workflow...
-
Page 33: Chapter 2 Measurement Preparations
2.1 Installation and Connection Procedures Measurement Chapter 2 Preparations 2.1 Installation and Connection Procedures Please read "Operating Precautions" (p.5) carefully before installing or connecting the instrument. Install the instrument Remove the safety Connect the connection (p.5) covers. cables to the voltage input terminals and current input terminals. -
Page 34: Connecting The Measurement Lines
2.2 Connecting the Measurement Lines 2.2 Connecting the Measurement Lines Please read "Handling the Cables" (p.6) carefully before installing, connecting the instrument, or connecting the measurement LINES. Verify that power to the measurement lines has been cut off before connecting the instrument to them. - Page 35 2.2 Connecting the Measurement Lines Wire materials (Voltage input terminal, Current input terminal) To avoid electric shock or a short-circuit at the input terminals, use solderless termi- nals that cover wiring with insulation. (Screws for voltage input terminals and current input terminals: M6) To avoid electric shock, use wiring with adequate dielectric strength and current capacity.
- Page 36 × uct. If you loose any screw or find that any screws are damaged, please contact your Hioki distributor for a replacement. Safety covers • The safety covers play a protective role by preventing contact with the terminals. Always attach the covers before using the instrument.
- Page 37 2.2 Connecting the Measurement Lines Connect the instrument to the measurement lines. (Example: 1P2W connection) There are three types of connection methods: When measuring measurement lines that are within the maximum input range, connect the instrument to the measurement lines directly. (For wiring modes other than 1P2W, see "Wiring diagrams for direct input (connections to instrument’s terminal block)"...
- Page 38 2.2 Connecting the Measurement Lines When measuring measurement lines that exceed the maximum input current Connect the instrument using a current sensor. (For wiring modes other than 1P2W, see "Wiring diagrams when using an external cur- rent sensor" (p.173) in "5.6 Wiring Specifications".) When measuring measurement lines that exceed the maximum input, connect the instrument using a VT (PT) and CT.
- Page 39 2.2 Connecting the Measurement Lines Selecting the connection method (Example: 1P2W connection) Depending on the input level, the power meter’s instrument loss may affect measured values. Select the con- nection method below with the lower loss. Method 2 Method 1 Connect the current input terminal to the Connect the voltage input terminals to the load side.
-
Page 40: Connecting The Power Cord
2.3 Connecting the Power Cord 2.3 Connecting the Power Cord • Before turning the instrument on, make sure the supply voltage matches that indi- cated on the its power connector. Connection to an improper supply voltage may damage the instrument and present an electrical hazard. (Voltage fluctuations of ±10% from the rated supply voltage are taken into account.) •... -
Page 41: Turning On The Instrument
2.4 Turning On the Instrument 2.4 Turning On the Instrument Check the following once more before turning on the instrument: • Are the instrument and peripheral equipment connected properly? • Are any wires shorted between the voltage input terminals? If so, an electric shock or short-circuit may result. Turn the POWER switch on ( | ). -
Page 42: Performing Zero-Adjustment
2.5 Performing Zero-adjustment 2.5 Performing Zero-adjustment Zero-adjustment (offset adjustment) is performed for voltage and current measured values after the instru- ment has warmed up for approximately 30 minutes in order to ensure that its measurement accuracy specifi- cations are satisfied. Zero-adjustment consists of degaussing (DEMAG) its internal current input unit and performing offset adjustment for the voltage and current internal circuitry. -
Page 43: Activating Power To The Measurement Lines
2.6 Activating Power to the Measurement Lines 2.6 Activating Power to the Measurement Lines Before activating power to the measurement lines Before activating power to the measurement lines, turn on the instrument and verify that no errors are displayed. If any measurement target lines are live before the instrument is turned on, the instru- ment may be damaged, or an error may be displayed when it is turned on. - Page 44 2.7 Turning Off the Instrument...
-
Page 45: Chapter 3 Configuration And Measurement
3.1 Pre-Measurement Inspection Before using the instrument the first time, verify that it operates normally to ensure that the no damage occurred during storage or shipping. If you find any damage, contact your dealer or Hioki representative. Peripheral Device Inspection... -
Page 46: Configuring Settings
3.2 Configuring Settings 3.2 Configuring Settings 3.2.1 Selecting the Wiring Mode This section describes how to select the wiring mode according to the line being measured. The wiring mode cycles through the values described below each time is pressed. In the shift state, the wiring mode cycles through the values in reverse order. - Page 47 3.2 Configuring Settings Can be used to measure one 3-phase/3-wire circuit. Active power is measured by 2-power measurement 3V3A method. The line voltage and phase current, which are not measured with the 3P3W wiring mode, are actually connected to CH3, measured, and displayed. Can be used to measure one 3-phase/3-wire circuit.
-
Page 48: Selecting The Current Input Method
3.2 Configuring Settings 3.2.2 Selecting the Current Input Method This section describes how to select the current input method. The instrument can perform measurement using the current input methods listed below. The default setting is the current direct input method (setting: OFF). - Page 49 3.2 Configuring Settings Example: When the PW3337 wiring mode is 1P2W×3 Press Press to display the settings screen shown to the left. The screen varies depending on whether the wiring mode is 1P2W×2 or a mode other than 1P2W. The screen varies depending on whether the wiring mode is 1P2W×3, 1P3W&1P2W and 3P3W&1P2W, 3P3W2M, or 3V3A and 3P3W3M and 3P4W.
-
Page 50: Selecting Display Content
3.2 Configuring Settings 3.2.3 Selecting Display Content This section describes how to select the information shown on the instrument’s display. • Selecting display parameters • Selecting display channels • Selecting rectifiers "Appendix 1 Detailed Specifications of Measurement Items (Display Items)" (p. A1) See: Default settings : Voltage (V), CH1, AC+DC... - Page 51 3.2 Configuring Settings If a warning lamp or “o.r” is displayed PEAK OVER "3.11 When PEAK OVER, o.r, or the Unit See: Indicator Flashes" (p.114) SYNC. ERROR "3.2.6 Setting the Frequency Measurement See: Range" (p.53) over-range HRM ERROR "3.11 When PEAK OVER, o.r, or the See: "3.4.4 About the HRM ERROR lamp"...
- Page 52 3.2 Configuring Settings Selecting display channels This section describes how to select the channels for which the selected parameters are displayed. Default setting: CH1 Each time is pressed, the display will change as follows: The indication “sum” refers to the sum for wir- ing modes other than 1P2W.
-
Page 53: Selecting The Rectifier
3.2 Configuring Settings Selecting the rectifier The instrument provides the five rectifiers listed below. Since data for all rectifiers is processed in parallel internally, the rectifier can be switched during measurement. Displays true RMS values for all frequency bands that can be measured by the instrument for DC only, AC only, and mixed DC and AC voltage and current. -
Page 54: Selecting The Voltage And Current Ranges
3.2 Configuring Settings 3.2.4 Selecting the Voltage and Current Ranges When input exceeds 1,000 V, ±1,500 Vpeak, or 70 A, ±100 Apeak The maximum input voltage and maximum input current are 1,000 V, ±1,500 Vpeak, and 70 A, ±100 Apeak. If the maximum input voltage or maximum input current is exceeded, immediately halt measurement, deactivate power to the measurement lines, and dis- connect the cables from the instrument. -
Page 55: Automatically Setting The Range (Auto-Range Operation)
3.2 Configuring Settings Automatically setting the range (auto-range operation) Selecting auto-range operation causes the range to be switched automatically according to the measured value. This feature is convenient when you do not know the range. Setting auto-range operation Auto-range operation (p.50) See: Press to activate the shift state. - Page 56 3.2 Configuring Settings Auto-range operation During auto-range operation, the range is switched as described below: Range increased Range decreased • When the measured value exceeds 130% of When the measured value is less than 15% of the range the range (The range will not be decreased when the value would exceed the peak value for the next lower range.) •...
-
Page 57: Setting The Synchronization Source (Sync)
3.2 Configuring Settings 3.2.5 Setting the Synchronization Source (SYNC) This section describes how to set the synchronization source used to determine the cycle (between zero- cross events) that will be used as the basis for calculations. You can select from the following parameters for each connection: U1, U2, U3, I1, I2, I3, DC (fixed at 200 ms) e.g.) When the synchronization source is set to DC, the... - Page 58 3.2 Configuring Settings Press to set the synchronization source. → → → → → → Settings: ⋅⋅⋅ (Setting the source to DC will cause the SYNC. DC lamp for the set channel to light up.) Set the synchronization sources for the other channels as necessary.
-
Page 59: Setting The Frequency Measurement Range
3.2 Configuring Settings 3.2.6 Setting the Frequency Measurement Range When the synchronization source is set to voltage (U) or current (I), the SYNC. ERROR lamp will light up if the synchronization signal cannot be acquired. When the SYNC. ERROR lamp is lit up, the instrument will not be able to perform accurate measurement. - Page 60 3.2 Configuring Settings Press to display the setting screen shown to the left. The screen varies depending on whether the wiring mode is 1P2W×2 or a mode other than 1P2W. The screen varies depending on whether the wiring mode is 1P2W×3, 1P3W&1P2W and 3P3W&1P2W, 3P3W2M, or 3V3A and 3P3W3M and 3P4W.
-
Page 61: Setting The Timeout
3.2 Configuring Settings 3.2.7 Setting the Timeout Description Setting Use this setting when the frequency of the input set as the synchronization source is 10 Hz or higher. (De- 0.1 sec. fault setting) TIME OUT 1s/10s lamp off Use this setting when the frequency of the input set as the synchronization source is less than 10 Hz. 1 sec. - Page 62 3.2 Configuring Settings • When using a wiring mode other than 1P2W, the timeout setting will be standardized using the CH1 set- ting. • When using a timeout setting other than 0.1 sec. (1 sec. or 10 sec.) for channels with the 1P2W×2 or IP2W×3, 1P3W&1P2W, and 3P3W&1P2W wiring modes, set the synchronization source to the voltage or current for a channel whose timeout has been set to 1 sec.
-
Page 63: Displaying Measured Values As An Average (Avg: Averaging)
3.2 Configuring Settings 3.2.8 Displaying Measured Values as an Average (AVG: Averaging) In averaging operation, the number of averaging iterations for measured values is set, and averaged data is displayed. Used when measured values fluctuate, causing excessive variation in the display, this setting provides a way to reduce variation in display values. - Page 64 3.2 Configuring Settings Press and set the num- ber in the area to 2. The number 2 will flash, and the lamp will light up. When the setting is changed to a value other than the default setting of 1, the lamp will light up.
-
Page 65: Setting The Vt And Ct Ratio
3.2 Configuring Settings 3.2.9 Setting the VT and CT Ratio When inputting a voltage in excess of the instrument’s maximum input voltage of 1,000 V or a current in excess of its maximum input current of 70 A, use an external VT (PT) or CT, respectively. This section describes how to set the ratio (VT ratio or CT ratio) when using an external VT or CT. -
Page 66: Setting The Vt Ratio
3.2 Configuring Settings Setting the VT ratio Press Press to display the setting screen shown to the left. Press until the first digit of the VT ratio for the channel you wish to set flashes. Press to set the VT ratio. To change digits: Press until the digit you wish to set... -
Page 67: Setting The Ct Ratio
3.2 Configuring Settings Setting the CT ratio Press Press to display the setting screen shown to the left. Press until the first digit of the CT ratio for the channel you wish to set flashes. To move the decimal point: Press until the decimal point flashes, and press... - Page 68 3.3 Integration 3.3 Integration The instrument performs integration for the current and active power in the positive direction (Ah+, Wh+), in the negative direction (Ah-, Wh-), and as sums (Ah, Wh) simultaneously for all channels and can display the inte- grated value for each.
- Page 69 3.3 Integration Wiring mode and displayed integrated values : Installed? : Not installed Wiring mode Rectifier Channel − − 1, 2 AC+DC AC+DC Umn − − − − − − × 1P2W ...
-
Page 70: Starting Integration
3.3 Integration Display method Press through to select the display parameter. "3.2.3 Selecting Display Content" (p.44) See: Method for starting and stopping integration and resetting integrated values The following four methods are used to start and stop integration and reset integrated values: •... -
Page 71: Starting Integration While Adding To Previous Integrated Values (Additional Integration)
3.3 Integration Starting integration while adding to previous integrated values (additional integration) Pressing while the lamp is flashing (indicating that integration is stopped) causes integration to start while adding to previous integrated values. Press while the lamp is flashing. Additional integration will start, and lamp will light up. -
Page 72: Performing Integration After Setting An Integration Time (Timer Integration)
3.3 Integration Performing integration after setting an integration time (timer integration) You can perform integration for a certain period of time by setting the integration time. The instrument allows the integration time to be set in 1-minute increments from 1 minute to 10,000 hours. Hours Minutes Example integration time setting displays... - Page 73 3.3 Integration Press to set the integra- tion time. Setting range: 0 to 9,999.59 (When the setting display indicates 0000.00, integra- tion will be performed until 10,000 hours has elapsed.) Press to exit the settings. The instrument will return to the normal measure- ment state.
-
Page 74: Integration Precautions
3.3 Integration Integration precautions When integration starts, the voltage and current auto-range setting will be canceled, and measurement will be fixed to the range in effect when integration started. Set the range so that the PEAK OVER U (overvoltage input alarm) lamp and PEAK OVER I (overcurrent input alarm) lamp do not light up during integration. - Page 75 3.3 Integration • When performing integration for an extended period of time, it is recommended to back up the instrument with an uninterruptible power supply (UPS). The instrument’s maximum rated power is 40 VA or less. Ensure that you use a UPS with adequate capacity. When using a UPS to power the instrument, do not use a unit that produces rectangular wave or pseudo-sine wave output.
-
Page 76: Integrated Value Display Format
3.3 Integration 3.3.1 Integrated Value Display Format The following tables describe the format of integrated values after they have been reset. When the number of digits in an integrated value increases, the number of digits in the format will also increase. Similarly, when the number of digits in an integrated value decreases, the number of digits in the format will also decrease. -
Page 77: Viewing Harmonic Measured Values
3.4 Viewing Harmonic Measured Values 3.4 Viewing Harmonic Measured Values The instrument displays the results of harmonic analysis for each channel’s voltage, current, and active power. Since all calculation processing is performed in parallel internally, you can obtain harmonic measured values with simultaneity with other measured values simply by switching display parameters. - Page 78 3.4 Viewing Harmonic Measured Values The following two harmonic display methods are available: Displaying components for the same order as the display parameter (default state) Example: If [odr 1] or similar is shown in area a on the display while displaying harmonics Press to display LEVEL.
- Page 79 3.4 Viewing Harmonic Measured Values Parameters shown with normal display parameters Total harmonic voltage distortion (THD V %), total harmonic current distortion (THD A Example: THD V% Press through to display THD V THD A % in the display area. Parameters shown as fundamental wave parameters (displayed as RECTIFIER FND) Fundamental wave voltage (FND...
- Page 80 3.4 Viewing Harmonic Measured Values Parameters shown as harmonic level (LEVEL) Harmonic voltage RMS value (HRM V), harmonic current RMS value (HRM A), harmonic active power (HRM Press to display LEVEL. Press , or change the harmonic order. After pressing (1st order: fundamental wave compo- nent) →...
- Page 81 3.4 Viewing Harmonic Measured Values Parameters displayed as harmonic content percentage (HD %) Harmonic voltage content percentage (HRM V %), harmonic current content percentage (HRM A %), har- monic active power content percentage (HRM W %) Display method Press to display Press , or change the harmonic order.
-
Page 82: Setting The Analysis Order Upper Limit
3.4 Viewing Harmonic Measured Values 3.4.3 Setting the Analysis Order Upper Limit The instrument allows you to set an upper limit value for the harmonic analysis order. One example of how this setting can be used is to set a limit on the uppermost order during total harmonic distortion (THD) mea- surement. -
Page 83: About The Hrm Error Lamp
3.4 Viewing Harmonic Measured Values If the upper limit does not flash Failure of the value to flash indicates that the upper limit value cannot be changed. Take the following action to address the issue: Status Solution and reference for more information The upper limit value cannot be changed until the integrated value is reset (so that During integration operation lamp turns off). -
Page 84: Measuring Efficiency
3.5 Measuring Efficiency 3.5 Measuring Efficiency The instrument can calculate the ratio of active power values for different wires and display the result as the efficiency η [%]. This function can be used to measure the efficiency across inputs and outputs of devices such as power supply equipment and inverters. -
Page 85: Examples Of Efficiency Measurement
3.5 Measuring Efficiency Examples of efficiency measurement The following provides examples of efficiency measurement. Before making actual measurements, connect and configure the instrument as described in "Chapter 2 Measurement Preparations" (p.27). When making actual measurements, select how to connect the measurement target to the instrument based on its voltage and current so as to minimize the effects of instrument loss. - Page 86 3.5 Measuring Efficiency Measuring the input-output efficiency of a DC-to-AC (3-phase/3-wire) inverter In this example, we will measure the input-output efficiency (energy conversion efficiency) of a 3-phase/3-wire inverter with DC input and AC output. The input side of the inverter will be input to CH3 of the instrument, and the output side will be input to CH1 and CH2 of the instrument.
-
Page 87: Performing Synchronized Measurement With Multiple Instruments (Multiple-Instrument Synchronized Measurement)
3.6 Performing Synchronized Measurement with Multiple Instruments (Multiple-instrument Synchronized Measurement) 3.6 Performing Synchronized Measurement with Multiple Instruments (Multiple-instrument Synchronized Measurement) You can perform synchronized measurement by connecting multiple (up to eight: one master and up to seven slaves) instruments (PW3336/PW3337) with optional 9165 Connection Cord (BNC cable). This functionality can be used to perform simultaneous measurement of multiple circuits by operating only the instrument (PW3336/PW3337) set up as the master (instrument setting of OUT) and thereby controlling the instrument (PW3336/PW3337) set up as the slave (instrument setting of IN). -
Page 88: Connecting 2 Instruments (Pw3336/Pw3337) With A Synchronization Cable
3.6 Performing Synchronized Measurement with Multiple Instruments (Multiple-instrument Synchronized Measurement) Connecting 2 instruments (PW3336/PW3337) with a synchronization cable You will need: Two instruments, one 9165 Connection Cord Verify that both instruments (PW3336/PW3337) have been turned off. Connect the instruments’ EXT SYNC terminals with the 9165 Connection Cord. 9165 Connection Cord Turn on the two instruments (PW3336/PW3337). -
Page 89: Configuring Synchronized Measurement
3.6 Performing Synchronized Measurement with Multiple Instruments (Multiple-instrument Synchronized Measurement) Configuring synchronized measurement You can set the master and slave by configuring the synchronized control input and output settings. Turns off the synchronized control function. The EXT SYNC terminal setting is [IN], but input signals are ignored. This is the default state. External SYNC.OUT synchronized operation is not performed. -
Page 90: Ext Sync Terminal Internal Circuitry
3.6 Performing Synchronized Measurement with Multiple Instruments (Multiple-instrument Synchronized Measurement) • When drawing external synchronization from two or more instruments, be sure to set only one as the oUt power meter. Use of two or more oUt instruments may cause damage or malfunction. •... -
Page 91: External Control
3.7 External Control 3.7 External Control External control uses the EXT. CONTROL terminals. External control terminals and description of control Description Terminal name START/STOP Starts/stops integration. When a high (5 V or open) or low (0 V or shorted) signal is input to this terminal, integration starts. When the signal changes from low to high, integration stops. - Page 92 3.7 External Control • When integration is started with external control, it can only be stopped by external control. The integration set time is ignored. If you attempt to stop integration with , [Err.11] will be displayed. • A delay (data update interval) of up to 200 msec. will occur between input of the integration start signal and the actual start of integration.
-
Page 93: Connecting Wires To The External Control Terminals
3.7 External Control External control terminal internal circuit schematic +5 V 10 kΩ 100 Ω 49.9 kΩ 1000 pF Connecting wires to the external control terminals Before connecting wires to the terminals, see Handling the Instrument (p.6). To avoid an electrical accident, use the specified wire type. Connect the wires to the terminals for the parameter you wish to control. -
Page 94: Using D/A Output
3.8 Using D/A Output 3.8 Using D/A Output The PW3336-02, PW3336-03, PW3337-02, and PW3337-03 generate voltage output in response to input from the D/A OUTPUT terminals. Analog (level) output Converts the instrument’s measured values into signal levels and outputs them as a DC voltage. The output voltage is updated in response to display updates (data updates). - Page 95 3.8 Using D/A Output Output terminals and description of output Description Terminal name U1/u1 CH1 voltage level output / instantaneous voltage waveform output (selected with settings) U2/u2 CH2 voltage level output / instantaneous voltage waveform output (selected with settings) U3/u3 CH3 voltage level output / instantaneous voltage waveform output (selected with settings) I1/i1 CH1 current level output / instantaneous current waveform output (selected with settings)
- Page 96 3.8 Using D/A Output Required item: Flathead screwdriver Wires Shaft diameter:φ 3 mm Recommended cablesSingle strand diameter:φ 0.65 mm (AWG22) Multi-strand: 0.32 mm (AWG22) tip width: 2.6 mm Strand diameter: At least φ0.12 mm or greater Single strand diameter: φ0.32 mm to φ0.65 mm (AWG28 to AWG22) Usable cables Multi-strand: 0.08 mm to 0.32 mm...
-
Page 97: Analog Level Output, Waveform Output, And High-Speed Active Power Level Output
3.8 Using D/A Output 3.8.1 Analog Level Output, Waveform Output, and High-speed Active Power Level Output The instrument provides dedicated terminals for analog level output/waveform output for voltage, current, and active power as well as active power sum level output/high-speed active power sum level output. There are also terminals for high-speed active power level output (fixed output) for each channel as well as active power sum level output and high-speed active power sum level output. -
Page 98: Switching Between Analog Output And Waveform Output
3.8 Using D/A Output Switching between analog output and waveform output Press Press to display the settings screen shown to the left. Press to change the out- put method. Std.: Standard output (analog output) FASt: Fast output (waveform output) Press to exit the settings. -
Page 99: Setting The Rectifier For Analog Output
3.8 Using D/A Output Setting the rectifier for analog output Press Press to display the settings screen shown to the left. Press to select Std. Press to select the channel for which you wish to set the rectifier. → → →... - Page 100 3.8 Using D/A Output • The rectifier cannot be changed when using the FASt setting (waveform output). (The cursor cannot be moved.) • Output of 0 V will be generated for channels without data, if a rectifier is selected, or if a change in the set- tings causes the measured value to be shown as invalid data [- - - - •...
-
Page 101: D/A Output
3.8 Using D/A Output 3.8.2 D/A Output The instrument provides three analog output terminals (D/A output) for which the output parameter can be selected. "Appendix 2 Detailed Specifications of Output" (p. A5) See: Selectable output parameters and output voltages You can select three of the following parameters. (Any channel or sum can be selected for each.) Voltage, current, active power, apparent power, reactive power, time ±2 V DC for ±100% of the range average current, time average active power... - Page 102 3.8 Using D/A Output Press to set the parame- ter you wish to output. The flashing unit symbol will indicate the parameter selected for D/A output. (Default setting: → → AC+DC AC+DC Umn Rectifier settings: → → … will be displayed for parameters that cannot be output due to the wiring mode.
-
Page 103: Example Uses
3.8 Using D/A Output Example uses D/A output can be used in combination with a data logger or recorder. For more information about the output voltage, output resistance, response time, and output update rate, see "Chapter 5 Specifications" (p.135). Example uses of analog output D/A OUTPUT •... -
Page 104: Examples Of Analog Output
3.8 Using D/A Output Examples of analog output Voltage, current, active power, apparent power, reactive power, time average current, time active power Power factor Phase angle... - Page 105 3.8 Using D/A Output Voltage ripple rate, current ripple rate, total harmonic voltage distortion, total harmonic current distortion Voltage crest factor, current crest factor Although the voltage ripple rate, current ripple rate, total har- Although the voltage crest factor and current crest factor are monic voltage distortion, and total harmonic current distortion displayed up to 612.00, analog output is limited to +7 V at 35.
- Page 106 3.8 Using D/A Output Current integration, active power integration +5 V at (current or power range) × (set integration time) Integrated Start Stop Start Stop Start Stop Start value reset (1), (2), Integrated value analog output of +5 V is generated when the integrated value is a multiple of (cur- (5), (6) rent or power range) ×...
-
Page 107: Example Waveform Output
3.8 Using D/A Output Example waveform output With sine wave input with an RMS value of 150 V at Instantaneous voltage waveform output Input 50 Hz in the 150 V range voltage Voltage and current phase difference: 0° Outputs the voltage when the RMS value is 1 V. With sine wave input with an RMS value of 1 A at Instantaneous current waveform output Input... -
Page 108: Using A Current Sensor
3.9 Using a Current Sensor 3.9 Using a Current Sensor An optional current sensor can be used to measure currents in excess of the instrument’s current effective measurement range maximum of 65 A. By setting the instrument’s CT ratio based on the rating of the current sensor being used, you can read the measured current value directly. -
Page 109: Before Connecting A Current Sensor
3.9 Using a Current Sensor Before connecting a current sensor Please read Operating Precautions (p.5) carefully before connecting a current sensor to the instru- ment. When the clamp sensor is opened, do not short-circuit two wires to be measured by bringing the metal part of the clamp into contact with them, and do not use over bare conductors. -
Page 110: Connecting A Type1 Current Sensor
3.9 Using a Current Sensor Connecting a TYPE1 current sensor Connect the current sensor directly to one of the instrument’s external current sensor input terminals. Connect the clamp sensor’s BNC connector to a current input terminal. Align the groove on the BNC connector with the connector guides on the instrument and insert. - Page 111 3.9 Using a Current Sensor Verify that the instrument and 9555-10 power switches are turned off. Connect the AC adapter that came with the 9555-10 and then connect the power cord to the AC adapter. Rear Pass the AC adapter cord through the locking clamp to keep it from being pulled out.
-
Page 112: Setting External Current Sensor Input
3.9 Using a Current Sensor Setting external current sensor input This section describes how to set the type of current sensor being used, the instrument’s CT ratio, and the measurement range. These settings can be configured separately for each wiring mode. "3.2.2 Selecting the Current Input Method"... -
Page 113: Using An External Ct
3.9 Using a Current Sensor Using an external CT If energized components are exposed when connecting the current sensor, exercise care not to touch them or the CT. Doing so may result in electric shock, bodily injury, or a short-circuit accident. When using an external CT, avoid open-circuiting the secondary winding. -
Page 114: Other Functions
3.10 Other Functions 3.10 Other Functions 3.10.1Fixing Display Values (Display Hold) You can hold the display of all measured values by pressing the HOLD key (placing the instrument in the dis- play hold state). Activating display hold Press The display of measured values will be fixed when is pressed, and HOLD... -
Page 115: 2Displaying Peak, Minimum, And Maxi
3.10 Other Functions 3.10.2Displaying Peak, Minimum, and Maximum Values (Maximum Value Hold) The instrument continuously measures instantaneous, maximum, and minimum values. The display can be switched to these values with the key. • You can measure waveform peak values, for example device rush current (peak value hold). •... - Page 116 3.10 Other Functions • The following operations are not available when in the maximum value or minimum value hold state: • Range switching The instrument will display [Err.16] if any range key is pressed. (p.179) Similarly, the range will not change during auto-range operation. The range will be fixed to the range at the time the HOLD key was pressed.
-
Page 117: 3Disabling Control Keys (Key Lock)
3.10 Other Functions 3.10.3Disabling Control Keys (Key Lock) Control keys can be disabled (by placing the instrument in the key lock state) to prevent inadvertent operation during measurement. Enabling the key lock state The instrument will not accept key lock input while the KEY LOCK lamp is lit up. Press to place the instrument in the shift state and then press... -
Page 118: 4Initializing The Instrument (System Reset)
3.10 Other Functions 3.10.4Initializing the Instrument (System Reset) This section describes how to initialize the instrument’s settings. Initializing the instrument (performing a sys- tem reset) reverts settings to their default values at the time the device was shipped from the factory. The sys- tem reset should be performed while the self-test is in progress after turning on the instrument (before the display changes to the normal display). - Page 119 3.10 Other Functions Factory Settings Parameter Setting Display area a AC+DC CH1 V Display area b AC+DC CH1 A Display area c AC+DC CH1 W Display area d AC+DC CH1 PF Voltage range 300 V range (auto-range off) Current range 20 A range (auto-range off) Wiring mode 1P2W...
-
Page 120: When Peak Over, O.r, Or The Unit Indicator Flashes
3.11 When PEAK OVER, o.r, or the Unit Indicator Flashes 3.11 When PEAK OVER, o.r, or the Unit Indicator Flashes 3.11.1 If the PEAK OVER U or PEAK OVER I Lamp Lights Up e.g.) These lamps will light up if the voltage input or current input waveform peak value exceeds the figures listed below. -
Page 121: 2When O.r (Over-Range) Is Displayed
3.11 When PEAK OVER, o.r, or the Unit Indicator Flashes 3.11.2 When o.r (over-range) Is Displayed This indication is displayed when the voltage or current exceeds 140% of the range. When using the voltage 1,000 V range, it is displayed when 1,060.5 V is exceeded. For active power, [o.r] is not displayed until the 196% of the power range is exceeded, even if the voltage or current reading is shown as [o.r]. -
Page 122: 3When The Unit Indicator Flashes
3.11 When PEAK OVER, o.r, or the Unit Indicator Flashes 3.11.3 When the Unit Indicator Flashes Status Solution The unit indicator flashes during The average value being displayed contains [o.r] data. If no [o.r] data is present during averaging processing averaging processing, the unit indicator will not flash. -
Page 123: Chapter 4 Connection To A Pc
Connection to Chapter 4 a PC You can use the instrument’s standard LAN interface to connect it to a computer, which can then control it remotely. Additionally, you can also control the instrument with communications commands using the LAN, RS-232C, or GP-IB (optional feature) interface or transfer measurement data to a computer with a dedicated application*. -
Page 124: Rs-232C Settings And Connection (Before Using Command Communications)
4.1 RS-232C Settings and Connection (Before Using Command Communications) 4.1 RS-232C Settings and Connection (Before Using Command Communications) This section describes how to control the instrument using its RS-232C interface. Items to verify before configuring settings and connecting to the instrument •... -
Page 125: Setting The Rs-232C Communications Speed
4.1 RS-232C Settings and Connection (Before Using Command Communications) Setting the RS-232C communications speed Press Press to display the settings screen shown to the left. Until the number in flashes, press to select RS-232C. Press to select the com- munications speed. →... -
Page 126: Connecting The Rs-232C Cable
4.1 RS-232C Settings and Connection (Before Using Command Communications) Connecting the RS-232C Cable Recommended cable: Model 9638 RS-232C Cable (9pin-25pin/1.8m crossover cable) Connect the RS-232C cable to the instrument’s RS-232C connector. Be sure to secure it in place with the screws. Set the controller’s communications protocol so that it is the same as the instrument’s settings. - Page 127 4.1 RS-232C Settings and Connection (Before Using Command Communications) Computer Use a crossover cable with female 9-pin D-sub connectors. Recommended cable: Model 9637 RS-232C Cable (1.8 m, 9pin-9pin, crossover cable) Crossover Wiring Female 9-pin D-sub Female 9-pin D-sub PW3336, 3337-end Computer/AT-end Pin No.
-
Page 128: Lan Settings And Connection (Before Using Command Communications)
4.2 LAN Settings and Connection (Before Using Command Communications) 4.2 LAN Settings and Connection (Before Using Command Communications) Before you can control the instrument remotely with an Internet browser on a computer or use command com- munications, you must configure the instrument’s LAN settings and connect it to the computer with a LAN cable. -
Page 129: Setting The Lan's Ip Address
4.2 LAN Settings and Connection (Before Using Command Communications) Setting the LAN’s IP address Before using the LAN, set the LAN’s IP address. Press Press to display the settings screen shown to the left. Press to move among the address’s four numbers. Press to set the IP address. -
Page 130: Setting The Lan's Subnet Mask
4.2 LAN Settings and Connection (Before Using Command Communications) Setting the LAN’s subnet mask Before using the LAN, set the LAN’s subnet mask. Press Press to display the settings screen shown to the left. Press to move among the address’s four numbers. Press to set the subnet mask. -
Page 131: Setting The Lan's Default Gateway
4.2 LAN Settings and Connection (Before Using Command Communications) Setting the LAN’s default gateway Before using the LAN, set the LAN’s default gateway. Press Press to display the settings screen shown to the left. Press to move among the address’s four numbers. Press to set the default gateway. - Page 132 4.2 LAN Settings and Connection (Before Using Command Communications) Displaying the LAN’s MAC address You can check the instrument’s MAC address. The MAC address cannot be changed. Press Press to display the settings screen shown to the left. The MAC address will be displayed. Press The instrument will return to the normal measurement state.
-
Page 133: Connecting The Instrument To A Computer With A Lan Cable
4.2 LAN Settings and Connection (Before Using Command Communications) Connecting the instrument to a computer with a LAN cable Connect the instrument and PC with a LAN cable. There are two ways to accomplish this connection: • Connect the instrument to an existing network. •... - Page 134 4.2 LAN Settings and Connection (Before Using Command Communications) Making 1:1 Connections Between the Instrument and a PC 100BASE-TX You can monitor and control the instrument from a PC cross cable by connecting the instrument to the PC with LAN cable (100BASE-TX cable) Instrument Connection cable: Use one of the following.
-
Page 135: Operating The Instrument From A Pc's Browser
4.3 Operating the Instrument from a PC's Browser 4.3 Operating the Instrument from a PC's Browser You can operate from the instrument using a PC Web browser such as Internet Explorer. It is recommended to use IE (Internet Explorer) Version 9 or later. Connecting and configuring the LAN port 4.2 LAN Settings and Connection (Before Using Command Communications) (p.122) See:... -
Page 136: Operating The Instrument Remotely
4.3 Operating the Instrument from a PC's Browser Operating the instrument remotely Selecting [Remote] on the menu displays the Remote Operation screen. The screen shown on the instrument will be shown as-is in the browser window. The buttons on the control panel correspond go the buttons on the instrument. You can also operate the instrument remotely by clicking the screen with the mouse (the same key operation as the instrument). -
Page 137: Gp-Ib Interface Settings And Connection (Before Using Command Communications)
4.4 GP-IB Interface Settings and Connection (Before Using Command Communications) 4.4 GP-IB Interface Settings and Connection (Before Using Command Communications) This section describes how to control the instrument using its GP-IB interface. Items to verify before configuring settings and connecting to the instrument •... -
Page 138: Connecting The Cable To The Gp-Ib Connector
4.4 GP-IB Interface Settings and Connection (Before Using Command Communications) Specifications GP-IB Supports all source handshake functions. Supports all acceptor handshake functions. Supports standard talker functions.Supports serial poll functions.Talk only mode is not supported.Supports the talker cancel function by MLA (My Listen Address). Supports standard listener functions.Listener only mode is not supported.Supports the listener cancel func- tion by MTA (My Talk Address). -
Page 139: Setting The Gp-Ib Address
4.4 GP-IB Interface Settings and Connection (Before Using Command Communications) Setting the GP-IB address Before using the GP-IB interface, you must set the GP-IB address. Press Press to display the settings screen shown to the left. Press to select GP-IB. Press to set the GP-IB address. -
Page 140: Canceling The Remote State (Activating The Local State)
4.5 Canceling the Remote State (Activating the Local State) 4.5 Canceling the Remote State (Activating the Local State) During communications, REMOTE lamp is lit to indicate the remote control state. Control keys are disabled, with the exception of If the remote state is activated while the instrument is displaying the Settings screen, it will automatically switch to the measurement display. -
Page 141: Chapter 5 Specifications
5.1 Environmental and Safety Specifications Chapter 5 Specifications 5.1 Environmental and Safety Specifications Operating environment Indoors, altitude up to 2000 m (6562ft.), pollution degree 2 ° ° Operating temperature and 0 to 40 C (32 to 104 F), 80% RH or less (no condensating) humidity °... -
Page 142: General Specifications
5.2 General Specifications 5.2 General Specifications Input specifications PW3336 series Single-phase 2-wire(1P2W), Single-phase 3-wire (1P3W), Measurement line type Three-phase 3-wire(3P3W, 3P3W2M) Wiring (WIRING) × 1P2W 1P2W 1P2W 1P3W 1P3W 3P3W 3P3W 3P3W2M 3P3W2M PW3337 series Single-phase 2-wire (1P2W), Single-phase 3-wire (1P3W), Measurement line type Three-phase 3-wire (3P3W, 3P3W2M, 3V3A, 3P3W3M), Three-phase 4-wire(3P4W) Wiring (WIRING) - Page 143 5.2 General Specifications Power ranges For wiring modes other than 1P2W, sum power range (power ranges for individual channels are the same as for 1P2W). Current/Wiring/Voltage 15.000 V 30.000 V 60.000 V 150.00 V 300.00 V 600.00 V 1.0000 kV 1P2W 3.0000 6.0000...
- Page 144 Dedicated ports (command control, data transfer) Remote control by controller (REMOTE lamp will light up.) Cancelation of remote operation with LOCAL key (REMOTE lamp will turn off.) GP-IB interface PW3336-01/-03, PW3337-01/-03, specify at time of order) Method IEEE488.1 1987 compliant; in reference to IEEE488.2 1987 Interface functions: SH1, AH1, T6, L4, SR1, RL1, PP0, DC1, DT1, C0 Remote control by controller (REMOTE lamp will light up.)
-
Page 145: Measurement Specifications
5.3 Measurement specifications 5.3 Measurement specifications Basic Measurement Specifications Measurement method Simultaneous voltage and current digital sampling, zero-cross simultaneous calculation Sampling frequency Approx. 700 kHz A/D converter resolution 16-bit DC, 0.1 Hz to 100 kHz (Reference value of 0.1 Hz ≤ f < 10 Hz) Frequency bands Synchronization sources U1, U2, U3, I1, I2, I3, DC (fixed at 200 ms) - Page 146 5.3 Measurement specifications Measurement accuracy Voltage 50% f.s. ≤ Input < 100% f.s. 100% f.s. ≤ Input Frequency(f) Input < 50% f.s. ± ± ± ± ± 0.1%rdg. 0.1%f.s. 0.1%rdg. 0.1%f.s. 0.2%rdg. 0.1 Hz ≤ f < 16 Hz ± ±...
- Page 147 5.3 Measurement specifications Maximum effective peak ±600% of each voltage range voltage However, for 300 V, 600 V, and 1,000 V ranges, ±1,500 Vpeak Maximum effective peak ±600% of each current range current However, for 20 A range and 50 A range, ±100 Apeak Guaranteed accuracy period 1 year Conditions of guaranteed...
- Page 148 5.3 Measurement specifications Active Power Measurement Specifications (P: Displayed as W on panel display) Measurement types Rectifiers: AC+DC, DC, AC, FND, AC+DC Umn Effective measuring range 0% to 169% of the range However, defined when the voltage and current fall within the effective measurement range. Display range 0% to 196% of the range (no zero-suppression) Polarity...
- Page 149 5.3 Measurement specifications Phase Angle Measurement Specifications (φ: Displayed as ° on panel display) Measurement types Rectifiers: AC, FND Effective measuring range As per voltage, current, and active power effective measurement ranges Display range +180.00 to -180.00 Polarity Polarity is assigned according to the lead/lag relationship of the voltage waveform rising edge and the current waveform rising edge.
- Page 150 5.3 Measurement specifications Measurement types Rectifiers: AC+DC, AC+DC Umn Current: Displays the result of integrating current RMS value data (display values) once every display update interval (approx. 200 ms) as an integrated value. Active power: Displays the result of integrating active power values by polarity calculat- ed once every cycle for the selected synchronization source as integrated values.
- Page 151 5.3 Measurement specifications Constraints During integration operation and while integration is stopped, the following operational constraints apply until integrated values are reset: : Setting and changes allowed -: Setting and changes not allowed During integration operation or while integration is Item stopped Measurement range...
- Page 152 Calculates the efficiency η [%] from the ratio of active power values for channels and wires. Measurement method Wiring modes and calculation Calculated based on the AC+DC rectifier active power. equations PW3336, PW3336-01, PW3336-02, PW3336-03 Wiring (WIRING) Calculation formulas η ×...
- Page 153 5.3 Measurement specifications Voltage Crest Factor Measurement Specifications (Ucf: Displayed as CF V on panel display) Measurement method Calculates values from display values once each display update interval for voltage and voltage waveform peak values. Effective measuring range As per voltage and voltage waveform peak value effective measurement ranges. Display range 1.0000 to 612.00 (no polarity) Over-range display...
- Page 154 5.3 Measurement specifications Voltage Ripple Rate Measurement Specifications (Urf: Displayed as RF V % on panel display) Measurement method Calculates the AC component (peak to peak [peak width]) as a proportion of the voltage DC component. Effective measuring range As per voltage and voltage waveform peak value effective measurement ranges. Display range 0.00[%] to 500.00[%] Polarity...
- Page 155 5.3 Measurement specifications Window function Rectangular Analysis window width Frequency (f) Window width 45 Hz ≤ f < 56 Hz 178.57 ms to 222.22 ms (10 cycles) 56 Hz ≤ f < 66 Hz 181.82 ms to 214.29 ms (12 cycles) Frequencies other than the above 185.92 ms to 214.08 ms Data update rate...
- Page 156 5.3 Measurement specifications D/A Output Specifications (PW3336-02/-03 and PW3337-02/-03 when D/A output specified at time of order) Number of output channels Configuration 16-bit D/A converter (polarity + 15 bits) Output parameters U1 to U3 (voltage level) or u1 to u3 (instantaneous voltage waveform) (switchable) I1 to I3 (current level) or i1 to i3 (instantaneous current waveform) (switchable) P1 to P3 (active power level) or p1 to p3 (instantaneous power waveform) (switchable) Psum (active power level) or Hi-Psum (high-speed active power level) (switchable)
- Page 157 5.3 Measurement specifications Response time Level output: 0.6 sec. or less (when the input changes abruptly from 0% to 90%, or from 100% to 10%, the time required in order to satisfy the accuracy range with a synchroni- zation timeout setting of 0.1 s) Waveform output: 0.2 ms or less High-speed active power level output: 1 cycle Temperature coefficient...
- Page 158 5.3 Measurement specifications When using a current sensor with a rating of 20 A (with the CT ratio set to 0.4) 9272-10 (20 A): TYPE2; 9277: TYPE2 Voltage range Range noted Current range Wiring 15.000 V 30.000 V 60.000 V 150.00 V 300.00 V 600.00 V...
- Page 159 5.3 Measurement specifications When using a current sensor with a rating of 200 A (with the CT ratio set to 4) 9272-10 (200 A): TYPE2; 9278: TYPE2; CT6863: TYPE2 Voltage range Range noted Current range Wiring 15.000 V 30.000 V 60.000 V 150.00 V 300.00 V...
- Page 160 5.3 Measurement specifications When using a current sensor with a rating of 5,000 A (with the CT ratio set to 100) CT9667 (5,000 A): TYPE1 Voltage range Range noted Current Wiring 15.000 V 30.000 V 60.000 V 150.00 V 300.00 V 600.00 V 1.0000 kV on panel...
- Page 161 5.3 Measurement specifications When input is 100% or more of the range Frequency(f) Voltage Current, Active power ± ± 0.2%rdg. 0.8%rdg. 0.1Hz ≤ f < 16Hz ± ± 0.3%rdg. 0.4%rdg. 16Hz ≤ f < 45Hz ± ± 0.2%rdg. 0.4%rdg. 45Hz ≤ f ≤ 66Hz ±...
-
Page 162: Functional Specifications
5.4 Functional Specifications 5.4 Functional Specifications Auto-range (AUTO) Functions Automatically changes the voltage and current range for each wiring mode according to the input. Operation Pressing the SHIFT key and then the AUTO key turns on the auto-range function (caus- ing the AUTO lamp to light up). - Page 163 5.4 Functional Specifications Hold functions Hold (HOLD) Functions Stops display updates for all measured values and fixes the display values at that point in time. Measurement data acquired by communications is also fixed at that point in time. Peak exceeded and other warning lamps will still light up. Internal calculations (in- cluding integration and integration elapsed time) will continue.
- Page 164 5.4 Functional Specifications Maximum value/minimum value hold (MAX/MIN HOLD) Functions Detects maximum and minimum measured values (except integration, integration elapsed time, and time average values) as well as maximum and minimum values for the voltage and current waveform peak and holds them on the display. For data with polarity, display of the maximum value and minimum value for the data’s absolute values is held (so that both positive and negative polarity values are shown).
- Page 165 5.4 Functional Specifications Zero Adjustment (0 ADJ) Functions Degausses the current input unit DCCT and then zeroes out the voltage and current in- put offset. Compensation range Voltage: ±10% f.s. or less Current direct input: ±10% f.s. or less External current sensor input: ±10% f.s. or less Compensation operation Approx.
- Page 166 5.4 Functional Specifications Backup Functions Backs up settings and integration data if the instrument is turned off and if a power out- age occurs. System Reset Functions Initializes the instrument’s settings. Operation The system will be reset if the SHIFT key and then the RESET key are pressed when turning on the instrument.
-
Page 167: Calculation Formulas Specifications
5.5 Calculation Formulas Specifications 5.5 Calculation Formulas Specifications Basic measurement parameter calculation formulas (1) Voltage basic calculation formulas Item (RECTIFIER) Calculation formulas − ∑ RMS value (AC+DC) − Average value rectification π ∑ RMS value converted value ... - Page 168 5.5 Calculation Formulas Specifications 1. Vector calculations for 3P3W2M 3-phase/3-wire 3-phase/3-wire load 三相3線電源側 三相3線負荷側 power supply • • • 3P3W2M − Calculation formulas for 3 channels calculations using vector calculation • • • − − 2. Vector calculations for 3P3W3M 3-phase/3-wire Δ...
-
Page 169: Current Channel And Sum Value Calculation Formulas
5.5 Calculation Formulas Specifications (2) Current basic calculation formulas Item (RECTIFIER) Calculation formulas − ∑ RMS value (AC+DC) − ∑ Simple average value (DC) AC component RMS value (AC) − Fundamental wave component RMS from harmonic calculation formula 1(i) value (FND) -
Page 170: Power Channel And Sum Value Calculation Formulas
5.5 Calculation Formulas Specifications (3) Power calculation formulas Item (RECTIFIER) Calculation formulas − Active power ∑ × (AC+DC, AC+DC Umn) Active power simple average value × (DC) Active power AC component (AC) − Fundamental wave active power from harmonic calculation formula 1(i) (FND) ×... - Page 171 5.5 Calculation Formulas Specifications Item Apparent power Reactive power Wiring Basic calculation formula Basic calculation formula All channels 1P2W 1P3W 3P3W Sum values 3P3W2M 3V3A 3P3W3M 3P4W Item Power factor Phase angle Wiring Basic calculation formula Basic calculation formula All channels 1P2W λ...
- Page 172 5.5 Calculation Formulas Specifications (4) Harmonic measurement parameter calculation formulas Item Calculation formulas Harmonic voltage + Harmonic voltage content × percentage − θ Harmonic voltage phase angle − ∑ Total harmonic voltage distortion × θ θ θ − Phase difference of channel 2 relative to channel 1: −...
-
Page 173: Power Channel And Sum Value Calculation Formulas
5.5 Calculation Formulas Specifications Item Calculation formulas λ φ Fundamental wave power factor Voltage and current calculated using their respective vector calculations are used for CH3 in 3P3W2M connections and all channels in 3P3W3M connections. (i): Measurement channel; k: Analysis order; K: Maximum analysis order; r: Real part after FFT; i: Imaginary part after FFT; sic: Polarity symbol, assigned based on the fundamental wave reactive power Q polarity 1(i) -
Page 174: Wiring Specifications
5.6 Wiring Specifications 5.6 Wiring Specifications Wiring diagrams for direct input (connections to instrument’s terminal block) (1) 1-phase/2-wire (1P2W) Method 1-(2) Method 1-(1) Connect the voltage input terminals to the load side. (p.31) Method 2-(1) Method 2-(2) Connect the current input terminals to the load side. (p.31) CH (i): Measurement channel;(1, 2, 3) - Page 175 5.6 Wiring Specifications (2) 1-phase/3-wire(1P3W) Method 1:Connect the voltage input terminals to the load side. (p.31) Method 2:Connect the current input terminals to the load side. (p.31)
- Page 176 5.6 Wiring Specifications (3) 3-phase/3-wire (3P3W, 3P3W2M) Method 1:Connect the voltage input terminals to the load side. (p.31) Method 2:Connect the current input terminals to the load side. (p.31)
- Page 177 5.6 Wiring Specifications (4) 3-phase/3-wire (3V3A, 3P3W3M) Method 1:Connect the voltage input terminals to the load side. (p.31) Method 2:Connect the current input terminals to the load side. (p.31)
- Page 178 5.6 Wiring Specifications (5) 3-phase/4-wire (3P4W) Method 1:Connect the voltage input terminals to the load side. (p.31) Method 2:Connect the current input terminals to the load side. (p.31)
- Page 179 5.6 Wiring Specifications Wiring diagrams when using an external current sensor (1) 1-phase/2-wire(1P2W) Method 2-(1) Method 2-(2) Connect the current input terminals to the load side. (p.31) CH (i): Measurement channel;(1, 2, 3) (2) 1-phase/3-wire(1P3W) :Current sensor...
- Page 180 5.6 Wiring Specifications (3) 3-phase/3-wire(3P3W, 3P3W2M) (4) 3-phase/3-wire (3V3A, 3P3W3M) :Current sensor...
- Page 181 5.6 Wiring Specifications (5) 3-phase/4-wire (3P4W) :Current sensor...
- Page 182 5.6 Wiring Specifications...
-
Page 183: Chapter 6 Maintenance And Service
The regular replacement of those parts is recommended to use the instrument properly for a long time. For the replacement of the parts, please contact your authorized Hioki distributor or reseller. The useful lives of the parts depend on the operating environment and frequency of use. - Page 184 6.1 Troubleshooting Before having the instrument repaired Symptom Check Item, or Cause Remedy and Reference The display does not ap- Has the power cord been disconnected Verify that the power cord is connected properly. pear when you turn the from the instrument? Is it connected See: 2.3 Connecting the Power Cord (p.34) power on.
-
Page 185: Error Indication
Contact your authorized Hioki distributor or reseller if a repair should become necessary. Error display... - Page 186 6.2 Error Indication Error display Description Cause and Remedy This error is displayed when the voltage or current exceeds 140% of the range (or 1,060.5 V when using the 1,000 V voltage range). Over-range See: 3.11.2 When o.r (over-range) Is Displayed (p.115) 3.2.4 Selecting the Voltage and Current Ranges (p.48) This error is displayed when the display range has been exceeded due to the VT ratio or CT ratio setting.
-
Page 187: Appendix
Appendix 1 Detailed Specifications of Measurement Items (Display Items) Appendix Appendix 1 Detailed Specifications of Measure- ment Items (Display Items) PW3336, PW3336-01, PW3336-02, PW3336-03 Installed − : Not installed × Measurement items Display Rectifier Channel 1P2W 1P3W 3P3W 3P3W2M Display range ... - Page 188 Appendix 1 Detailed Specifications of Measurement Items (Display Items) Installed − : Not installed × Measurement items Display Rectifier Channel 1P2W 1P3W 3P3W 3P3W2M Display range − − 1, 2 AC+DC − − − − AC+DC − ...
- Page 189 Appendix 1 Detailed Specifications of Measurement Items (Display Items) PW3337, PW3337-01, PW3337-02, PW3337-03 Installed − : Not installed 1P3W 3P3W Measurement items Display Rectifier Channel 1P2W×3 & & 3P3W2M 3V3A 3P3W3M 3P4W Display range 1P2W 1P2W ● ● ● ●...
- Page 190 Appendix 1 Detailed Specifications of Measurement Items (Display Items) Installed − : Not installed 1P3W 3P3W Measurement items Display Rectifier Channel 1P2W×3 & & 3P3W2M 3V3A 3P3W3M 3P4W Display range 1P2W 1P2W 0000.00 to − − ● ● ● ●...
-
Page 191: Appendix 2.1Detailed Specifications Of Level Output
Appendix 2 Detailed Specifications of Output Appendix 2 Detailed Specifications of Output Appendix 2.1 Detailed Specifications of Level Output PW3336, PW3336-01, PW3336-02, PW3336-03 Installed − : Not installed Rated output volt- × Measurement items Output terminal Rectifier 1P2W 1P3W... -
Page 192: Appendix 2.2Detailed Specifications Of Waveform Output
Appendix 2 Detailed Specifications of Output Appendix 2.2 Detailed Specifications of Waveform Output PW3336, PW3336-01, PW3336-02, PW3336-03 Installed − : Not installed Output termi- Rated output volt- × Measurement items Rectifier 1P2W 1P3W 3P3W 3P3W2M ... -
Page 193: Appendix 2.3Detailed Specifications Of Selectable Items For D/A Output
Appendix 2 Detailed Specifications of Output Appendix 2.3 Detailed Specifications of Selectable Items for D/A Output PW3336, PW3336-01, PW3336-02, PW3336-03 Installed − : Not installed Rated output Measurement items Display Rectifier Channel 1P2W×2 1P3W 3P3W 3P3W2M voltage ● ●... - Page 194 Appendix 2 Detailed Specifications of Output Installed − : Not installed Rated output Measurement items Display Rectifier Channel 1P2W×2 1P3W 3P3W 3P3W2M voltage ● ● ● ● 1, 2 AC+DC − − − ● AC+DC Umn − − − −...
- Page 195 Appendix 2 Detailed Specifications of Output PW3337, PW3337-01, PW3337-02, PW3337-03 Installed − : Not installed 1P3W 3P3W Rated output Measurement items Display Rectifier Channel 1P2W×3 & & 3P3W2M 3V3A 3P3W3M 3P4W voltage 1P2W 1P2W ● ● ● ● ● ●...
- Page 196 Appendix 2 Detailed Specifications of Output Installed − : Not installed 1P3W 3P3W Rated output Measurement items Display Rectifier Channel 1P2W×3 & & 3P3W2M 3V3A 3P3W3M 3P4W voltage 1P2W 1P2W − η1, η2 ● ● ● − − − −...
-
Page 197: Appendix 3Rack Mounting
Appendix 3 Rack Mounting Appendix 3 Rack Mounting By removing the screws on the sides, this instrument can be installed in a rack mounting plate. Observe the following precautions regarding the mounting screws to avoid instrument damage and electric shock accidents. •... - Page 198 Appendix 3 Rack Mounting Installation procedure Remove the feet from the bottom of the instrument, and the screws from the sides (four near the front). × 6 mm × 6 mm Installing the spacers on both sides of the instrument, affix the rack mounting plate with the M4 ×...
-
Page 199: Appendix 4Dimensional Diagram
Appendix 4 Dimensional Diagram Appendix 4 Dimensional Diagram e.g.) PW3337-03 (Unit : mm) - Page 200 Appendix 4 Dimensional Diagram...
-
Page 201: Index Index1
Index Index Symbol External current sensor input ......42 η ................78 Factory Settings ..........113 ..............47 ...............47 FREQ. 200kHz ........... 53 AC+DC ..............47 AC+DC Umn ............47 Additional integration ..........65 GP-IB ............... 131 Auto-range ............49 GP-IB address ..........133 Averaging ............57 GP-IB connector ......... - Page 202 Index Zero-cross filter ..........53 Zero-suppression ........25, 44, 50 PEAK OVER ............ 114 Peak value hold ..........109 Power ............34, 35 Power cord ............34 Query error ............131 Rectifier .............. 47 Remote ............. 134 Replaceable parts ..........177 Resetting integrated values ........
Need help?
Do you have a question about the PW3336-01 and is the answer not in the manual?
Questions and answers