Table of Contents

Related Manuals for Hioki PW3198


Summary of Contents for Hioki PW3198
-
Page 1: Power Quality
Instruction Manual PW3198 POWER QUALITY ANALYZER July 2012 Revised edition 2 PW3198A981-02 12-07H... -
Page 3: Table Of Contents
Contents Contents Introduction ..........1 Connecting the Clamp Sensors ..34 Confirming Package Contents ....2 Turning the Power On and Off Safety Notes..........4 (Setting the Default Language) ..36 Usage Notes..........6 Chapter 4 Configuring the Chapter 1 Overview Instrument before Product Overview ...... - Page 4 Contents Initializing the Instrument (System Reset) .........73 Chapter 8 Checking Events Factory Settings .......74 (EVENT screen) 119 Using the EVENT screen ....120 Displaying the Event List ....121 Chapter 6 Monitoring Analyzing the Measurement Line Instantaneous Values Status When Events Occur ... 124 (VIEW Screen) Analyzing Transient Waveforms ..
- Page 5 Contents 13.8 GPS Time Synchronization Function ..........197 Chapter 11 Connecting 13.9 Other Functions ......197 External Devices 149 13.10Calculation Formula .......198 11.1 Using the External Control 13.11Clamp Sensors and Ranges ..211 Terminal .......... 149 13.12Block Diagram ........213 Connecting to the External Control Terminal ..........150 ...
- Page 6 Contents...
-
Page 7: Introduction
Introduction Introduction Thank you for purchasing the HIOKI PW3198 Power Quality Analyzer. To obtain maximum perfor- mance from the product, please read this manual first, and keep it handy for future reference. Clamp-on sensors (optional; see p.3) are required in order to input current to the instrument. -
Page 8: Confirming Package Contents
When you receive the instrument, inspect it carefully to ensure that no damage occurred during shipping. In particular, check the accessories, panel switches, and connectors. If damage is evi- dent, or if it fails to operate according to the specifications, contact your dealer or Hioki represen- tative. - Page 9 Confirming Package Contents Options Contact your dealer or Hioki representative for details. Clamp sensors (current measurement) Carrying cases 9660 Clamp-On Sensor C1001 Carrying Case (Soft type) C1002 Carrygin Case (Hard type) (100 A rms rated) 9661 Clamp-On Sensor...
-
Page 10: Safety Notes
Safety Notes Safety Notes This manual contains information and warnings essential for safe operation of the product and for maintaining it in safe operating condition. Before using the product, be sure to carefully read the following safety notes. This instrument is designed to comply with IEC 61010 Safety Standards, and has been thoroughly tested for safety prior to shipment. - Page 11 Safety Notes Measurement categories This instrument complies with CAT IV (600 V) safety requirements. To ensure safe operation of measurement instruments, IEC 61010 establishes safety standards for vari- ous electrical environments, categorized as CAT II to CAT IV, and called measurement categories. CAT II: Primary electrical circuits in equipment connected to an AC electrical outlet by a power cord (portable tools, household appliances, etc.)
-
Page 12: Usage Notes
Before using the instrument the first time, verify that it operates normally to ensure that the no damage occurred during storage or shipping. If you find any damage, contact your dealer or Hioki representative. Before using the instrument, make sure that the insulation on the voltage cords is undamaged and that no bare conductors are improperly exposed. - Page 13 Usage Notes Shipping precautions Hioki disclaims responsibility for any direct or indirect damages that may occur when this instrument has been combined with other devices by a systems integrator prior to sale, or when it is resold. Handling the Instrument To avoid electric shock, do not open the instrument's case.
- Page 14 Usage Notes • Use the 9217 Connection Cord (resin) when connecting to insulated BNC connector (resin), and the 9165 Connection Cord (metal) when connecting to metallic BNC con- nector (metal). If you connect metal BNC cable to insulated BNC connector, the insu- lated BNC connector can be damaged and the connection equipment may be damaged.
- Page 15 Usage Notes About the battery pack For battery operation, use only the HIOKI Model Z1003 Battery Pack. We do not take any responsibility for accidents or damage related to the use of any other batteries. • The battery pack is subject to self-discharge. Be sure to charge the battery pack before initial use.
- Page 16 Contact your dealer or Hioki representative as soon as possible. Continu- ing to use the instrument may result in fire or electric shock.
-
Page 17: Chapter 1 Overview
Overview 1.1 Product Overview The PW3198 Power Quality Analyzer is an analytical instrument for monitoring and recording power supply anomalies, allowing their causes to be quickly investigated. The instrument can also be used to assess power supply problems (voltage drops, flicker, harmonics, etc.). -
Page 18: Features
SD memory card data storage Easy downloading of data to a computer via USB or LAN By allowing the PW3198 to record data continu- ously for up to one year, the ability to use high- Separately available software simplifies analy- capacity 2 GB memory cards inspires peace of sis. -
Page 19: Measurement Flowchart
1.3 Measurement Flowchart 1.3 Measurement Flowchart Be sure to read "Usage Notes" (p.6) before measuring. Measurement is performed using the following process: See: Note: shaded areas indicate settings configured on the instrument's screen. Perform the pre-measurement inspection. 3.3 (p.31) Connect the AC adapter, voltage cords, and current clamps. 3.4 (p.32) to 3.7 (p.34) Turn on the instrument. -
Page 20: Starting And Stopping Recording
1.3 Measurement Flowchart Starting and Stopping Recording You can start and stop recording either manually or using real-time control. In either case, repeat record- ing can be used. Manual Real-time control Start Press Press to start recording at the set time and date. Stops automatically at the specified stop time. -
Page 21: Chapter 2 Names And Functions Of Parts Basic Operations & Screens
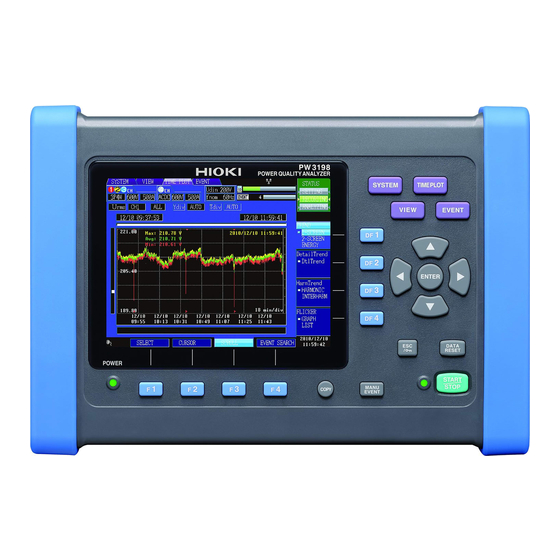
2.1 Names and Functions of Parts Names and Functions of Parts Basic Operations Chapter 2 & Screens 2.1 Names and Functions of Parts Front Operation keys Display See:(p.16) 6.5" TFT color LCD display See: "Display Items and Screen Types" (p.20) START/STOP LED POWER LED F key (Function key) - Page 22 2.1 Names and Functions of Parts Operation keys Menu keys (Screen selection) Press a key to select a screen (the lit key indicates the current selection). Displays the [SYSTEM] screen (which provides a list of system settings, event settings, recording condition settings, and memory [file] options [settings data, screen copy, measurement data]).
- Page 23 2.1 Names and Functions of Parts Upper side Voltage input jacks Connect the included L1000 Voltage Cord here. See: (p.34) Current input jacks Connect optional clamp sensors here. See: (p.34) Right side External control terminal : Allows use of external input as an event trigger.
- Page 24 2.1 Names and Functions of Parts Left side Air vents AC adapter hook Do not block these vents. Loop the AC adapter cord through this hook. See: (p.6) See: (p.32) CHARGE LED Lights up while the Z1003 Bat- Strap eyelet tery Pack is charging.
-
Page 25: Basic Operations
2.2 Basic Operations 2.2 Basic Operations To select a display screen Select the screen to display. Press , or to display the correspond- SYSTEM VIEW TIME PLOT EVENT ing screen. Press one of the keys to select and change dis- See: "2.3 Display Items and Screen Types"... -
Page 26: Display Items And Screen Types
2.3 Display Items and Screen Types 2.3 Display Items and Screen Types Common Display Items These items are displayed on every screen. Screen Types 2, 3 The tab for the currently displayed screen is shown brighter than the rest. Current CH1 to CH4 connec- Nominal input voltage and tion state, voltage range, cur- measurement... - Page 27 2.3 Display Items and Screen Types Interface status display Power supply status display Lights up when the instrument is being Lights up during normal operation. powered by the AC adapter. (White) Lights up when the instrument is both The POWER LED will turn green. connected to an HTTP server and Lights up when the instrument is being downloading data.
-
Page 28: Warning Indicators
2.3 Display Items and Screen Types Warning Indicators The instrument may display the following warnings: Solution and page number for Display Cause more information Normal screen display Switch to an appropriate clamp sensor. (Current range indicator turns red.) See: "Options" (p.3) Range or crest factor Change the settings to an appro- exceeded (current). -
Page 29: Screen Types
2.3 Display Items and Screen Types Screen Types [SYSTEM] screen is used to configure various instrument Configure settings settings. (SYSTEM screen) Press the SYSTEM key to display the [SYSTEM] screen. The screen can be changed with the keys. Zero Adjust SYSTEM See: 4.1 (p.37) - Page 30 2.3 Display Items and Screen Types MEMORY LOAD See: Chapter 9 (p.135) SETTING SAVE Displays a list of settings da- DELETE HARDCOPY VIEW Displays a list of screenshot DELETE data. LIST LOAD* Displays a list of the files DELETE stored on the SD memory card.
- Page 31 2.3 Display Items and Screen Types See: 6.5 (p.89) POWER Displays the RMS voltage, RMS current, active power, apparent power, reactive power, power factor, integral power, and K factor instantaneous values. VOLTAGE Displays the RMS voltage, voltage distortion factor, ± current peak value, current unbalance factor, harmonic voltage compo- nent, and 10-sec frequency instantaneous values.
- Page 32 2.3 Display Items and Screen Types DetailTrend See: 7.3 (p.101) DtlTrend Displays the maximum and minimum values during the TIME- PLOT interval for RMS voltage refreshed each half-cycle, inrush current, S (t), frequency cycle, or other characteristics measured in half-cycle or one-cycle units. HarmTrend See: 7.4 (p.107)
-
Page 33: Chapter 3 Measurement
3.1 Preparation Flowchart Measurement Chapter 3 Preparations 3.1 Preparation Flowchart Follow the procedure described below to prepare for measurement. "After-purchase" items need only be performed once. Perform the pre-measurement After-purchase item (4) inspection. (p.31) Install the battery pack. (p.30) After-purchase item (1) (voluntary) Back side Connect the voltage cords (p.34) and clamp sensors (p.34). -
Page 34: Initial Instrument Preparations
3.2 Initial Instrument Preparations 3.2 Initial Instrument Preparations Perform the following before starting measurement the first time. Attaching input cable labels to the voltage cords and clamp sensors Attach input cable labels to the voltage cords and clamp sensors as needed to allow identification of indi- vidual channels. -
Page 35: Bundle The Voltage Cord Leads With The Spiral Tubes
3.2 Initial Instrument Preparations Bundle the voltage cord leads with the spiral tubes The instrument ships with 20 spiral wrappers. Use the wrappers to bundle pairs of cords (colored and black) together as needed. Preparation items (Two sets of the following) L1000 Voltage Cord Alligator Clips (eight, one each red, yellow, blue, gray, and four black) Banana... - Page 36 3.2 Initial Instrument Preparations c Installing the battery pack Be sure to read the "About the battery pack" (p.9) before connecting power. The battery pack is used to power the instrument during power outages and as a backup power supply. When fully charged, it can provide backup power for approximately 180 minutes in the event of a power outage.
-
Page 37: Pre-Operation Inspection
3.3 Pre-Operation Inspection 3.3 Pre-Operation Inspection Before using the instrument the first time, verify that it operates normally to ensure that the no damage occurred during storage or shipping. If you find any damage, contact your dealer or Hioki representative. Metal Exposed... -
Page 38: Connecting The Ac Adapter
AC adapter. 3.5 Inserting (Removing) an SD Memory Card Important • Use only HIOKI-approved SD memory cards (model Z4001, etc). Proper operation is not guar- anteed if other cards are used. • Format new SD memory cards before use. - Page 39 3.5 Inserting (Removing) an SD Memory Card Open the SD memory card slot cover. To insert a card: To remove a card: Orienting the card right side up (with Push the card in and then pull it out of the slot. the [ ] mark on the top), insert the card all the way in the direction indi-...
-
Page 40: Connecting The Voltage Cords
See the instruction manual supplied with the Clamp sensor for specification details and usage procedures. Connection Procedure PW3198 current input jack Insert the clamp sensor's BNC connector, Connector, aligning... - Page 41 3.7 Connecting the Clamp Sensors During wiring, avoid touching the VT(PT), CT or input jacks. Exposed live con- tacts can cause electric shock or other accident resulting in personal injury or death. • When using an external VT (PT), avoid short-circuiting the secondary winding. If voltage is applied to the primary when the secondary is shorted, high current flow in the secondary could burn it out and cause a fire.
-
Page 42: Turning The Power On And Off (Setting The Default Language)
2. Disconnect the power cord, voltage cords, and clamp sensors from the instrument. 3. 3. Contact your dealer or Hioki representative. For best precision, allow at least 30 minutes warm-up before executing zero adjustment and measuring. Turning the power off... -
Page 43: Chapter 4 Configuring The
4.1 Warm-up and Zero-adjust Operation Warm-up It is necessary to allow the PW3198 to warm up to ensure its ability to make precise measurements. Allow the instrument to warm up for at least 30 minutes after turning it on. (p.36) -
Page 44: Setting The Clock
4.2 Setting the Clock 4.2 Setting the Clock This section describes how to set the PW3198's clock. It is recommended to check the clock before starting recording. [SYSTEM] screen [MAIN] [HARDWARE] Move Select value to change Set value Accept setting... -
Page 45: Configuring The Connection Mode And Clamp Sensors
4.3 Configuring the Connection Mode and Clamp Sensors 4.3 Configuring the Connection Mode and Clamp Sensors This section describes how to configure the connection mode and clamp sensors appropriately for the measurement line being analyzed. Eight wiring modes are available. To select the wiring mode [SYSTEM] screen... -
Page 46: Connection Diagram
4.3 Configuring the Connection Mode and Clamp Sensors Connection diagram 1P2W The vector diagram shows the measure- ment line in its ideal state. 1P3W The vector diagram shows the measure- ment line in its ideal (balanced) state. - Page 47 4.3 Configuring the Connection Mode and Clamp Sensors 3P3W2M The vector diagram shows the measure- ment line in its ideal (balanced) state. 3P3W3M The vector diagram shows the measure- ment line in its ideal (balanced) state.
- Page 48 4.3 Configuring the Connection Mode and Clamp Sensors 3P4W (CH4:ACDC) The vector diagram shows the measure- ment line in its ideal (balanced) state. 3P4W2.5E (CH4:ACDC) The vector diagram shows the measure- ment line in its ideal (balanced) state.
- Page 49 4.3 Configuring the Connection Mode and Clamp Sensors Measuring multiple systems Used for a separate system Measuring a system and a DC power supply ±24 V, ±15 V, ±5V, etc. Used for a separate system...
- Page 50 4.3 Configuring the Connection Mode and Clamp Sensors Configuring the clamp sensors [SYSTEM] screen [WIRING] Move Display the pull-down menu Select [Clamp] [CH123], [CH4] Display the pull-down menu Select the clamp sensor Accept setting Cancel...
-
Page 51: Setting The Vector Area (Tolerance Level)
4.4 Setting the Vector Area (Tolerance Level) 4.4 Setting the Vector Area (Tolerance Level) This section describes how to determine rough guidelines for verifying that the connection, range, and nominal input voltage (Udin) are correct. Changing settings causes corresponding changes in the area and position of the fan-shaped areas on the vector diagram. -
Page 52: Connecting To The Lines To Be Measured (Preparing For Current Measurement)
4.5 Connecting to the Lines to be Measured (Preparing for Current Measurement) 4.5 Connecting to the Lines to be Measured (Preparing for Current Measurement) Be sure to read the "Usage Notes" (p.6) before attaching to the lines. Connect the voltage cords and clamp sensors to the measurement line as shown in the connec- tion diagram on the screen. - Page 53 4.5 Connecting to the Lines to be Measured (Preparing for Current Measurement) Example: When using Model 9804-01 or 9804-02 Magnetic Adapter (standard screw: M6 pan head screw) Model 9804-01, 9804-02 Magnetic Adapter Attach the Model 9804-01 or 9804-02 Magnetic Adapter (option) to the Model Model L1000 L1000 Voltage Cord.
-
Page 54: Verifying Correct Wiring (Connection Check)
4.6 Verifying Correct Wiring (Connection Check) 4.6 Verifying Correct Wiring (Connection Check) Correct attachment to the lines is necessary for accurate measurements. Check the measured values and vectors on the [SYSTEM]-[WIRING] screen to verify that the con- nections have been made properly. Refer to the measured values and vector displays to verify that the measurement cables are correctly attached. - Page 55 4.6 Verifying Correct Wiring (Connection Check) In this case Check Voltage vectors: • Check that the voltage measurement clips are attached to the lines If vector direction (phase) or col- according to the wiring diagram. or is incorrect Current vectors: •...
-
Page 56: Quick Setup
What settings are affected by quick setup? For accurate measurements, settings such as range must be properly configured. When you use quick setup, the following settings are automatically configured using HIOKI-rec- ommended values according to the selected connection settings: current range, nominal input voltage, measurement frequency, event thresholds, etc. - Page 57 4.7 Quick setup Key operation during configuration (continued) [GO] The settings selected in the quick setup process will be accepted. Presets Five measurement patterns are provided. Select the pattern that best suits your application. Quick setup automatically sets appropriate values for the connections and clamp types used in measurement, set- tings other than VT/CT ratios, TIMEPLOT interval times, and thresholds used for event detection.
- Page 58 4.7 Quick setup Clamp Sensor Used Set before performing quick setup. Setting Contents: Sensor used : Current range 0.1mV/A(5 kA) : 5000A/500A 1mV/A(500 A) : 500A/50A 10mV/A(50 A) : 50A/5A 100mV/A(5 A) : 5A/500mA 9657-10 : 5A/500mA 9660 : 100A/50A 9661 : 500A/50A 9667(500 A)
-
Page 59: Verifying Settings And Starting Recording
4.8 Verifying Settings and Starting Recording 4.8 Verifying Settings and Starting Recording Once you have determined that the settings are appropriate, start recording by pressing the START/ STOP key. Verify that the event icon ( ) is not orange (indicating that the event is occurring fre- [VIEW] quently) and that measured values and waveforms on the screen are normal. -
Page 60: Using The Instrument During A Power Outage
4.9 Using the Instrument during a Power Outage 4.9 Using the Instrument during a Power Outage If the supply of power to the instrument is interrupted (for example, during a power outage), it will operate using battery power (a fully charged battery provides enough power to operate for about 180 minutes). However, the instrument will turn off about 180 minutes after the outage occurs. -
Page 61: Chapter 5 Changing Settings (As Necessary)
5.1 Changing Measurement Conditions Changing Settings Chapter 5 (as necessary) 5.1 Changing Measurement Conditions Key operation during configuration [SYSTEM] screen [MAIN] [MEASURE] Select a setting Display the pull-down menu Select a setting Accept the setting Cancel WIRING Selects the measurement line. Setting Contents:( ... - Page 62 5.1 Changing Measurement Conditions VT Ratio Sets the external VT (PT) being used. Setting Contents:( : Default setting) /60/100/200/300/600/700/1000/2000/2500/5000/ VARIABLE (0.01 to 9999.99) ClampSensor, I Range Selects the type of clamp sensor being used and current range. You can also set an output rate and use a sensor that has not been registered.
- Page 63 5.1 Changing Measurement Conditions PF Type Selects the power factor calculation method. You can select either PF (calculate using RMS values) or DPF (calculate using fundamental wave only). The displacement power factor (DPF) is generally used for power systems, while power factor (PF) is used when evaluating device efficiency. Setting Contents:( ...
-
Page 64: Changing The Measurement Period
5.2 Changing the Measurement Period 5.2 Changing the Measurement Period Key operation during configuration [SYSTEM] screen [RECORD] Select a setting Display a pull-down menu to select a setting Select a value to change Select the setting/ change the value Accept the setting Cancel Time Start Set to... - Page 65 5.2 Changing the Measurement Period Repeat Record Repeated recording operations can be conducted up to 55 days at one-day measuring intervals, and up to 55 weeks at one-week measuring intervals. The measured data file of repeated recording is saved as a separate binary file for each one-day or one-week period on the SD memory card.
- Page 66 5.2 Changing the Measurement Period Relationship between the repeat setting and the maximum repeat count When the repeat setting is [OFF] Recording stops when the START/STOP key is pressed, or at Recording starts when the START/STOP key is the stop time and date set for real-time control. pressed.
-
Page 67: Changing The Recording Settings
5.3 Changing the Recording Settings 5.3 Changing the Recording Settings Key operation during configuration [SYSTEM] screen [RECORD] Select a setting Display the pull-down menu Select a setting Accept the setting Cancel Est. Data Size Displays an estimate of the amount of data that will be saved. The estimated data volume is calculated based on the recording item, TIMEPLOT interval, real- time control, and repeated recording settings. - Page 68 5.3 Changing the Recording Settings Recording Items Sets the type of measurement data. See:"Key operation during configuration" (p.61) Setting Contents:( : Default setting) ALL DATA Records all the calculation values. P&Harm Records all calculation values except inter-harmonics. Records all calculation values except harmonics and Power inter-harmonics.
- Page 69 50 Hz), 180 cycles (60 Hz), or 1,200 cycles (400 Hz). When the memory is full The PW3198 stops recording data to the SD memory card. Recording times (reference value) for a Z4001 SD Memory Card 2GB...
-
Page 70: Changing Hardware Settings
5.4 Changing Hardware Settings 5.4 Changing Hardware Settings Key operation during configuration [SYSTEM] screen [MAIN] [HARDWARE] Select a setting Display a pull-down menu to select a setting/ Select a value to change Select the setting/ change the value Accept the setting Cancel Language Sets the display language. -
Page 71: Lcd Backlight
V10 threshold is exceeded. If selecting this set- ting, set the V10 threshold. (0.00 V to 9.99 V) RS-232C Set when connecting the PW3198 to a printer or PW9005 GPS Box with an RS-232C cable. Setting Contents:( : Default setting) ... -
Page 72: Changing Event Settings
5.5 Changing Event Settings 5.5 Changing Event Settings What is an event? See: "Appendix 2 Explanation of Power Supply Quality Parameters and Events" List of event settings Order Additional Channel Event parameter Threshold (Note 9) Note selection functionality selection (1,2,3) (4) 0 to 6000 Vpk Transient overvoltage (OFF) - Page 73 5.5 Changing Event Settings List of event settings Order Additional Channel Event parameter Threshold (Note 9) Note selection functionality selection Harmonic voltage-cur- Orders (1,2,3)(sum) 0 to 180× 2,4,5,6 rent phase difference 1 to 50 (OFF) Specify as absolute value. Total harmonic voltage (1,2,3) (4) -F/-R 0 to 100%...
- Page 74 5.5 Changing Event Settings [SYSTEM] screen [EVENT1] [VOLTAGE1] [EVENT1] [VOLTAGE2] [EVENT1] [WAVE] [EVENT2] [CURRENT] [EVENT2] [HARMONICS] [EVENT2] [POWER/etc] To turn voltage/current/power events on or off, or to adjust associated thresholds (p.69) To turn harmonic events on or off, or to adjust associated thresholds (p.70) To generate an event using an external input signal (p.71) To generate an event manually (p.71) To periodically generate an event (p.72)
- Page 75 5.5 Changing Event Settings Turning events on and off and adjusting thresholds (applies to voltage, current, and power) Select a setting [ON] [OFF] Select the setting to change it Set the threshold See: "Reference graph for use when set- ting thresholds" Accept the setting Cancel Setting Contents:( ...
- Page 76 5.5 Changing Event Settings Reference graph for use when setting thresholds You can adjust thresholds while viewing the current measured value and measurement waveform state. For events other than voltage waveform Voltage waveform comparison comparison [U_Wave] screen can be displayed with the key.
- Page 77 5.5 Changing Event Settings Generating events using an external input signal (external event settings) [POWER/etc] Events can be configured by pressing the key to display the screen. External events are detected using external control terminal (EVENT IN) shorts or pulse signal falling edge input. The voltage and current waveforms and measured values when the external event occurs can be recorded.
- Page 78 Used to observe the instance when the event is generated and the changes in the instantaneous wave- forms after that. In the case of the HIOKI PW3198, waveforms of up to one second are recorded. The waveform recorded can be displayed as continuous waveforms using the 9624-50 PQA-HiVIEW PRO HiView Pro Software.
-
Page 79: Initializing The Instrument (System Reset)
5.6 Initializing the Instrument (System Reset) 5.6 Initializing the Instrument (System Reset) If the instrument seems to be malfunctioning, consult "Before having the instrument repaired" (p.217). If the cause of the problem remains unclear, try a system reset. Key operation during configuration [SYSTEM] screen [MAIN]... -
Page 80: Factory Settings
5.7 Factory Settings 5.7 Factory Settings All settings’ default values are as follows: Measurement settings Setting Default value Setting Default value CH123: 3P4W CH123: 9661 WIRING ClampSensor CH4: ACDC CH4: 9661 CH123: 500 A Phase Name I Range CH4: 500 A CH123: 1 CH123: 1 PT Ratio... -
Page 81: Chapter 6 Monitoring Instantaneous Values (View Screen)
6.1 Using the VIEW screen Monitoring Instantaneous Values Chapter 6 (VIEW Screen) 6.1 Using the VIEW screen The VIEW screen is composed of a number of screens corresponding to the (DF: dis- play function) keys. When you press a DF key, the screen corresponding to that key appears. Each time you press the same DF key, the display changes. -
Page 82: Displaying Instantaneous Waveforms
6.2 Displaying Instantaneous Waveforms 6.2 Displaying Instantaneous Waveforms This section describes how to display the voltage and current instantaneous waveforms. Example: Waveform showing four 3P4W (3-phase, 4-wire) channels [VIEW] screen Superimposes and displays 4 channels of the voltage wave- form. [WAVE] [VOLT/CURR] Superimposes and... - Page 83 6.2 Displaying Instantaneous Waveforms Reduce or enlarge the waveform (changing the X- and Y-axis scale) [SELECT] Select the set- ting Display the pull-down menu Select the setting Accept setting Cancel Y-axis scale (U: Voltage, I: Current) To reduce the graph, decrease the scale. To enlarge the graph, increase the scale.
- Page 84 6.2 Displaying Instantaneous Waveforms Viewing the value and time over the cursor (cursor measurement) The cursor on the scroll bar shows Cursor position Scroll bar where the cursor is located relative to all measurement data. Display scope All measurement data [VOLT/CURR] display [CURSOR]...
- Page 85 6.2 Displaying Instantaneous Waveforms Scrolling through the waveform You can review all measurement data by scrolling horizontally. [SCROLL] Scroll the waveform Display scope Scroll bar Scroll bar The display scope on the scroll bar (shown in white) illustrates which range of all waveform data Display scope is being shown on the screen.
-
Page 86: Displaying Phase Relationships ([Vector] Screen)
6.3 Displaying Phase Relationships ([VECTOR] Screen) 6.3 Displaying Phase Relationships ([VECTOR] Screen) Example: 3P4W (3-phase, 4-wire) [VIEW] screen [HARMONICS] [VECTOR] Select with the key. To change the axis display (p.81) To change the RMS value/phase angle value display (p.81) To change the phase angle display method (p.81) RMS/phase angle/content percentage display (p.81) To change the harmonic number of orders (p.82) To hold the display (p.88) - Page 87 6.3 Displaying Phase Relationships ([VECTOR] Screen) Axis display You can select whether to use a linear display (LINEAR) or logarithmic display (LOG) for the vector axis. If you select the logarithmic display method, the vector is easy to see even at low levels. Settings:( ...
- Page 88 6.3 Displaying Phase Relationships ([VECTOR] Screen) Changing the harmonic number of orders You can select what value to display. When you change the number of orders, the values change along with the vector. In this case, the voltage and current unbalance factors remain the same as the values calculated using the fundamental wave (1st order).
-
Page 89: Displaying Harmonics
6.4 Displaying Harmonics 6.4 Displaying Harmonics Displaying harmonics as a bar graph Example: 3P4W (3-phase, 4-wire) [VIEW] screen Data for the channel selected here is displayed. Harmonic voltage High-order harmonic Harmonic current [HARMONICS] High-order [GRAPH] harmonic current Harmonic power Select with the key. - Page 90 6.4 Displaying Harmonics Changing the display channel, axis display, RMS/phase angle dis- play, and inter-harmonics Select the setting Display the pull-down menu Select the setting Accept setting Cancel Displayed channel Settings:( : Default) / CH2/ CH3/ CH4/sum When the 400 Hz measurement frequency is selected, harmonic analysis is performed up to the 10th order, and inter-harmonic analysis is not available.
- Page 91 6.4 Displaying Harmonics Inter-harmonics Settings:( : Default) iharmOFF iharmON The setting can also be changed without using the pull-down menu by pressing the up and down cursor keys. When the inter-harmonics display is enabled (iharmON), the screen changes as shown to the right.
-
Page 92: Displaying Harmonics As A List
6.4 Displaying Harmonics Displaying harmonics as a list The 1st to 50th harmonic orders and 0.5 to 49.5 inter-harmonic orders are displayed in a list for the selected item. Example: 3P3W3M Wiring [VIEW] screen [HARMONICS] [LIST] To change the displayed channels (p.84) To change the displayed items (p.84) To change the RMS value/phase angle display (p.84) - Page 93 6.4 Displaying Harmonics Displayed channel Settings:( : Default) / CH2/ CH3/ CH4/sum Displayed item Settings:( : Default) Voltage Current Active power RMS/phase angle/content percentage display Select the harmonics list display (RMS value display, phase angle display, or content percentage). The harmonic power phase angle indicates the harmonic voltage-current phase difference.
- Page 94 6.4 Displaying Harmonics Holding the display [HOLD] (Measured values and waveforms will be held.)
-
Page 95: Displaying Measured Values Numerically (Dmm Screen)
6.5 Displaying Measured Values Numerically (DMM Screen) 6.5 Displaying Measured Values Numerically (DMM Screen) Example: 4-channel DMM display for 3P3W3M connec- tion + channel 4 [VIEW] screen RMS voltage RMS current Active Apparent power Power [DMM] Reactive [POWER] Power Power factor Active energy (displacement power Reactive energy... - Page 96 6.5 Displaying Measured Values Numerically (DMM Screen) Holding the display [HOLD] (Measured values will be held.)
-
Page 97: Chapter 7 Monitoring Fluctuations In Measured Values
Monitoring Fluctuations in Measured Values (TIME PLOT Chapter 7 Screen) [TIMEPLOT] screen allows you to view measured value fluctuations as a time series graph. Trend and harmonic trend time series graphs: RMS voltage, RMS current, and other measured val- ues calculated every 200 ms are displayed as a time series graph. - Page 98 Display of trend data, detailed trend data, and harmonic trend data on the instrument is subject to certain constraints. Updating of the displayed time series graph will stop when the times listed in the following table are exceeded. Data will continue to be recorded to the SD memory card (see recording times (p.63)) even if updating of the displayed time series graph stops.
-
Page 99: Using The [Timeplot] Screen
7.1 Using the [TIMEPLOT] Screen 7.1 Using the [TIMEPLOT] Screen The TIME PLOT screen is composed of a number of screens that correspond to the (DF: display function) keys. When you press a DF key, the screen corresponding to that key appears.When there are multiple screens, the screen display will change every time the same DF key is pressed. -
Page 100: Displaying Trends
7.2 Displaying Trends 7.2 Displaying Trends This section describes how to generate a time series display of values calculated internally every 200 ms each TIMEPLOT interval. When using one or two screens, the maximum, minimum, and average values during the TIMEPLOT interval are shown. Example: 3P4W (3-phase, 4-wire) [TIME PLOT] Final time in displayed... - Page 101 7.2 Displaying Trends Changing the displayed items, channels, waveforms, or measured value ([1-SCREEN] [2-SCREEN] screen) [SELECT] Select Display the pull-down menu Select a setting Accept the setting Cancel Flag Indicates that a dip, swell, or interruption oc- curred during the displayed TIMEPLOT inter- val based on IEC61000-4-30 flag conversion.
- Page 102 7.2 Displaying Trends Notation meaning Symbol Measurement Items Symbol Measurement Items Symbol Measurement Items Voltage zero-phase unbalance factor Uunb0 Freq Frequency Irms RMS current current Uunb Negative-phase unbalance factor Current zero-phase unbalance factor Frequency 10 sec Average RMS current Iunb0 f10s IrmsAVG...
- Page 103 7.2 Displaying Trends Changing the displayed items ([ENERGY] screen) [SELECT] Select Display the pull-down menu Select a setting Accept the setting Cancel Displayed items Settings:( : Default) Active integration amount for WP+ consumption, WP- regeneration Reactive power WQLAG lag, WQLEAD lead...
- Page 104 7.2 Displaying Trends Enlarging or reducing the graph (changing the X- and Y-axis scale) [SELECT] Select a setting Display the pull-down menu Select a setting Accept the setting Cancel Y-axis scale (Ydiv) To reduce the graph, decrease the scale. To enlarge the graph, increase the scale. Settings:( ...
- Page 105 7.2 Displaying Trends Viewing the value and time over the cursor (Cursor measurements) You can read the value above the cursor and the time on the time series graph [CURSOR] Move the vertical cursor left Cursor right to read the time display value.
- Page 106 7.2 Displaying Trends Searching for events You can search for the time the event occurred (event marker). When recording starts and stops, start and stop events are generated. This corresponds to the event selected on the event list. [EVENT SEARCH] Skips sideways through the event Event mark...
-
Page 107: Displaying Detailed Trends
7.3 Displaying detailed trends 7.3 Displaying detailed trends Displaying a detailed trend graph for each TIMEPLOT interval This section describes how to display a time series graph for each TIMEPLOT interval for Urms1/2, Irms1/2 (inrush current), S(t), or one frequency cycle. Example: 3P4W (3-phase, 4-wire) [TIME PLOT] screen... - Page 108 7.3 Displaying detailed trends Changing the displayed items and displayed channel [SELECT] Select Display the pull-down menu Select a setting Accept the setting Cancel Displayed items Settings:( : Default) RMS voltage refreshed each half-cycle Urms1/2 RMS current refreshed each half-cycle Irms1/2 (inrush current) Freq_wav...
- Page 109 7.3 Displaying detailed trends Enlarging or reducing the graph (changing the X- and Y-axis scale) [SELECT] Select a setting Display the pull-down menu Select a setting Accept the setting Cancel Y-axis scale (Ydiv) When you want to reduce the graph, make the scale smaller. When you want to enlarge the graph, make the scale larger.
- Page 110 7.3 Displaying detailed trends Reading the value above the cursor (Cursor measurements) You can read the value above the cursor and the time on the time series graph. [CURSOR] Move the vertical cursor left and Cursor value right to read the Left: Cursor time Maximum...
- Page 111 7.3 Displaying detailed trends Scrolling through display data During recording, the X- and Y-axis are automatically scaled so that the full time series graph fits on the screen. Once recording has stopped and the X- and Y-axis scale has been changed so that the waveforms do not fit on the screen, you can scroll through the time series graph by moving left, right, up, and down.
- Page 112 7.3 Displaying detailed trends Searching for events You can search for the time (event mark) at which an event occurred. When recording starts and stops, start and stop events are generated. This corresponds to the event selected on the event list. [EVENT SEARCH] Skips sideways...
-
Page 113: Displaying Harmonic Trends
7.4 Displaying Harmonic Trends 7.4 Displaying Harmonic Trends This section descries how to select six orders and display their harmonic time series graphs. The maxi- mum, minimum, or average value during the TIMEPLOT interval can be displayed. Example: 3P4W (3-phase, 4-wire) [TIME PLOT] screen [HarmTrend]... - Page 114 7.4 Displaying Harmonic Trends Changing displayed items, displayed waveforms, and displayed mea- sured values; enlarging and reducing graphs (changing the X-axis scale); and changing the displayed order [SELECT] Select 1st-order waveform Display the pull-down menu 3rd-order Measured waveform Select a setting values Accept the setting Cancel...
- Page 115 7.4 Displaying Harmonic Trends X-axis scale (Tdiv) Selects the X-axis scale. Settings: From 1min/div AUTO scaling is used during recording. This cannot be The Y-axis scale cannot be changed. The Y-axis maximum value will be the same as the range’s full-scale value. Displayed Order Six orders can be selected and displayed at the same time.
- Page 116 7.4 Displaying Harmonic Trends Scrolling through waveforms During recording, the X-axis is automatically scaled so that the full time series graph fits on the screen. Once recording has stopped and the X-axis scale has been changed so that the waveforms do not fit on the screen, you can scroll through the time series graph by moving left and right.
-
Page 117: Displaying Flicker Values In Graph And List Form
7.5 Displaying Flicker Values in Graph and List Form 7.5 Displaying Flicker Values in Graph and List Form Flicker measurement cannot be performed during 400 Hz measurement. IEC flicker meters and V10 flicker meters Flicker meters are used to measure the sensation of visual instability that occurs due to changes in light source brightness and wavelength. - Page 118 7.5 Displaying Flicker Values in Graph and List Form Changing the displayed channel and enlarging and reducing graphs (changing the X- and Y-axis scale) [SELECT] Select a setting Display the pull-down menu Select a setting Accept the setting Cancel Displayed channel Settings:( ...
- Page 119 7.5 Displaying Flicker Values in Graph and List Form Reading the value above the cursor (Cursor measurements) This section describes how to read the Pst and Plt measured values every 10 minutes. [CURSOR] Move the vertical cursor left and right to read the display value.
-
Page 120: Displaying An Iec Flicker List
7.5 Displaying Flicker Values in Graph and List Form Displaying an IEC flicker list This section describes how to display Pst and Plt statistics along with the time and date every 10 minutes. [TIME PLOT] screen [FLICKER] [LIST] • Pst: Short interval flicker value •... -
Page 121: Displaying A V10 Flicker Fluctuation Graph
7.5 Displaying Flicker Values in Graph and List Form Displaying a V10 flicker fluctuation graph This section describes how to display a V10 flicker fluctuation graph. [TIME PLOT] screen [FLICKER] [GRAPH] Select with the key. To enlarge or reduce the graph (p.116) To read the value above the cursor (p.117) To scroll waveform data (p.117) •... - Page 122 7.5 Displaying Flicker Values in Graph and List Form Enlarging or reducing the graph (changing the X- and Y-axis scale) [SELECT] Select a setting Display the pull-down menu Select a setting Accept the setting Cancel Y-axis scale (Ydiv) When you want to reduce the graph, make the scale smaller. When you want to enlarge the graph, make the scale larger.
- Page 123 7.5 Displaying Flicker Values in Graph and List Form Reading the value above the cursor (Cursor measurements) This section describes how to read the V10 flicker measured value once a minute. [CURSOR] Move the vertical cursor left and right to read the display value.
-
Page 124: Displaying A V10 Flicker List
7.5 Displaying Flicker Values in Graph and List Form Displaying a V10 flicker list This section describes how to display the following V10 flicker statistics along with the time and date once an hour: • V10 flicker 1-hour maximum value •... -
Page 125: Chapter 8 Checking Events (Event Screen)
Analyze events. (p.124 to p.132) You can display the screen at the time the selected event occurred. Events displayed by the PW3198 • Start recording events • Stop recording events • Calculation events (events for which one or more thresholds can be set) •... -
Page 126: Using The Event Screen
8.1 Using the EVENT screen 8.1 Using the EVENT screen Pressing the key on the [EVENT] screen displays the [EVENT LIST] screen. EVENT screen About screen configuration (p.20) EVENT LIST The screen shown varies with the instrument's internal operating state. Screen operation is limited depending on the instrument's internal operating state. -
Page 127: Displaying The Event List
To analyze the transient waveform (p.126) To view high-order harmonic measured values (p.129) To check fluctuation data (p.132) • Information that is recorded as the event includes the start, stop, the PW3198 message, and event parameters set in the [SYSTEM] screen. - Page 128 8.2 Displaying the Event List Event times, list notation, and saved items Saved items Event list IN/OUT/ Event items Event High-speed Fluctuation notation SENSE Measurement items waveform waveform data All instantaneous values Transient over- Transient overvoltage Tran IN/OUT voltage waveform (Frequency, voltage, cur- Swell Swell...
- Page 129 8.2 Displaying the Event List Note1 • GPS error (GPS error): GPS IN • GPS error cleared (GPS positioning): GPS OUT • GPS time correction failure (GPS time error): GPS Err IN/OUT rules are irrelevant. Fluctuation data is only displayed for IN events. If a series of swell, dip, interrupt, or inrush current IN events occur, fluctuation data may be unavailable.
-
Page 130: Analyzing The Measurement Line Status When Events Occur
8.3 Analyzing the Measurement Line Status When Events Occur 8.3 Analyzing the Measurement Line Status When Events Occur You can display the waveform and measured values that obtained when an event occurred on the [VIEW] screen by selecting the event you wish to analyze on the [EVENT LIST] screen. - Page 131 8.3 Analyzing the Measurement Line Status When Events Occur You can change to the event generation screens (DF1 [WAVE], [HARMONICS], [DMM], and [EVENT]) by pressing a DF key from the event waveform screen. Screen transitions and measurement data when events occur Event jump function Moving the cursor to the event you wish to view on the event list and pressing the ENTER...
-
Page 132: Analyzing Transient Waveforms
8.4 Analyzing Transient Waveforms 8.4 Analyzing Transient Waveforms Displaying transients [EVENT] [LIST] Select an event for which “Tran” is shown on the event list or event details list Accept setting The display will switch to the [VIEW] screen, and the waveform at the time of the Voltage/Transient waveforms display event will be displayed. - Page 133 8.4 Analyzing Transient Waveforms Enlarging and reducing the transient waveform [SELECT] Select the setting Display the pull-down menu Select the setting Accept setting Cancel Y-axis range To reduce the waveform, increase the voltage value per division. To enlarge the waveform, reduce the voltage value per division. Setting Contents:( ...
- Page 134 8.4 Analyzing Transient Waveforms Scrolling the transient waveform You can check all waveform data by scrolling the waveform horizontally. [SCROLL] Scroll the waveform Return to event list Display scope Scroll bar Scroll bar The display scope on the scroll bar (shown in white) illustrates which range of all measurement data is Display scope...
-
Page 135: Viewing High-Order Harmonic Waveforms
8.5 Viewing High-order Harmonic Waveforms 8.5 Viewing High-order Harmonic Waveforms RMS values for noise components at 2 kHz and higher are known as the high-order harmonic component. When a high-order harmonic component event is detected, the high-order harmonic waveform is recorded. The high-order harmonic waveform is a 40 ms instantaneous waveform sampled at 200 kHz. - Page 136 8.5 Viewing High-order Harmonic Waveforms Enlarging or reducing the graph (changing the X- and Y-axis scale) [SELECT] Select the setting Display the pull-down menu Select the setting Accept setting Cancel Y-axis scale (U: Voltage, I: Current) When you want to reduce the graph, make the scale smaller. When you want to enlarge the graph, make the scale larger.
- Page 137 8.5 Viewing High-order Harmonic Waveforms Viewing the value and time at the cursor position (Cursor measure- ments) You can read the value and time at the cursor position on waveform graphs. [CURSOR] Move the vertical Cursor value cursor left and right to read the display value.
-
Page 138: Checking Fluctuation Data
8.6 Checking Fluctuation Data 8.6 Checking Fluctuation Data Fluctuation data for swell, dip, interruption, and inrush current events when an event occurs is displayed for 30 s (from 0.5 s before to 29.5 s after the event IN) as a time series graph (during 400 Hz measurement, from 0.125 s before to 7.375 s after the event IN). - Page 139 8.6 Checking Fluctuation Data • Data can be recorded regardless of the recording item settings (p.62) and the TIME- PLOT interval settings (p.63) (SYSTEM-DF1 [RECORDING]). • When an event occurs while 30 s of fluctuation data is being recorded, fluctuation data is only recorded for the first event.
- Page 140 8.6 Checking Fluctuation Data Viewing the value and time at the cursor position (Cursor measure- ments) You can read the value and time at the cursor position on time series graphs. [CURSOR] Move the vertical cursor left and right to read the display value.
-
Page 141: Chapter 9 Data Saving And File Operations (System-Memory Screen)
(SYSTEM-MEMORY Chapter 9 screen) The PW3198 saves settings data, measurement data, waveform data, event data, and screen copy data to an optional SD memory card. (Of this data, only setting conditions can be loaded by the instrument.) See:"3.5 Inserting (Removing) an SD Memory Card" (p.32) 9.1 [MEMORY] Screen... - Page 142 High-order harmonic waveform file 000001.WDU Fluctuation data file AT000000.BMP Screen data file saved once each screen copy interval PW3198.SET Settings data file at start of time series measurement TP0000.ITV Time series measurement normal binary file FL0000.FLC Time series measurement flicker data HARDCOPY <Folder>...
- Page 143 • While the root folder is being displayed, you can move to the [PW3198] folder with the right cursor key, regardless of the cursor position. • To go back one folder when the...
-
Page 144: Formatting Sd Memory Cards
SD format, resulting in decreased memory card performance. • The instrument can only store data on memory cards that use the SD format. • Use only HIOKI-approved SD memory cards (model Z4001, etc). Proper operation is not guaranteed if other cards are used. -
Page 145: Save Operation And File Structure
9.3 Save Operation and File Structure 9.3 Save Operation and File Structure Save operation Saving measurement data (p.141) Figure: Time series measurement normal data files TP0000.ITV memory B0052500 PW3198 Data is automatically saved Saving card root TP0001.ITV according to the time control method settings. - Page 146 9.3 Save Operation and File Structure File structure (overall) HARD PW3198 COPY Folder for saving screen copy data Folder naming conventions files (Example: The first set of binary data recorded on May 25, 2010) B: “B” for “binary” SETTING 0: Last digit of year...
-
Page 147: Saving, Display And Deleting Measurement Data
9.4 Saving, Display and Deleting Measurement Data 9.4 Saving, Display and Deleting Measurement Data Saving data Characteristics selected with the [Recording Items] setting are all automatically saved to the SD memory card in the binary format. Up to 100 measurement data files can be created on a single date. If an SD memory card is not inserted into the instrument, measurement data will not be saved. - Page 148 9.4 Saving, Display and Deleting Measurement Data Delete [SYSTEM] screen [LIST] Select the num- ber (No.) you wish to delete [DELETE] A deletion confirmation dialog box will be dis- played. Execute Cancel...
- Page 149 • lThe maximum displayed times of the trend data, detailed trend data, and har- monic trend data in the screen of the HIOKI PW3198 is subject to [TIME PLOT] certain constraints. To confirm all measured trend data, use the 9624-50 PQA- HiView Pro Software.
-
Page 150: Saving, Displaying, And Deleting Screen Copies
9.5 Saving, Displaying, and Deleting Screen Copies 9.5 Saving, Displaying, and Deleting Screen Copies You can save the currently displayed screen as a BMP (256-color) file. The file extension is “.bmp.” If the instrument is connected to a printer, you can also print screens (in monochrome). Save You can save (output) the screen at a given instant to the set SD memory card by pressing the while the screen you wish to save is displayed. -
Page 151: Saving And Deleting Settings Files (Settings Data)
9.6 Saving and Deleting Settings Files (Settings Data) 9.6 Saving and Deleting Settings Files (Settings Data) This section describes how to save the instrument’s current settings. [SYSTEM] screen [SETTING] [SAVE] The file will be saved. To delete a file Select the number (No.) you wish to delete [DELETE]... -
Page 152: Loading Settings Files (Settings Data)
9.7 Loading Settings Files (Settings Data) 9.7 Loading Settings Files (Settings Data) This section describes how to select and load saved settings. [SYSTEM] screen [SETTING] Select the num- ber (No.) you wish to load. [LOAD] 9.8 File and Folder Names The instrument does not allow users to create folders. -
Page 153: Chapter 10 Analyzing Data Using The Computer Application (9624-50)
The Hioki 9624-50 PQA-HiView Pro is a software application for analyzing binary-format measure- ment data from the PW3198 on a computer. The 9624-50 can load and read only binary data recorded with the Hioki PW3198. It cannot read text or CSV data. -
Page 154: Downloading Data From The Sd Memory Card
10.2 Downloading Data from the SD Memory Card 10.2 Downloading Data from the SD Memory Card Measurement data saved on the SD memory card can be downloaded to a computer using an SD mem- ory card reader or via the instrument’s LAN and USB functions. See: Connection method: "12.1 Downloading Measurement Data Using the USB Interface"... -
Page 155: Chapter 11 Connecting External Devices
HIOKI Memory HiCorder, you can record tions. waveforms on the Memory HiCorder See: "Using the event input terminal (EVENT IN)"... -
Page 156: Connecting To The External Control Terminal
11.1 Using the External Control Terminal Connecting to the External Control Terminal Be sure to read "Before Connecting Measurement Cables" (p.8) before attempting to connect the instrument to a computer. To avoid electric shocks, use the specified material only. Items to connect (required items): : 0.65 mm (AWG22) single line Electric wires that conform with:... -
Page 157: Using The Event Input Terminal (Event In)
Using the event input terminal (EVENT IN) By inputting a signal to the event input terminal externally, you can make the PW3198 determine that an external event has occurred when that event was input. Similar to other events, you can record the volt- age and current waveforms, and the measurement values of external events. -
Page 158: Using The Event Input Terminal (Event Out)
Usage method 2. Connect to the trigger input terminal of a Memory HiCorder. This allows you to record waveforms on the Memory HiCorder when events occur on the PW3198. You can record between 14 and 16 waveforms on the 3196 when events occur. When you want to record waveforms for a longer period of time, use the 3196 in parallel with a Memory HiCorder. - Page 159 11.1 Using the External Control Terminal Event output can be set for ENKAKU. By setting the [External Out] setting to [Long Pulse], the instrument can be configured to generate event output for the 2300 ENKAKU and similar hardware. [SYSTEM] screen [MAIN] [HARDWARE] [External Out]...
- Page 160 11.1 Using the External Control Terminal...
-
Page 161: Chapter 12 Operation With A Computer
Operation with a Chapter 12 Computer The instrument includes standard USB and Ethernet interfaces to connect a computer for remote control. The instrument can be controlled by communication commands, and measurement data can be transferred to the computer using the dedicated application program. USB Connection Capabilities •... -
Page 162: Downloading Measurement Data Using The Usb Interface
12.1 Downloading Measurement Data Using the USB Interface 12.1 Downloading Measurement Data Using the USB Interface Since the instrument includes a standard USB interface, measurement data can be transferred to a USB- connected computer (using the instrument’s mass storage function). Connect the instrument to the computer with a USB cable. -
Page 163: Control And Measurement Via Ethernet ("Lan") Interface
The instrument does not support network environments where an IP address is automatically acquired using DHCP. Configure the router to assign a fixed IP address to the PW3198. For more information about router settings, see the instruction manual for your wireless LAN router. -
Page 164: Lan Settings And Network Environment Configuration
12.2 Control and Measurement via Ethernet ("LAN") Interface LAN Settings and Network Environment Configuration Configure the Instruments LAN Settings • Make these settings before connecting to a network. Changing settings while connected can duplicate IP addresses of other network devices, and incorrect address information may otherwise be presented to the network. - Page 165 IP address is freely settable. Use the recommended private IP addresses. IP Address : Computer : 192.168.1.1 : PW3198 : 192.168.1.2 (Set to a different IP address than the computer.) Subnet Mask : 255.255.255.0 Default Gateway: Computer : ___.___.___.___...
-
Page 166: Instrument Connection
• Straight-through Cat 5, 100BASE-TX-compliant Ethernet cable (up to 100 m, commercially available). For 10BASE communication, a 10BASE-T-compliant cable may also be used. • 9642 LAN Cable Hioki (option) When connecting one instrument to a single computer (prepare any of the following): •... - Page 167 Connect to the Ethernet jack on the instrument. Connect to a 100BASE-TX hub. When connecting the instrument to a single computer (connect the instrument to the computer) Use the Hioki 9642 LAN Cable and cross-over adapter (9642 accessory) Cross-conversion Ethernet cable...
-
Page 168: Remote Control Of The Instrument By Internet Browser
12.3 Remote Control of the Instrument by Internet Browser 12.3 Remote Control of the Instrument by Inter- net Browser The instrument includes a standard HTTP server function that supports remote control by an internet browser on a computer. The instrument's display screen and control panel keys are emulated in the browser. Operating proce- dures are the same as on the instrument. -
Page 169: Operating Procedure
12.3 Remote Control of the Instrument by Internet Browser Operating Procedure Click the [Remote Control Screen] link to jump to the Remote Control page. Click If a password has been set, the following page will be displayed: Input Enter the password and click the [SET] button to display the control panel in the browser window. -
Page 170: Converting Binary Data To Text Data
12.4 Converting Binary Data to Text Data Instrument screen emulation Control panel emulation Auto display update Click on the control panel keys to perform the same operations as the instrument keys. To enable automatic browser screen updating, set the Update Time in the Auto Update menu Auto display The instrument screen emulation updates at the specified interval. -
Page 171: Chapter 13 Specifications
13.1 Environmental Safety Specifications Chapter 13 Specifications 13.1 Environmental Safety Specifications Operating environment Indoors, altitude up to 3,000 m (measurement category is lowered to 600 V Cat III when above 2,000 m), Pollution degree 2 Storage temperature and humidity -20 to 50°C (-4 to 122°F) 80% RH or less (non-condensating) (If the instrument will not be used for an extended period of time, remove the battery pack and store in a cool location [from -20 to 30°C (-4 to 86°F)].) Operating temperature and humidity 0 to 50°C (32 to 122°F) 80% RH or less (non-condensating) -
Page 172: Basic Specifications
× Slot SD standard compliant Compatible card SD memory card/ SDHC memory card (Use only HIOKI-approved SD memory cards) Supported memory capacity SD memory card: Up to 2GB, SDHC memory card: Up to 32GB Functions Saving of binary data (settings data) (up to 9,999 files) Up to 100 files of measurement data can be saved on the same date. - Page 173 13.2 General Specifications (3) LAN Interface Functions 1. HTTP server function (compatible software: Internet Explorer Ver.6 or later Remote operation application function, measurement start and stop control functions, system configuration function, event list function (capable of displaying event waveforms, event vectors, and event harmonic bar graphs) 2.
- Page 174 13.2 General Specifications Accessories and Options Specifications Voltage measurement options Voltage Cord Leads (banana male-to-male with dolphin clip, one each red and black, about 3m long) 9804-01 Magnetic Adapter (1 red) 9804-02 Magnetic Adapter (1 Black) 9243 Grabber Clip (1 each red and black) Printer options (Not applicable to CE Marking) 9670 Printer (BL-100W made by SANEI ELECTRIC INC.)
-
Page 175: Measurement Specifications
13.3 Measurement Specifications 13.3 Measurement Specifications Measurement items (1) Items detected at 2 MHz sampling without a gap Measurement items Nota- 1P2W 1P3W 3P3W2M 3P3W3M 3P4W 3P4W2.5E MAX/MIN/AVG tion Transient overvoltage Tran 1,2,4 1,2,4 1,2,3,4 1,2,3,4 1,3,4 (2) Items measured without gaps for each waveform Measurement Notation 1P2W... - Page 176 13.3 Measurement Specifications (5) Items measured without gaps and aggregated every approx. 200 ms (about once every 10 cycles at 50 Hz, every 12 cycles at 60 Hz, or every 80 cycles at 400 Hz) Measurement items Notation 1P2W 1P3W 3P3W2M 3P3W3M 3P4W...
- Page 177 13.3 Measurement Specifications Conditions of Guaranteed Accuracy Conditions of guaranteed Warm-up time of at least 30 minutes, power factor = 1, common-mode voltage of 0 V, input of at accuracy least 1.666% f.s. to reference channel after zero adjustment ° °...
- Page 178 13.3 Measurement Specifications Frequency cycle (Freq_wav) Measurement method Calculated as the reciprocal of the accumulated whole-cycle time during one U1 (reference chan- nel) cycle. Frequency is given per waveform. When set to a measurement frequency of 400 Hz, calculated as the reciprocal of the accumulated whole-cycle time during 8 cycles.
- Page 179 13.3 Measurement Specifications RMS current refreshed each half-cycle (Irms1/2) Measurement method IEC61000-4-30 compliant When the measurement frequency is set to 50/60 Hz, the RMS current is calculated using current waveform data sampled every half-cycle (synchronized to the voltage of the channel in question). When the measurement frequency is set to 400 Hz, the RMS current is calculated for the current waveform once each cycle.
- Page 180 13.3 Measurement Specifications Dip (Dip) Measurement method IEC61000-4-30 compliant During 50/60 Hz measurement, a dip is detected when the RMS voltage refreshed each half-cycle exceeds the threshold in the negative direction. During 400 Hz measurement, a dip is detected when the minimum of 4 RMS voltage values occur- ring within 10 ms (values calculated for one 400 Hz waveform) exceeds the threshold in the neg- ative direction.
- Page 181 13.3 Measurement Specifications Instantaneous flicker value (S(t)) Measurement method As per IEC61000-4-15 User-selectable from 230 Vlamp/120 Vlamp (when Pst and Plt are selected for flicker measure- ment)/4 types of Ed2 filter (230 Vlamp 50/60 Hz, 120 Vlamp 60/50 Hz) Displayed item Instantaneous flicker value Measurement range, resolution 99.999, 0.001...
- Page 182 13.3 Measurement Specifications Voltage waveform peak (Upk) Measurement method Measured every 10 cycles (50 Hz) or 12 cycles (60 Hz); maximum and minimum points sampled during approx. 200 ms aggregation. During 400 Hz measurement, measured every 80 cycles; maximum and minimum points sampled during approx.
- Page 183 13.3 Measurement Specifications RMS voltage (Urms) Measurement method AC+DC True RMS type IEC61000-4-30 compliant: 10 cycles (50 Hz) or 12 cycles (60 Hz) (approx. 200 ms aggregation) During 400 Hz measurement, calculated from 80 cycles (approx. 200 ms aggregation) When set to 3P3W3M/3P4W/3P4W2.5E, the phase voltage/line voltage setting is applied to the RMS voltage Urms.
- Page 184 13.3 Measurement Specifications RMS current (Irms) Measurement method AC+DC True RMS type IEC61000-4-30 compliant: 10 cycles (50 Hz) or 12 cycles (60 Hz) (approx. 200 ms aggregation) During 400 Hz measurement, 200 kHz sampling at 80 cycles (approx. 200 ms aggregation) Includes zero suppression.
- Page 185 13.3 Measurement Specifications Active power (P) Measurement method Measured every 10 cycles (50 Hz) or 12 cycles (60 Hz) (approx. 200 ms aggregation). During 400 Hz measurement, measured every 80 cycles (approx. 200 ms aggregation) Includes zero suppression. Sampling frequency 200 kHz Displayed item Active power for each channel and sum value for multiple channels...
- Page 186 13.3 Measurement Specifications Apparent power (S) Measurement method Calculated from RMS voltage U and RMS current I. No polarity Sampling frequency 200 kHz Displayed item Apparent power of each channel and its sum for multiple channels. (For details, see "13.10 Calculation Formula" (p.198)) Measurement range, resolution Depends on the voltage ×...
- Page 187 13.3 Measurement Specifications Power factor and displacement power factor (PF, DPF) Measurement method Power factor : Calculated from RMS voltage U, RMS current I, and active power P. Displacement power factor : Calculated from the phase difference between the fundamental voltage wave and the fundamental current wave. Lag phase (LAG: current lags voltage) : Unsigned Lead phase (LEAD: current leads voltage) : Negative...
- Page 188 13.3 Measurement Specifications Current unbalance factor (negative-phase unbalance factor, zero-phase unbalance factor) (Iunb, Iunb0) Measurement method For 3-phase 3-wire (3P2W2M and 3P3W3M) and 3-phase 4-wire, calculated using 3-phase funda- mental current component (For details, see "13.10 Calculation Formula" (p.198).) Sampling frequency 200 kHz Displayed item Negative-phase unbalance factor (Iunb), zero-phase unbalance factor (Iunb0)
- Page 189 13.3 Measurement Specifications Harmonic voltage and harmonic current (including fundamental component) (Uharm/Iharm) Measurement method Uses IEC61000-4-7:2002. Max. order: 50th Anti-aliasing low-pass filter causes attenuation of frequencies other than measurement target of at least 50 dB. Indicated harmonic voltage and harmonic current values incorporate inter-harmonics components adjacent to the next whole-number harmonic component after harmonic analysis.
- Page 190 13.3 Measurement Specifications Measurement accuracy with a fundamental wave of 50/60 Hz Harmonic input Measurement accuracy Notes : 0.3% rdg.0.08%f.s. Voltage At least 1% of Order 0 Specified with a nominal : 5.00% rdg. nominal Order 1+ voltage of at least 100 V. voltage : 0.3% rdg.0.08%f.s.
- Page 191 13.3 Measurement Specifications Harmonic voltage phase angle and Harmonic current phase angle (including fundamental component) (Uphase/Iphase) Measurement method Uses IEC61000-4-7:2002. Max. order: 50th Anti-aliasing low-pass filter causes attenuation of frequencies other than measurement target of at least 50 dB. Analysis window width 10 cycles (50 Hz), 12 cycles (60 Hz), or 80 cycles (400 Hz) No.
- Page 192 13.3 Measurement Specifications Total harmonic voltage and Total harmonic current distortion factor (Uthd, Ithd) Measurement method Uses IEC61000-4-7:2002. Max. order: 50th Anti-aliasing low-pass filter causes attenuation of frequencies other than measurement target of at least 50 dB. Analysis window width 10 cycles (50 Hz), 12 cycles (60 Hz), or 80 cycles (400 Hz) No.
- Page 193 13.3 Measurement Specifications Voltage waveform comparison (Wave) Measurement method A judgment area is automatically generated from the previous 200 ms aggregation waveform, and events are generated based on a comparison with the judgment waveform. Waveform judgments are performed once for each 200 ms aggregation. Comparison window width 10 cycles (50 Hz), 12 cycles (60 Hz), or 80 cycles (400 Hz) No.
- Page 194 13.3 Measurement Specifications V10 Flicker (dV10) Measurement method "13.10 Calculation Formula" (p.198) Calculated values are subject to 100 V conversion following gap-less measurement once each minute. Standard voltage Automatic (with AGC) V10 measured at one minute intervals, average value for one hour, maximum value for one hour, Displayed item fourth largest value for one hour, total (within the measurement interval) maximum value Measurement range, resolution...
-
Page 195: Event Specifications
13.4 Event Specifications Flag concept IEC61000-4-30 flag concept When a dip, swell, or interruption compromises the reliability of a value, a flag is attached to the measurement data. Flags are referenced when determining the slide reference voltage and interruption frequency and recorded along with TIMEPLOT data status information. -
Page 196: Operating Specifications
13.5 Operating Specifications 13.5 Operating Specifications Operating modes Three modes: [SETTING], [RECORDING] (including [WAITING]), and [ANA- LYZING] A group of screens including [SYSTEM], [VIEW], [TIMEPLOT], and [EVENT] displays groups exists for each mode. Recording start Recording starts at a round TIMEPLOT interval time. For TIMEPLOT intervals of 150/180 cycles, recording starts in 1-minute increments. -
Page 197: Measurement And Analysis Function Specifications
13.6 Measurement and Analysis Function Specifications 13.6 Measurement and Analysis Function Speci- fications [VIEW] screen Mode Display Display Displayed screens updates [SETTING] Real-time data Approx. Waveform display, vector display, DMM display, harmonic bar graph [RECORDING] 0.5 s display, harmonic list display [ANALYZING] Event data selected on Waveform display, transient overvoltage waveform display, DC wave-... - Page 198 13.6 Measurement and Analysis Function Specifications [TIME PLOT] screen Trend graph display Displayed screens 1-screen/2-screen/Energy Displayed content Time series graph of maximum, minimum, and average values for 1 item on 1-screen display or 2 items on 2-screen display Select from Freq, Freq10s, Upk+, Upk-, Ipk+, Ipk-, Urms, UrmsAVG, Udc, Irms, IrmsAVG, Idc, P, S, Q, PF, DPF, Uunb0, Uunb, Iunb0, Iunb, UharmH, IharmH, Uthd-F, Uthd-R, Ithd-F, Ithd-R, and KF.
- Page 199 13.6 Measurement and Analysis Function Specifications V10 flicker list display (when flicker is set to V10) Display refresh rate Every 1 min (V10 overall maximum value), every 1 hr (others) Display selection CH1 to CH3 (varies with connection) Constraints No display for 400 Hz measurement IEC flicker graph display (when flicker is set to IEC [Pst, Plt])
-
Page 200: Configuration Function Specifications
13.7 Configuration Function Specifications 13.7 Configuration Function Specifications Detailed description of Urms type, PF type, THD type, and harmonics Urms type PF type THD type Harmonics Selection Details Measured value Selection is applied to RMS voltage (Urms) only Selection is Selection is (DMM screen) and does not affect RMS voltage refreshed... - Page 201 13.7 Configuration Function Specifications Quick setup pattern details Pattern Abnormal voltage Basic power supply Inrush current Measured value EN50160 Setting detection quality measurement measurement recording Connection Set in advance Clamp sensor Set in advance CT, PT ratios Set in advance Measurement frequen- Automatic detection of 50/60/400 Hz;...
- Page 202 13.7 Configuration Function Specifications Quick setup pattern details Pattern Abnormal voltage Basic power supply Inrush current Measured value EN50160 Setting detection quality measurement measurement recording Voltage unbalance OFF, 3% OFF, 3% OFF, OFF OFF, OFF OFF, 2% factor (zero-phase, negative-phase) Current unbalance OFF, OFF OFF, OFF...
-
Page 203: Gps Time Synchronization Function
If the time variation is greater than 16 ms, a GPS Err event occurs, and time correction is not performed. • When synchronizing the time among multiple PW3198 instruments, 200 ms aggregation start times may vary for up to 10 minutes from the start of recording. -
Page 204: Calculation Formula
13.10 Calculation Formula 13.10 Calculation Formula RMS voltage refreshed each half-cycle (Urms1/2), Dip (Dip), Swell (Swell), interrup- tion (Intrpt), RMS current refreshed each half-cycle (Irms1/2), inrush current (Irms1/2) Single- Connection setting Three-phase Single-phase 2-wire phase 3- Three-phase 3-wire Three-phase 3-wire 4-wire 1P2W wire... - Page 205 13.10 Calculation Formula RMS Voltage (Urms), RMS Current (Irms) Phase Single Phase 3-Phase, 3-Wire, 3-Phase, 3-Wire, Single Phase 2-wire 3-Phase, 4-Wire System 3-wire 2-Measurement 3-Measurement 1P2W 3P4W Items 1P3W 3P3W2M 3P3W3M Urms Line-to-line voltage Line-to-line voltage Phase voltage – – ...
- Page 206 13.10 Calculation Formula Active Power (P), Apparent Power (S), Reactive Power (Q) Single Phase 3-Phase, 3-Wire, 3-Phase, 3-Wire, Phase Single Phase 2-wire 3-Phase, 4-Wire System 3-wire 2-Measurement 3-Measurement 1P2W 3P4W Items 1P3W 3P3W2M 3P3W3M – Ucs Ics -- - Psum=P Psum=P...
- Page 207 13.10 Calculation Formula Power factor (PF), Displacement power factor (DPF) Single Phase 3-Phase, 3-Wire, 3-Phase, 3-Wire, Phase Single Phase 3-wire 3-Phase, 4-Wire System 2-wire 2-Measurement 3-Measurement 1P3W 3P4W Items 1P2W 3P3W2M 3P3W3M sic Pc PFc= ----- - PFsum= PFsum= PFsum= PFsum= sisum sisum...
- Page 208 13.10 Calculation Formula Voltage unbalance factor, Current unbalance factor Phase Single Single 3-Phase, 3-Wire, 3-Phase, 3-Wire, System Phase Phase 3-Phase, 4-Wire 2-Measurement 3-Measurement 2-wire 3-wire 3P4W Items 3P3W2M 3P3W3M 1P2W 1P3W Voltage Uzero Uzero Uzero Uunb0 Uunb0 Uunb0 --------------- - --------------- -...
- Page 209 13.10 Calculation Formula Current zero-phase component Izero [A] Izero -- - seq2 seq3 seq2 seq3...
- Page 210 13.10 Calculation Formula Harmonic Voltage (Uharm), Harmonic Current (Iharm), Inter-harmonic voltage (Uiharm), Inter-harmonic current (Iiharm) 3-Phase, 3-Phase, Single Phase System 3-Wire, 3-Wire, 3-Phase, Single Phase 2-wire Phase 2-Measure- 3-Measure- 4-Wire 1P2W 3-wire Items ment ment 3P4W 1P3W 3P3W2M 3P3W3M Uharm[Vrms]=Uck (including adjacent inter-harmonic com- ponents) ...
- Page 211 13.10 Calculation Formula Harmonic Voltage (Uharm), Harmonic Current (Iharm), Inter-harmonic voltage (Uiharm), Inter-harmonic current (Iiharm) 3-Phase, 3-Phase, Single Phase System 3-Wire, 3-Wire, 3-Phase, Single Phase 2-wire Phase 2-Measure- 3-Measure- 4-Wire 1P2W 3-wire Items ment ment 3P4W 1P3W 3P3W2M 3P3W3M Iiharm[Arms]=Ick ...
- Page 212 13.10 Calculation Formula Harmonic Power (Pharm), Harmonic Reactive Power (Qharm), K Factor (KF) 3-Phase, Phase System Single Single Phase 2- 3-Wire, 3-Phase, Phase 3-Phase, 3-Wire, 3-Measurement wire 2-Mea- 4-Wire 3-wire 3P3W3M Items 1P2W surement 3P4W 1P3W 3P3W2M Pharm[W]=Pck I ...
- Page 213 13.10 Calculation Formula Total Harmonic Voltage Distortion Factor (Uthd-F, Uthd-R) and Total Harmonic Cur- rent Distortion Factor (Ithd-F, Ithd-R) 3-Phase, 3-Phase, Single Phase 3-Phase, Phase System Single Phase 2-wire 3-Wire, 3-Wire, 3-wire 4-Wire 1P2W 2-Measurement 3-Measurement Items 1P3W 3P4W 3P3W2M 3P3W3M Uthd-F[%] THDUF1...
- Page 214 13.10 Calculation Formula Harmonic Voltage Phase Angle (Uphase), Harmonic Current Phase Angle (Iphase), Phase Difference Of Harmonic Voltage And Harmonic Current (Pphase) 3-Phase, 3-Wire, 3-Phase, 3-Wire, Phase System Single Phase 2-wire Single Phase 3-wire 3-Phase, 4-Wire 2-Measurement 3-Measurement 1P2W 1P3W 3P4W Items 3P3W2M...
- Page 215 13.10 Calculation Formula Active energy (WP), reactive energy (WQ) 3-Phase, 3-Phase, Phase System Single Phase 3-Wire, 3-Wire, 3-Phase, Single Phase 2-wire 3-wire 2-Measure- 3-Measure- 4-Wire 1P2W 1P3W ment ment 3P4W Items 3P3W2M 3P3W3M WP1+= WPsum+= • h: measurement period; k: coefficient for converting to 1 hour •...
- Page 216 13.10 Calculation Formula Average calculation Average calculation methods CH1 to 4 sum/AVG Comment Freq Signed average Same as Freq10s. Signed average Signed average Urms Average results for all channels are av- eraged. Irms Average results for all channels are av- eraged.
-
Page 217: Clamp Sensors And Ranges
13.11 Clamp Sensors and Ranges 13.11 Clamp Sensors and Ranges The instrument's current ranges are as follows: Current sensor Current range 0.1 mV/A (5 kA) 5.0000 kA/500.00 A 1 mV/A (500 A) 500.00 A/50.000 A 10 mV/A (50 A) 50.000 A/5.0000 A 100 mV/A (5 A) 5.0000 A/500.00 mA 9657-10... - Page 218 13.11 Clamp Sensors and Ranges The instrument's power ranges are as follows: The effective power (unit, W), apparent power (unit, VA) and reactive power (unit, var) per channel. Current range Power range 5.0000kA 3.0000M 1.0000kA 600.00k 500.00A 300.00k 100.00A 60.000k 50.000A 30.000k 10.000A...
-
Page 219: Block Diagram
13.12 Block Diagram 13.12Block Diagram Voltage Input Circuit U1 to U3 High-Speed Power Analysis Engine HiPAC-PQ SD memory card Insulated Voltage Input Circuit U4 Insulated Current Sensor Input Circuit... - Page 220 13.12 Block Diagram...
-
Page 221: Chapter 14 Maintenance And Service
14.1 Cleaning Maintenance Chapter 14 and Service 14.1 Cleaning Instrument • To clean the instrument/ device/ product, wipe it gently with a soft cloth moistened with water or mild detergent. Never use solvents such as benzene, alcohol, acetone, ether, ketones, thinners or gasoline, as they can deform and discolor the case. •... -
Page 222: Trouble Shooting
• If damage is suspected, check the "Before having the instrument repaired" (p.217) section before con- tacting your dealer or Hioki representative. However, in the following circumstances, you should stop using the instrument, unplug the power cord, and contact your nearest Hioki distributor: •... - Page 223 14.2 Trouble Shooting Before having the instrument repaired Before returning for repair Symptom Check Item, or Cause Remedy and Reference The display does Has the power cord been disconnected? Verify that the power cord is connected appear when Is it connected properly? properly.
-
Page 224: Error Indication
Corrective action/more information FPGA initializing error FPGA initializing error. DRAM1, 2 error DRAM error. SRAM error error. SRAM The instrument needs to be repaired. Contact your Hioki Invalid FLASH. FLASH error. distributor. Invalid ADJUST. Adjustment value error. Invalid Backuped values. more... - Page 225 To delete them, use a computer. [HARDCOPY] folder. *** CARD ERROR *** An SD memory card error Contact Hioki with information about the instrument’s SD-CARD ERROR. other than those listed above operational status at the time of the error. occurred.
- Page 226 14.3 Error Indication Error display Cause Corrective action/more information *** OPERATION ERROR *** A key such as the DATA In the standby state before recording has begun, stop Operation not available while RESET key that cannot be recording with the START/STOP key.
-
Page 227: Disposing Of The Instrument
14.4 Disposing of the Instrument 14.4 Disposing of the Instrument The PW3198 uses lithium batteries as a power source for saving measurement conditions. When disposing of this instrument, remove the lithium battery and dispose of battery and instru- ment in accordance with local regulations. - Page 228 14.4 Disposing of the Instrument Remove the 17 screws shown in the following diagram and remove the upper chassis. Upper chassis Insert the tweezers between the battery holder and the battery and lift up the battery to remove it. Lithium battery CALIFORNIA, USA ONLY This product contains a CR Coin Lithium...
-
Page 229: Appendix A1
By measuring power supply quality parameters, you can assess the power supply's quality and identify the causes of various power supply malfunctions. The PW3198's ability to measure all power supply quality parameters simultaneously makes this process a quick and simple one. - Page 230 • Continue recording for the necessary period, check the state of the power supply malfunction based on the detected events, and take corrective action as appropriate. (The PW3198 can be used not only for the investigation phase, but also to verify the effectiveness of corrective action taken.)
- Page 231 Appendix 1 Procedure for Investigating Power Supply Quality Advice for identifying the cause of abnormalities Record voltage and current trends at the power circuit inlet. If current consumption in a building is high while the voltage is low, the cause likely lies inside the build- ing.
-
Page 232: Appendix 2 Explanation Of Power Supply Quality Parameters And Events
By measuring these parameters, it is possible to assess power supply quality. In order to allow the PW3198 to detect abnormal values and abnormal waveforms, you set thresholds. When these thresholds are exceeded, events are generated. - Page 233 Appendix 2 Explanation of Power Supply Quality Parameters and Events Principal parameters PW3198 events and Waveform Phenomenon Primary issues indicating measurements power quality Flicker consists of volt- Because this phenom- Events are measured using V10 flicker and age fluctuations result-...
- Page 234 Appendix 2 Explanation of Power Supply Quality Parameters and Events Principal parameters PW3198 events and Waveform Phenomenon Primary issues indicating measurements power quality Inrush current is a Inrush current can Events are detected large current that flows cause power switch using inrush current.
-
Page 235: Appendix 3 Event Detection Methods
Appendix 3 Event Detection Methods Appendix 3 Event Detection Methods Transient overvoltage Measurement method: • Detected when the waveform obtained by eliminating the fundamental component (50/60/400 Hz) from a waveform sampled at 2 MHz exceeds a threshold specified as an absolute value. •... - Page 236 Appendix 3 Event Detection Methods Voltage Swells, Voltage Dips, and Interruptions Measurement method: • When the measurement frequency is set to 50/60 Hz, events are detected using the RMS voltage refreshed each half-cycle based on sample data for 1 waveform derived by overlapping the voltage waveform every half-cycle.
- Page 237 Appendix 3 Event Detection Methods Frequency cycle Measurement method: • Frequency for every U1 (reference channel) waveform, calculated using the reciprocal method. • When the measurement frequency is set to 400 Hz, the frequency cycle is calculated as the reciprocal of the accumu- lated whole-cycle time during 8 cycles.
- Page 238 Appendix 3 Event Detection Methods Voltage DC Value, Current DC Value (CH4 only) Measurement method: Values are detected when the average value for the approx. 200 ms aggregation synchronized to the reference channel U1 exceeds a threshold specified as an absolute value. Event IN and OUT: Event IN : Start of the approx.
- Page 239 Appendix 3 Event Detection Methods Voltage Waveform Comparison Measurement method: • A judgment area is automatically generated from the previous 200 ms aggregation waveform, and events are gener- ated based on a comparison with the judgment waveform. • Waveform comparison is performed at once for the entire 200 ms aggregation. Thresholds are applied as a percent- age of the nominal input voltage RMS value.
- Page 240 Appendix 3 Event Detection Methods Inrush current Measurement method: • Events are detected when the RMS current refreshed each half-cycle Irms1/2 is greater than the threshold. • For 400 Hz measurement, events are detected when the maximum of 4 RMS current values existing within the same 10 ms period (calculated values for one 400 Hz waveform) is greater than the threshold in the positive direction.
- Page 241 Appendix 3 Event Detection Methods High-order Harmonic Voltage Component and High-order Harmonic Current Component Measurement method: • The waveform obtained by eliminating the fundamental component is calculated using the true RMS method during 10 cycles (50 Hz), 12 cycles (60 Hz), or 80 cycles (400 Hz) of the fundamental wave. Events are detected when this RMS value is greater than the threshold.
-
Page 242: Appendix 4 Recording Timeplot Data And Event Waveforms
Appendix 4 Recording TIMEPLOT Data and Event Waveforms Appendix 4 Recording TIMEPLOT Data and Event Waveforms TIME PLOT screen (trends and harmonic trends) [RECORD] SYSTEM_DF1 TIME PLOT Interval (setting period) Approx. 200 ms aggregation (50 Hz: 10 cycles, 60 Hz: 12 cycles) RMS value 1 RMS value 2 RMS value 3... - Page 243 Appendix 4 Recording TIMEPLOT Data and Event Waveforms Event Waveform Recording Method Generating events using approx. 200 ms aggregation measured values [RECORD] SYSTEM_DF1 TIME PLOT Interval (setting period) Approx. 200 ms aggregation (50 Hz: 10 cycles, 60 Hz: 12 cycles) RMS calculation EVENT occur RMS calculation...
- Page 244 150/180 cycle time intervals and between approx. 200 ms aggregations (10 or 12 cycles). The PW3198 synchronizes the start of the set TIMEPLOT interval every 10 minutes. For this reason, approx. 200 ms aggregations (10 or 12 cycles) are also resynchronized every 10 minutes.
-
Page 245: Channel 4
±20 ms for 50 Hz and ±16.7 ms for 60 Hz. By synchronizing the PW3198 with the PW9005 GPS Box, the instrument time can be synchronized to UTC at a high degree of accuracy. In the event that accurate time synchronization using an external sig- nal, such as that provided by the GPS unit, is not possible, the instrument incorporates a clock capable of operating at a real-time accuracy of within ±1 second per day (within the specified operating temperature... -
Page 246: Appendix 5 Detailed Explanation Of Iec Flicker And V10 Flicker
Appendix 5 Detailed Explanation of IEC Flicker and DV10 Flicker Appendix 5 Detailed Explanation of IEC Flicker and V10 Flicker To measure the IEC Flicker or V10 Flicker Flicker calculation and IEC flicker filter settings are configured on the SYSTEM- [MAIN]-F1 [MEASURE] screen. - Page 247 Appendix 5 Detailed Explanation of IEC Flicker and DV10 Flicker Weighting Filter You can select a weighted filter for either a 230 V lamp system or a 120 V lamp system. Statistical Statistics on flicker are compiled by applying the cumulative probability function (CPF) to 1,024 logarithmic divisions of instantaneous flicker values S(t) in the Processing range from 0.0001 to 10000 P.U.
- Page 248 Appendix 5 Detailed Explanation of IEC Flicker and DV10 Flicker V10 Flicker Meter V10 flicker The V10 flicker function is calculated using the "perceived flicker curve" calcu- lation method, which is based on digital Fourier transformation. Calculation: V10 = ...
-
Page 249: Appendix 6 Making Effective Use Of Channel 4
Appendix 6 Making Effective Use of Channel 4 Appendix 6 Making Effective Use of Channel 4 While channel 4 is often used to measure the neutral line of 3-phase 4-wire connections, there are a vari- ety of other uses since it is isolated from the instrument's other channels. DC power supply measurement This is an extremely broad range of applications that extends from monitoring DC power supply systems to monitoring hardware internal power supplies. - Page 250 Appendix 6 Making Effective Use of Channel 4 Two-system, two-circuit measurement Although it is necessary to measure a system synchronized to the reference channel in order to obtain accurate measurements, channel 4 can be used to measure a different system than channels 1 through 3 (other than power elements).
- Page 251 Appendix 6 Making Effective Use of Channel 4 Example of 2-system measurement 2...
-
Page 252: Appendix 7 Terminology
The graph format makes it easy to quickly identify which event data distribution should be analyzed. The 9624-50 PQA HiView Pro application can be used to create ITIC curves using PW3198 data. Shows the power loss caused by the harmonic current in transformers. - Page 253 PW3198. By inputting an operating signal from an external device, an operation start or stop trigger can be applied in order to record waveforms with the PW3198. The official time used worldwide. Although UTC is almost identical to Greenwich Mean...
- Page 254 The noise component at and above several kHz. For the PW3198, the term refers to RMS val- ues for the noise component at 2 kHz and above. By measuring the high-order harmonic com-...
- Page 255 Appendix 7 Terminology The ratio of the K-order size to the size of the fundamental wave, expressed as a percent- age using the following equation: K-order wave / fundamental wave × 100 [%] Harmonic content percentage By observing this value, it is possible to ascertain the harmonic component content for indi- vidual orders.
- Page 256 The ratio of the size of the total harmonic component to the size of the fundamental wave, expressed as a percentage using the following equation: (for the PW3198, calculated to the 50th order) This value can be monitored to assess waveform distortion for each item, providing a yard-...
- Page 257 Appendix 7 Terminology Unbalanced (symmetrical) 3-phase voltage (current) Three-phase AC voltage (current) with equal voltage and current magnitude for each phase and 120 phase separation. Unbalanced (asymmetrical) 3-phase voltage (current) Three-phase AC voltage (current) with equal voltage and current magnitude for each °...
- Page 258 Use this function when you wish to observe a wave- form at the instant an event occurs as well as subsequent changes in the instantaneous waveform. For the PW3198, a waveform of up to 1 s in duration will be recorded.
-
Page 259: Index
Index Index Index Numbers Event list notation ..........122 Event waveform ..........189 10-sec frequency ..........A27 External event ..........A25 External Out ............65 Battery pack ............30 Beep ..............64 Factory settings ..........74 Before connecting measurement cables ....8 File types ............ - Page 260 Index Index Key lock .............. 16 Reverting the instrument to its factory settings .. 73 RS-232C ............. 65 ..............65 LAN cable ..........160, 161 SAVE ..............145 LAN interface ........... 157 Save operation ..........139 Language ............64 SD memory card ..........
- Page 261 Index Index Warm-up ............36, 37 When the memory is full ........63 WIRING Settings ............55 Zero adjustment ..........37 Zero phase ............A27...
- Page 262 Index Index...
Need help?
Do you have a question about the PW3198 and is the answer not in the manual?
Questions and answers