Table of Contents
Advertisement
Quick Links
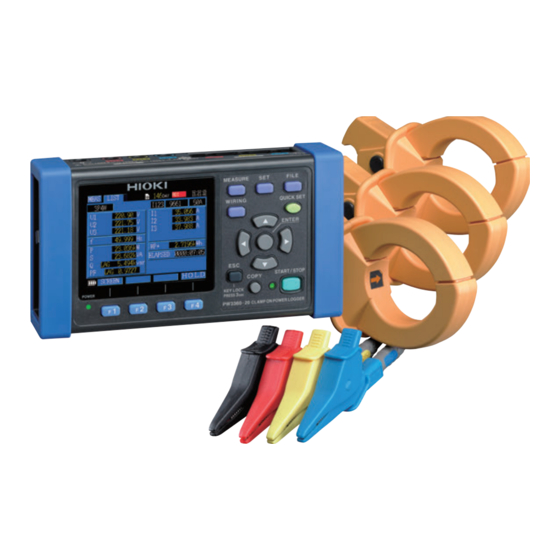
PW3360-20
PW3360-21
CLAMP ON POWER LOGGER
Be sure to read this manual before using the instrument.
When using the instrument for the
first time
Names and Functions of Parts p.14
Measurement Preparations
Feb. 2020 Revised edition 7
PW3360A981-07 20-02H
Troubleshooting
Maintenance and Service
p.21
Error Indication
Visit us at www.TestEquipmentDepot.com
Instruction Manual
p.4
p.213
p.217
5 Commonwealth Ave
Woburn, MA 01801
Phone 781-665-1400
Toll Free 1-800-517-8431
Advertisement
Table of Contents

Related Manuals for Hioki PW3360-21


Summary of Contents for Hioki PW3360-21
- Page 1 PW3360-20 PW3360-21 Instruction Manual CLAMP ON POWER LOGGER p.4 Be sure to read this manual before using the instrument. When using the instrument for the Troubleshooting first time Names and Functions of Parts p.14 p.213 Maintenance and Service ...
-
Page 3: Table Of Contents
Contents Contents Introduction ................1 Confirming Package Contents ..........2 Safety Information..............4 Operating Precautions.............7 Measurement Flowchart ............9 Chapter 1 Overview __________________________________ 11 Product Overview ............11 Features ..............12 Names and Functions of Parts .......14 Screen Configuration ..........17 On-Screen Indicators ..........19 Chapter 2 Measurement Preparations___________________ 21 Preparation Flowchart ..........21 Preparing to Use the Instrument after ... - Page 4 Contents Chapter 3 Connecting to Lines to be Measured ___________ 43 Connection Procedure ........... 44 Setting Measurement Conditions on the Wiring Diagram Screen ........45 Connecting the Voltage Cords ......49 Connecting the Clamp Sensors ......51 Connecting the Voltage Cords to Lines to be Measured ..............
- Page 5 Viewing Energy (Active Energy and Reactive Energy) ....91 Viewing a Demand Graph ........92 Viewing a Harmonic Graph (PW3360-21 only) ..93 Viewing a Harmonic List (PW3360-21 only) ..95 5.10 Viewing Waveforms ..........96 Changing the Zoom Factor for the Vertical Axis Used to ...
- Page 6 Contents Chapter 7 Quick Set_________________________________ 109 Settings Configured with the Quick Set ..... 109 Settings That Can Be Added to Quick Set Settings ..........110 Chapter 8 Saving Data and Manipulating Files __________ 113 Viewing and Using the File Screen ..... 114 Folder and File Structure ........
- Page 7 Contents Using the PW3360/PW3365 A ® uto Excel Graph Creation Application ....149 Chapter 10 Using Communications (LAN) _______________ 151 10.1 LAN Communications ...........151 Configure the Instrument's LAN Settings .......152 Connecting the Instrument and Computer with a LAN Cable ..............154 10.2 Remote Control of the Instrument by ...
- Page 8 Contents When the 9694 or 9695-02 is used (CAT III, 300 V) ..211 When the CT9667 is Used ..........211 12.7 Model PW9003 Voltage Line Power Adapter ..212 Chapter 13 Maintenance and Service ___________________ 213 13.1 Trouble Shooting ..........213 ...
-
Page 9: Introduction
Introduction Introduction Thank you for purchasing the HIOKI Model PW3360 Clamp on Power Logger.To obtain maximum performance from the instru- ment, please read this manual first, and keep it handy for future ref- erence. Trademarks • Microsoft, Windows, Excel, and Internet Explorer are either reg- istered trademarks or trademarks of Microsoft Corporation in the United States and other countries. -
Page 10: Confirming Package Contents
In particular, check the accessories, panel keys, and connectors. If damage is evident, or if it fails to operate according to the specifica- tions, contact your authorized Hioki distributor or reseller. • Use the original packing materials when transporting the instrument, if possible. - Page 11 Confirming Package Contents Options The following options are available for the instrument. Contact your authorized Hioki distributor or reseller when ordering. The options are subject to change. Visit our website for updated information. For current measurement Model 9660 Clamp on Sensor (100 Arms rated) ...
-
Page 12: Safety Information
Safety Information Safety Information This instrument is designed to comply with IEC 61010 Safety Standards, and has been thoroughly tested for safety prior to shipment. However, mishandling during use could result in injury or death, as well as damage to the instrument. Using the instrument in a way not described in this manual may negate the provided safety features. - Page 13 Safety Information Notation The following symbols in this manual indicate the relative importance of cautions and warnings. Indicates that incorrect operation presents an extreme hazard that could result in serious injury or death to the user. Indicates that incorrect operation presents a significant hazard that could result in serious injury or death to the user.
- Page 14 Safety Information Accuracy We define measurement tolerances in terms of f.s. (full scale), rdg. (reading) and dgt. (digit) values, with the following meanings: f.s. (maximum display value or scale length) The maximum displayable value or scale length. This is usually the name of the currently selected range.
-
Page 15: Operating Precautions
Before using the instrument for the first time, verify that it operates normally to ensure that no damage occurred during storage or shipping. If you find any damage, contact your authorized Hioki distributor or reseller. Before using the instrument, verify that damage to any of the voltage cords’... - Page 16 Operating Precautions Handling the Instrument • To avoid damage to the instrument, protect it from physical shock when transporting and handling. Be especially careful to avoid physical shock from dropping. • This instrument may cause interference if used in residential areas.
-
Page 17: Measurement Flowchart
Measurement Flowchart Measurement Flowchart This section presents a series of instrument operations without using the Quick Set function. For more information about the Quick Set function, see the Measurement Guide (published separately in color). Measurement preparations (At purchase) • Secure the voltage cords together with a spiral tube. (p. 22) •... - Page 18 Measurement Flowchart Recording settings (p. 71) Save destination Folder/ File name Clock Change the settings of measure- Save interval Recording start ment (calculation selection, ener- gy cost), system, and interface when required. Save items Recording stop Viewing measurement data (p. 85) [MEAS, LIST] screen Starting recording (p.
-
Page 19: Chapter 1 Overview
In addition to basic measurements including voltage, current, power, power factor, and energy, the instrument can perform demand measurement and harmonic mea- surement (PW3360-21 harmonic model only), which are important parameters in power management. The Quick Set makes the instrument simple enough to be used even by beginners by enabling them to configure basic settings, wirings, recording settings, and the start of recording through a series of steps. -
Page 20: Features
1.2 Features 1.2 Features Quick Set function The Quick Set function simplifies instrument operation by walking users through a series of steps to configure basic settings, wirings, wiring check (wiring confirmation), recording settings, and the start of recording in order to prevent mistakes. - Page 21 1.2 Features Safe design Despite its compact footprint, the instrument features a safe design that is CAT IV (300V) and CAT III (600 V) compliant. Extensive line of clamp sensors Choose the clamp sensor that’s right for your application, with models designed for targets ranging from leakage currents to a maximum ranting of 5,000 A.
-
Page 22: Names And Functions Of Parts
1.3 Names and Functions of Parts 1.3 Names and Functions of Parts Front Display 3.5" TFT color LCD (p. 17) POWER LED Lights up when the POWER switch is turned on and power is supplied to the instru- ment. (p. 41) Flashes if the backlight Recording LED has been turned off... - Page 23 1.3 Names and Functions of Parts Right SD memory card slot Insert an SD memory card here. USB interface Be sure to close the cover when Connect a computer here using recording. the included USB cable. See: (p. 31) See: (p.
- Page 24 1.3 Names and Functions of Parts Upper Voltage input terminals Current input terminals Connect the included L9438-53 Connect optional clamp sensors here. Voltage Cord here. See: (p. 54) See: (p. 53) Serial number Back Displays the instrument's serial num- ber.The serial number consists of 9 MAC address label digits.
-
Page 25: Screen Configuration
Bottom screen: Measurement screen’s list screen (shown as [MEAS, LIST] in this manual) VOLT/CURR(U/I) LIST POWER INTEGRATE DEMAND HARMONIC GRAPH (PW3360-21 only) HARMONIC LIST (PW3360-21 only) See: Chapter 5, "Viewing Measurement Data" (p. 85) WAVEFORM ZOOM TREND Setting screen There are a total of eight Setting screens. ... - Page 26 1.4 Screen Configuration Pressing each of the following keys switches the screens. Pressing the key returns the screen to the previous screen. File Screen Memory SD card See: Chapter 8, "Saving Data and Manipulating Files" (p. 113) Wiring Screen Wiring Check Wiring Diagram See:...
-
Page 27: On-Screen Indicators
1.5 On-Screen Indicators On-Screen Indicators Marks Description Lights up when the save destination is [SD CARD] and an SD memory card is loaded in the instrument. Lights red when the SD memory card is being accessed. Lights up when the save destination is the instrument’s internal memory. - Page 28 1.5 On-Screen Indicators Marks Description Indicates that the display range upper limit has been exceeded, causing an over-range event. (p. 179) If the voltage is over-range, the voltage that the instrument is capa- ble of measuring is being exceeded. Immediately disconnect the instrument.
-
Page 29: Measurement Preparations
2.1 Preparation Flowchart Measurement Chapter 2 Preparations Before starting measurement, connect accessories and options to the instrument. Before performing measurement, be sure to inspect the instrument as well as any accessories and options for possible malfunctions. 2.1 Preparation Flowchart Follow the procedure described below to prepare for measurement. -
Page 30: Preparing To Use The Instrument After Purchase
2.2 Preparing to Use the Instrument after Purchase 2.2 Preparing to Use the Instrument after Purchase Bundle the Voltage Cord Leads with the Spiral Tubes 5 Spiral Tubes provided with Model L9438-53 Voltage Cord. Use the Spiral Tubes as and when required. -
Page 31: Attaching Color Clips Around Clamp Sensors And Grouping Together Cables
2.2 Preparing to Use the Instrument after Purchase Attaching Color clips around Clamp Sensors and Grouping Together Cables The instrument includes color clips for use with clamp sensors. In order to prevent erroneous connections, these color clips are attached clamp sensor cables and color-coded to help recognize channels. - Page 32 2.2 Preparing to Use the Instrument after Purchase Preparation items: single-phase/3-wire (1P3W) and 3-phase/3-wire (3P3W2M) Model 9661 Black Red x 2 Yellow x 2 Colored clips Five spiral tubes (For Two clamp sensors in use (for color-coding the current grouping together cords) sensor) Attachd color clips of the same color around the...
-
Page 33: Installing (Replacing) The Battery Pack
See: "Instrument Installation" (p. 7) • For battery operation, use only the Hioki Model PW9002 Battery Set. We do not take any responsibility for accidents or damage related to the use of any other batteries and/or screws. - Page 34 Fit the 9459 Battery Pack into the battery case. Position the battery pack so that the cables are routed through the cutout in the case. Cutout When the PW9002 Battery Set is shipped from Hioki factory, the 9459 Battery Pack has already fit into the battery case.
- Page 35 2.2 Preparing to Use the Instrument after Purchase Insert the connector from the battery pack into the port on the instrument. Take care to orient the connector properly and in- sert it as far as it will go. With the battery case facing down, fit it into the recessed area on the instrument.
-
Page 36: Storing The Instrument In The C1005 Carrying Case (Option)
2.2 Preparing to Use the Instrument after Purchase Storing the Instrument in the C1005 Carrying Case (Option) The instrument can be stored in the C1005 Carrying Case as follows: This divider is attached by means of Velcro-style fasteners and can be removed. It can be arranged as desired to accommodate the case’s contents. -
Page 37: Setting The Language And Measurement Line Frequency (50 Hz/60 Hz)
2.2 Preparing to Use the Instrument after Purchase Setting the Language and Measurement Line Frequency (50 Hz/60 Hz) When you turn on the instrument for the first time after purchase, the Language Set- ting screen and Frequency Setting screen will be displayed. Configure the settings as desired. -
Page 38: Pre-Operation Inspection
Before using the instrument the first time, verify that it operates normally to ensure that the no damage occurred during storage or shipping. If you find any damage, contact your authorized Hioki distributor or reseller. Metal Exposed Inspect the voltage cords Is the insulation of the voltage cord to be ... -
Page 39: Inserting (Removing) An Sd Memory Card
Important • Use only HIOKI-approved SD memory cards. Other SD memory cards may not work with the instrument, and Hioki is unable to guarantee proper operation. • Format SD memory cards with the instrument. Using a com- puter to format the card may reduce the card’s performance. - Page 40 2.4 Inserting (Removing) an SD Memory Card • The operating lifetime of the SD memory card is limited by its flash memory. After long-term or frequent usage, data reading and writing capabilities will be degraded. In that case, replace the card with a new one. •...
- Page 41 2.4 Inserting (Removing) an SD Memory Card Inserting the SD memory card Turn off the power switch. Open the SD memory card slot cover. Disengage the SD memory card’s write- protect lock. LOCK key Positioning the SD memory card with the top surface facing up, insert it into the slot in the direction shown by the arrow and push it all the way in.
-
Page 42: Supplying The Power
2.5 Supplying the Power 2.5 Supplying the Power Connecting the AC Adapter Use only the specified Model Z1006 AC Adapter. AC adapter input voltage range is 100 to 240 VAC (with ±10% stability) at 50/60 Hz. To avoid electrical hazards and damage to the instrument, do not apply voltage outside of this range. - Page 43 2.5 Supplying the Power Connect the Z1006 AC Adapter to the instrument and plug it into an outlet as follows: Power OFF Turn off the power switch. Connect the power cord to the inlet on the AC adapter. Connect the AC adapter’s output plug to the instrument.
-
Page 44: Supplying Power From Measurement Lines (Using The Pw9003 Voltage Line Power Adapter)
• The fuse is housed in the PW9003 Voltage Line Power Adapter. If the power does not turn on, the fuse may be blown. If this occurs, a replacement or repair cannot be performed by custom- ers. Please contact your authorized Hioki distributor or reseller. - Page 45 2.5 Supplying the Power Preparation items Model Z1006 AC Adapter Model PW9003 Voltage Line Power Adapter Model L9438-53 Voltage Cord Connecting the PW9003 Be sure to connect the instrument to the measurement target as described in the fol- lowing procedure. Failing to follow this procedure properly is extremely dangerous. To disconnect the instrument, simply reverse the procedure.
- Page 46 2.5 Supplying the Power Connect the AC adapter’s output plug to the instrument. Once the output plug is connected, route the cord underneath the hook (to keep it from being pulled out). Connect the voltage line power adapter’s banana plugs to the instru- ment’s voltage input terminals.
- Page 47 2.5 Supplying the Power Wiring Check 1P2W/ 1P3W1U Power OFF Power ON PW9003 Power OFF Z1006 Power ON L9438-53 1P3W/ 3P3W2M Power OFF Power ON 3P3W2M 1P3W PW9003 Z1006 L9438-53 Power OFF Power ON...
- Page 48 2.5 Supplying the Power 3P4W Power OFF Power ON PW9003 Z1006 L9438-53 Power OFF Power ON 3P3W3M Power OFF Power ON PW9003 Z1006 L9438-53 Power OFF Power On...
-
Page 49: Turning The Power On/Off
AC adapter and present an electrical hazard. If the instrument encounters an error during the self-test, the instrument is damaged. Contact your authorized Hioki distributor or reseller. Powering On Turn on the power switch. When the instrument is turned on, the Self-test screen will be displayed. - Page 50 • If the instrument fails to turn on when using the AC adapter, there may be a break in the power cord or an AC adapter or internal instrument malfunction. Contact your authorized Hioki distributor or reseller. • If an error message is displayed before the self-test completes, there may be an internal instrument malfunction.
-
Page 51: Connecting To Lines To Be Measured
Connecting to Lines Chapter 3 to be Measured Please read the "Operating Precautions" (p. 7) before making connections. • Voltage cords or Clamp sensors should only be connected to the secondary side of a breaker, so the breaker can pre- vent an accident if a short circuit occurs. -
Page 52: Connection Procedure
3.1 Connection Procedure 3.1 Connection Procedure Connect the instrument as follows: Set the measurement conditions. (p. 45) Wiring diagram screen Attach the voltage cords.(p. 49) Attach the clamp sensors.(p. 51) Make connections. Make connections. (p. 53) (p. 54) Set the current range. (p. 57) Check the wirings. -
Page 53: Setting Measurement Conditions On The Wiring Diagram Screen
3.2 Setting Measurement Conditions on the Wiring Diagram Screen 3.2 Setting Measurement Conditions on the Wiring Diagram Screen Use the following procedure to display the [WIR, DIAG] screen and set the wiring method and clamp sensor being used. The wiring method, clamp sensor, and current range settings can be configured on the Measurement screen, Settings screen, or Wirings screen. - Page 54 3.2 Setting Measurement Conditions on the Wiring Diagram Screen Selecting the wiring method wiring Sub- Name Detailed description selection selection 1P2W Single-phase/ If the single-phase/2-wire lines share the same voltage, you can select from 1 to 3 circuits with 2-wire lines the sub-selection.
- Page 55 3.2 Setting Measurement Conditions on the Wiring Diagram Screen Select the current channel. To measure multiple circuits with the wiring, select the corresponding chan- nel and then set the clamp sensor and current range. 1P2Wx2 I1, I2 1P2Wx3 I1, I2, I3 1P3W+I I12, I3 1P3W1U+I...
- Page 56 3.2 Setting Measurement Conditions on the Wiring Diagram Screen Select the current range. If you do not know the appropriate range, configure the current range set- ting while checking the current value on [WIR, CHK] screen after connect- ing the instrument. See: 3.8, "Setting the Current Range"...
-
Page 57: Connecting The Voltage Cords
3.3 Connecting the Voltage Cords 3.3 Connecting the Voltage Cords • To avoid electric shock and short-circuit accidents, use only the specified L9438-53 Voltage Cord to connect the instrument volt- age input terminals to the circuit to be tested. • To ensure voltage cord integrity, grip cords by the plug when connecting or disconnecting them. - Page 58 3.3 Connecting the Voltage Cords The voltage cords connection Attach the alligator clip or magnet Alligator clip adapter to the end of the voltage cord. Magnet adapter Insert the voltage cords into the voltage input terminals while checking the [WIR, DIAG] screen.
-
Page 59: Connecting The Clamp Sensors
3.4 Connecting the Clamp Sensors 3.4 Connecting the Clamp Sensors When disconnecting the BNC connector, be sure to release the lock before pulling off the connector. Forcibly pulling the connector without releasing the lock, or pulling on the cable, can damage the connector. - Page 60 3.4 Connecting the Clamp Sensors Connect the clamp sensors’ BNC PW3360 current BNC connector of connectors to the current input ter- input terminal the clamp sensor minals while checking the [WIR, Connector, DIAG] screen. aligning Align the groove on the BNC connector with the connector guide on the instru- ment and push it into place.
-
Page 61: Connecting The Voltage Cords To Lines To Be Measured
3.5 Connecting the Voltage Cords to Lines to be Measured 3.5 Connecting the Voltage Cords to Lines to be Measured Connect the voltage cords to the lines to be measured while checking the [WIR, DIAG] screen. Example: When using the alligator clips Secondary side of breaker Securely clip the cords to the metallic part of the screw or wiring bar on the secondary side of the cir-... -
Page 62: Connecting Clamp Sensors To Lines To Be Measured
3.6 Connecting Clamp Sensors to Lines to be Measured 3.6 Connecting Clamp Sensors to Lines to be Measured Connect the clamp sensors to the lines to be measured while checking the [WIR, DIAG] screen. Note that the clamp sensor may be damaged if the applied current exceeds the maximum input current. -
Page 63: Leakage Current Measurement
3.6 Connecting Clamp Sensors to Lines to be Measured Leakage Current Measurement single-phase/2-wire: Place the clamp around two wires. single-phase/3-wire: Place the clamp around three wires. 3-phase/3-wire: Place the clamp around three wires. 3-phase/4-wire: Place the clamp around four wires. Grounding wire: Place the clamp around one wire. -
Page 64: Attaching Cords On A Wall (If Required)
3.7 Attaching Cords on a Wall (if required) 3.7 Attaching Cords on a Wall (if required) Be sure to read "Using Magnetic Strap" (p. 8) Using Model Z5004 Magnetic Strap allows you to attach voltage cords and cords of current sensors to a wall or panel (steel). -
Page 65: Setting The Current Range
3.8 Setting the Current Range 3.8 Setting the Current Range Check the current value on the [WIR, CHK] screen and set an appropriate current range as follows: Press the key to display the [WIR, CHK] screen. Press [CIRCUIT] to switch circuits When measuring multiple single-phase/ 2-wire (1P2W) circuits or when “current only”... - Page 66 3.8 Setting the Current Range Check the current value and set the current range. When measuring multiple single-phase/ 2-wire (1P2W) circuits or when “current only” is selected, you can select other channels in the same way and set the range. Selecting an appropriate range Select an appropriate range based in- formation such as the load rating, oper-...
-
Page 67: Verifying Correct Wiring (Wiring Check)
3.9 Verifying Correct Wiring (Wiring Check) 3.9 Verifying Correct Wiring (Wiring Check) Check whether the instrument has been connected properly on the [WIR, CHK] screen. Press the key to display the screen. A green (PASS) wiring confirmation re- sult indicates that there is no problem with the wirings. - Page 68 3.9 Verifying Correct Wiring (Wiring Check) If the wiring confirmation result is red (FAIL) or yellow (CHECK) Press [CHK ITEM] so that you can move the cursor to the wiring check items. Move the cursor to the item that has been tagged as red (FAIL) or yellow (CHECK) and press the [ENTER] key....
- Page 69 3.9 Verifying Correct Wiring (Wiring Check) If the wiring confirmation result is [CHECK] [FAIL] wiring confir- Judgment conditions Confirmation steps mation item FAIL will display when volt- • Are the voltage test leads completely inserted into the voltage input terminals? age value is less than 50V.
- Page 70 3.9 Verifying Correct Wiring (Wiring Check) wiring confir- Judgment conditions Confirmation steps mation item • Are the clamp-on sensors clamped cor- FAIL will display when the rectly? current phase sequence is • Does the arrow of the clamp-on sensor Current incorrect.
-
Page 71: Chapter 4 Changing Settings
Changing Chapter 4 Settings You can change any setting item on the setting screen. See: 10.1, "LAN Communications" (p. 151) See: 11.2, "Configuring Pulse Settings" (p. 169) -
Page 72: Viewing And Using The Settings Screen
4.1 Viewing and Using the Settings Screen 4.1 Viewing and Using the Settings Screen Allows you to switch to the Settings screen and change the Setting screen. Allows you to review settings details (help function). Saves settings data. See: 8.4, "Saving Settings Files" (p. 123) Allows you to select a Settings screen. -
Page 73: Changing Measurement Settings
4.2 Changing Measurement Settings 4.2 Changing Measurement Settings You can change measurement conditions on the [SET 1/8, MEAS 1] [SET 2/8, MEAS 2] Settings screens. Measurement 1 Setting Screen Wiring Selects the measurement line wiring method. See: "Selecting the wiring method" (p. 46) Frequency Selects the frequency. - Page 74 4.2 Changing Measurement Settings • When a factory reset (p. 83) is performed to reset the instrument to its default settings, no measurement line frequency will have been set. When you turn on the instrument, first set the fre- quency to the measurement line frequency. See: "Setting the Language and Measurement Line Frequency (50 Hz/60 Hz)"...
-
Page 75: Measurement 2 Setting Screen
4.2 Changing Measurement Settings Measurement 2 Setting Screen Voltage range The voltage range is fixed to 600 V. VT ratio (PT ratio) Set when using a VT (PT) to perform measurement. Selection Manual 0.01 to 9999.99 Select 1/60/100/200/300/600/700/1000/2000/2500/5000 • When taking measurements on the secondary side of a voltage transformer (VT), you can set the VT ratio in order to convert the readings to their primary-side equivalents and display the results. - Page 76 4.2 Changing Measurement Settings PF/Q/S calculation Select the method for calculating power factor (PF), reactive power (Q), and appar- ent power (S). See: 12.5, "Calculation Formulas" (p. 200) RMS calculation is generally used in applications such as checking transformer capacity, but fundamental wave calculation is used when measuring power factor and reactive power, which are related to electricity fees.
- Page 77 4.2 Changing Measurement Settings Energy cost You can display electricity charges by setting the unit cost (per kWh) and having the instrument multiply the electricity charge unit cost by the active energy (consump- tion) WP+ value. Selection Unit Cost 0.00000 to 99999.9/kWh Set to any three alphanumeric characters.
- Page 78 Once you have entered the currency, accept it with the [OK] key. [Cancel] Pressing will cancel the entered currency. THD calculation (PW3360-21 only) Selects the method used to calculate total harmonic distortion (THD). The THD-F method is typically used. Selection THD-F Calculates by dividing the harmonic component (total of (Fundamental) 2nd to 40th order) by the fundamental wave.
-
Page 79: Changing Recording (Save) Settings
4.3 Changing Recording (Save) Settings 4.3 Changing Recording (Save) Settings You can change the conditions used to record (save) measurement data on the [SET 3/8, REC 1] [SET 4/8, REC 2] Settings screens. Recording 1 Setting Screen Data storage time Since the instrument can perform recording and measurement for a... - Page 80 Energy- and demand-related measurement data is saved regardless of this setting. With the PW3360-21 (which includes harmonic measurement functionality), you can also set whether to save harmonic data. Harmonic data cannot be saved in the instru- ment’s internal memory.
- Page 81 4.3 Changing Recording (Save) Settings • Ordinarily, select “Average only.” When you wish to save data such as the following, select “All (average, maximum, and mini- mum values)”: Maximum: To check maximum values for current, power, etc. Minimum: To check minimum values for voltage, power factor, etc.
- Page 82 4.3 Changing Recording (Save) Settings Waveform save Sets whether to save waveform data for each time interval as a binary-format file. The minimum time interval is 1 minute. When the parameter is set to less than 1 minute, waveforms are saved every minute. Waveforms are not saved in the instru- ment’s internal memory.
- Page 83 4.3 Changing Recording (Save) Settings Procedure Move the cursor to [FOLDER/FILE NAME]. Press the [ENTER] key and select [MANUAL/AUTO]. If you selected [MANUAL]: A dialog box for inputting the folder and file name will be displayed. Select one character at a time with the cursor keys and then accept the entered name with the [ENTER]...
-
Page 84: Recording 2 Setting Screen
4.3 Changing Recording (Save) Settings Recording 2 Setting Screen Recording start method Sets the method used to start recording. Selection MANUAL Starts recording from the point at which the key is pressed. Recording is started at the set time (YY/MM/DD hh:mm). TIME If the set time has already passed, the “interval time”... - Page 85 4.3 Changing Recording (Save) Settings Specifying a time Move the cursor to the recording start method, press the [ENTER] key, and select [TIME]. Move the cursor to the time set- ting you wish to change and press the [ENTER] key. The cursor will change to the size of one digit, and you will be able to change the setting.
- Page 86 4.3 Changing Recording (Save) Settings Selection Recording is repeated while segmenting files every day. Recording is stopped when the recording time period on REPEAT the repeat stop date ends. The stop method cannot be changed during repeat recording. The maximum recording and measurement time is up to one year. Recording will stop automatically in one year.
-
Page 87: Changing System Settings (As Necessary)
4.4 Changing System Settings (as Necessary) 4.4 Changing System Settings (as Necessary) You can change system settings on the [SET 5/8, SYS 1] [SET 6/8, SYS 2] Set- tings screens. System 1 Setting Screen Clock Sets the date and time (using the Western calendar and 24-hour time). See: "Specifying a time"... - Page 88 4.4 Changing System Settings (as Necessary) Phase name Selects the phase names for the measurement lines displayed on the [WIR, DIAG] screen. Selection R S T, A B C, L1 L2 L3, U V W Screen color Selects the screen color. Selection COLOR 1 to 3 Language...
-
Page 89: System 2 Setting Screen
4.4 Changing System Settings (as Necessary) System 2 Setting Screen Start Quick Set at power-on Selects whether to display the Quick Set start dialog box when the instrument is turned on. Selection Display the Measurement screen instead of displaying the Quick Set start dialog box when the instrument is turned on. -
Page 90: Initializing The Instrument (System Reset)
4.5 Initializing the Instrument (System Reset) 4.5 Initializing the Instrument (System Reset) If the instrument seems to be malfunctioning, consult "Before Having the Instrument Repaired" (p. 215). If the cause of the problem remains unclear, try a system reset. Enter Select Performing a system reset causes all settings other than the frequency setting,... -
Page 91: Reverting The Instrument To Its Factory Settings (Factory Reset)
4.5 Initializing the Instrument (System Reset) Reverting the Instrument to Its Factory Settings (Factory Reset) You can revert all settings, including frequency, language, and communications set- tings, to their default values by turning on the instrument when you perform a factory reset. -
Page 92: Factory Settings
THD-F (Distortion component/Fundamental wave) (PW3360-21 only) Save Destination SD card Save Interval 5 minutes PW3360-20: AVG only REC 1 Save Items PW3360-21: AVG only (no hamonics) Screen Save Folder/ File Name Auto Recording start method Interval REC 2 Recording stop method Manual Clock Set at time of shipment. -
Page 93: Viewing Measurement Data
5.1 Viewing and Using the Measurement Screen Viewing Measurement Chapter 5 Data The PW3360 allows you to view measured values, waveforms, and graphs on the Measurement screen. Viewing and Using the Measurement Screen Switches to the Measurement screen and changes the Mea- Clamp sensor Current range Current channel... -
Page 94: 1P2W X 2 Or 1P2W X 3 Wiring
5.1 Viewing and Using the Measurement Screen 1P2W x 2 or 1P2W x 3 Wiring For 1P2W x 2 or x 3 wirings, select the circuit. Selects the circuit. Changes the circuit. For 1P2W x 2 or 1P2W x 3 wirings, you must change the circuit since the [MEAS, LIST] [MEAS, POWER]... -
Page 95: List Of Measurement Screens
5.2 List of Measurement Screens List of Measurement Screens Screen Displayed data Reference name Voltage RMS (U), current RMS (I), frequency (f), active power (P), reactive power (Q), apparent power (S), power factor (PF) or dis- placement power factor (DPF), active energy (consumption) WP+, List "5.3"... -
Page 96: Viewing Data
5.3 Viewing Data (Voltage, Current, Power, and Energy) as a List Viewing Data (Voltage, Current, Power, and Energy) as a List Press the [SCREEN] key to display the [MEAS, LIST] screen. Voltage RMS Current RMS Frequency Active energy Active power (consumption) Apparent power... -
Page 97: Viewing Voltage And Current Value Details
5.4 Viewing Voltage and Current Value Details Viewing Voltage and Current Value Details (RMS Values, Fundamental Wave Values, Peak Values, and Phase Angles) Press the [SCREEN] key to display the [MEAS, U/I] (VOLT/CURR) screen. RMS values Fundamental Peak values Phase angles wave values Voltage Current... -
Page 98: Viewing Power Details (Channel Power Values)
5.5 Viewing Power Details (Channel Power Values) Viewing Power Details (Channel Power Values) Press the [SCREEN] key to display the [MEAS, POWER] screen. Per-channel Per-channel active power apparent power Total active Total apparent power power Per-channel Per-channel power factor reactive power Total reactive Total power... -
Page 99: Viewing Energy (Active Energy And Reactive Energy)
5.6 Viewing Energy (Active Energy and Reactive Energy) Viewing Energy (Active Energy and Reactive Energy) Press the [SCREEN] key to display the [MEAS, INTEG.](INTE- GRATE) screen. • Total energy from the start of recording will be displayed. • Energy cost displays the result of multiplying the active energy consumption value WP+ by the Unit cost setting (p. -
Page 100: Viewing A Demand Graph
5.7 Viewing a Demand Graph Viewing a Demand Graph Press the [SCREEN] key to display the [MEAS, DEMAND] screen. The instrument stores data for up to 48 of the latest time intervals in its internal memory for user review. Switches the display parameter. When active power demand value (con- Active power demand value (consump- sumption Pdem+) is selected, displays a... -
Page 101: Viewing A Harmonic Graph (Pw3360-21 Only)
5.8 Viewing a Harmonic Graph (PW3360-21 only) Viewing a Harmonic Graph (PW3360-21 only) Press the [SCREEN] key to display the [MEAS, HARM](HARMONIC G) screen. Cursor Total harmonic distortion (THD-F or THD-R) measured value See: "THD calculation (PW3360-21 only)" (p. 70) THD is not included in power. - Page 102 5.8 Viewing a Harmonic Graph (PW3360-21 only) Harmonic power phase angle (vector display) graph screen Performs cursor measurement. The order can be changed using the cursor keys. The display can be changed from the normal bar graph to a vector graph when the display parame- ter is set to the active power phase angle display.
-
Page 103: Viewing A Harmonic List (Pw3360-21 Only)
5.9 Viewing a Harmonic List (PW3360-21 only) Viewing a Harmonic List (PW3360-21 only) Press the [SCREEN] key to display the [MEAS, HARM](HARMONIC L) screen. Total harmonic distortion (THD-F or THD-R) See: "THD calculation (PW3360-21 only)" (p. 70) THD is not included in power. -
Page 104: Viewing Waveforms
5.10 Viewing Waveforms 5.10 Viewing Waveforms Press the [SCREEN] key to display the [MEAS, WAVE](WAVE- FORM) screen. Voltage waveforms U1: Red U2: Yellow Voltage U3: Blue Voltage vertical axis Voltage value Current for 1 division Current waveforms I1: Red Frequency I2: Yellow... -
Page 105: Changing The Zoom Factor For The Vertical Axis Used To Display Voltage And Current Waveforms
5.10 Viewing Waveforms Changing the Zoom Factor for the Vertical Axis Used to Display Voltage and Current Waveforms Press the [MAGNIFY] key. The cursor will move to the zoom factor field, and you will be able to change the setting. Move the cursor to the voltage or current zoom factor and press the [ENTER]... -
Page 106: Enlarging Measured Values On The Display
5.11 Enlarging Measured Values on the Display 5.11 Enlarging Measured Values on the Display Press the [SCREEN] key to display the [MEAS, ZOOM] screen. Selects the parameter to enlarge. Changing display parameters Press the [SELECT] key. The cursor will move to the display parameter field, and you will be able to change the setting. -
Page 107: Viewing A Trend Graph
5.12 Viewing a Trend Graph 5.12 Viewing a Trend Graph Press the [SCREEN] key to display the [MEAS, TREND] screen. Maximum value during the save interval Switches the display parameter. Average value during the save interval Minimum value during the save interval Cursor ... - Page 108 5.12 Viewing a Trend Graph Select either [Vertical axis] [Horizontal axis] with the cursor and press the [ENTER] key. dialog box [Magnify Selection] will be displayed. Select the desired zoom factor with the cursor keys and press the [ENTER] key. The other axis can be changed in the same manner.
-
Page 109: Starting And Stopping Recording And Measurement
Starting and Stopping Recording and Chapter 6 Measurement The method used to start and stop recording is set with the [REC START] [REC STOP] settings on the [SET 4/8, REC 2] screen. Recording and measurement data is saved to the destination selected on the [SET 3/8, REC 1] screen. -
Page 110: Starting Recording
6.1 Starting Recording 6.1 Starting Recording Do not remove the SD memory card while recording is in prog- ress. If the SD memory card is removed during recording, mea- surement data will be saved in a new file (with a sequentially numbered suffix) when the card is reinserted. -
Page 111: Starting Recording By Specifying A Time
6.1 Starting Recording Starting Recording by Specifying a Time Set the recording start method on the [SET 4/8, REC 2] screen to [TIME] and set the start time. Press the key on the Mea- surement screen. The instrument will enter the standby state. The recording LED flashing When the set start time is reached, recording will start (and the RECORDING LED will light up). -
Page 112: Starting Recording At A Good Time Division (Interval Time)
6.1 Starting Recording Starting Recording at a Good Time Division (Interval Time) Set the recording start method on the [SET 4/8, REC 2] screen to [INTER- VAL]. Press the key on the Mea- surement screen. The instrument will enter the standby state. The recording LED flashing Recording will start automatically when a good time division is reached based on the save interval time. -
Page 113: Stopping Recording
6.2 Stopping Recording 6.2 Stopping Recording Stopping Recording Manually Set the recording stop method on the [SET 4/8, REC 2] screen to [MAN- UAL]. Press the key on the Mea- surement screen. A confirmation dialog box will be displayed. Press the [ENTER] key to stop recording. -
Page 114: Using Repeat Recording
6.3 Using Repeat Recording 6.3 Using Repeat Recording Set the recording start method on the [SET 4/8, REC 2] screen to [REPEAT] and set the start date. Set the stop date for the recording stop method. When using repeat recording, the recording stop method cannot be changed. Set the recording time period and folder segmenting method. - Page 115 6.3 Using Repeat Recording If the key is pressed after the starting time of the recording time period, the interval time starting method is employed. Recording will be stopped automatically when the recording time period on the set repeat stop date ends. To stop recording before the set stop time is reached, press the key, just as when stopping recording manually.
-
Page 116: Operation When A Power Outage Occurs While Recording
6.4 Operation When a Power Outage Occurs While Recording 6.4 Operation When a Power Outage Occurs While Recording If the supply of power to the instrument is cut off while recording is in progress, measurement operation will stop during the outage, but previously recorded measurement data and setting conditions will be backed up. -
Page 117: Chapter 7 Quick Set
7.1 Settings Configured with the Quick Set Chapter 7 Quick Set The Quick Set offers step-by-step guidance on the minimum necessary tasks that must be accomplished in order to perform recording and mea- surement in the following order: [Basic Set]→[Connect]→[U Wir- ing]→[I Wiring]→[I Range]→[I Check]→[Rec Set]→[Start]. -
Page 118: Settings That Can Be Added To Quick Set Settings
7.2 Settings That Can Be Added to Quick Set Settings 7.2 Settings That Can Be Added to Quick Set Settings Using the following procedure, normal settings can be applied in combination with the Quick Set to perform recording and measurement as desired: Press the key to start the Quick Set. - Page 119 7.2 Settings That Can Be Added to Quick Set Settings Press the key and configure the necessary settings on the Set- tings screen. See: 4.2, "Changing Measurement Settings" (p. 65) Reconfirm the wirings and measured values. See: 3.9, "Verifying Correct Wiring (Wiring Check)"...
- Page 120 7.2 Settings That Can Be Added to Quick Set Settings...
-
Page 121: Saving Data And Manipulating Files
Extension Format SD memory card Internal memory Recording and Available Available measurement data Harmonic data Binary Available Not available (PW3360-21 only) Screen copy Available Not available Waveform data Binary Available Not available Setting Text Available Available The File screen allows you to perform operations such as loading settings data,... -
Page 122: Viewing And Using The File Screen
8.1 Viewing and Using the File Screen 8.1 Viewing and Using the File Screen SD memory card file screen When you scroll the screen with the cursor Displays the File screen (SD keys, the scroll bar indicates your current position. memory card/internal memory) Displays the amount of space used and switches screens. - Page 123 8.1 Viewing and Using the File Screen Internal memory file screen When you scroll the screen with the cursor keys, the scroll bar indicates your current position. Displays the File screen (SD memory card/internal memory) Displays the amount of space used on the and switches screens.
-
Page 124: Folder And File Structure
8.2 Folder and File Structure 8.2 Folder and File Structure This section describes the folder and file structure on the SD memory card and in the instrument’s internal memory. SD Memory Card The PW3360 base folder is required in order for the instrument to save data on the SD memory card. - Page 125 HIOKI0 • When a recording and measurement data file, harmonic data file (PW3360-21 only), or waveform data file exceeds 200 MB, all files will be segmented and new files added. • Up to 203 folders can be created under the PW3360 base folder.
- Page 126 • When saving of screen copies is off, this folder will not be created. • MMDDhhmm: Output time and date When a recording and measurement data file, harmonic data file (PW3360-21 only), or waveform data file exceeds 200 MB, all files will be segmented and new files added.
- Page 127 + folder sequential number (0 to 99) + file sequential number (00 to 99) When a recording and measurement data file, harmonic data file (PW3360-21 only), or waveform data file exceeds 200 MB, all files will be segmented and new files added.
- Page 128 8.2 Folder and File Structure Available Recording Time The following table shows a guideline of recording times for which an SD memory card can record data. The available recording time varies depending on setting con- ditions. Save Time Save Time Saving of Saving of Saving of...
-
Page 129: Internal Memory
Only settings files and recording and measurement data files can be saved in the instrument’s internal memory. Since harmonic data (PW3360-21 only), screen copies, and waveform data cannot be saved in internal memory, they must be saved on the SD memory card. -
Page 130: Saving Copies Of The Screen (Sd Memory Card Only)
8.3 Saving Copies of the Screen (SD Memory Card Only) 8.3 Saving Copies of the Screen (SD Memory Card Only) The screen currently being displayed can be saved in BMP file for- mat on the SD memory card. Even if the save destination (p. 71) is set to [Internal M], screen copies are saved on the SD memory card. -
Page 131: Saving Settings Files
8.4 Saving Settings Files 8.4 Saving Settings Files By saving the current settings state and then later loading the cor- responding settings data, you can restore the instrument to its state at the time the settings were saved. Set the settings file save destina- tion. -
Page 132: Loading Settings Files
8.5 Loading Settings Files 8.5 Loading Settings Files This section describes how to load a settings file that was previ- ously saved on the SD memory card or in the instrument’s internal memory. LAN settings are not loaded. SD Memory Card Press the key to display the [FILE, SD]... -
Page 133: Internal Memory
8.5 Loading Settings Files Internal Memory Press the key to display the [FILE, Memory] screen. Select the settings file (with the .SET extension) to load. : Move up and down (select a file). Press the [SET.LOAD] key. When the confirmation dialog box is displayed, press the [YES] key. -
Page 134: Copying Internal Memory Files To The Sd Memory Card
8.6 Copying Internal Memory Files to the SD Memory Card 8.6 Copying Internal Memory Files to the SD Memory Card This section describes how to copy internal memory files to the SD memory card. Press the key to display the [FILE, Memory] screen. -
Page 135: Deleting Folders And Files
8.7 Deleting Folders and Files 8.7 Deleting Folders and Files This section describes how to delete folders and files stored on the SD memory card or in the instrument’s internal memory. Press the key to display the [FILE, SD] [FILE, Memory] screen. -
Page 136: Formatting The Sd Memory Card Or Inter- Nal Memory
8.8 Formatting the SD Memory Card or Internal Memory 8.8 Formatting the SD Memory Card or Inter- nal Memory This section describes how to format an SD memory card or the instrument’s internal memory. Press the key to display the [FILE, SD] screen or the [FILE,... - Page 137 8.8 Formatting the SD Memory Card or Internal Memory • Formatting will cause all saved data to be erased, and it cannot be undone. Check the contents of the card or memory before for- matting. It is recommended to back up important data on SD memory cards and in the instrument’s internal memory.
- Page 138 8.8 Formatting the SD Memory Card or Internal Memory...
-
Page 139: Analyzing Data On A Computer
• PW3360/PW3365 Recording and Available measurement data Auto Excel Graph Creation Applica- tion (p. 149) Harmonic data Binary Available (PW3360-21 only) Waveform data Available Binary • Graphics Software Screen copy Not Available Setting Text Not Available • Text editor... -
Page 140: Copying Data To A Computer (Sd)
9.1 Copying Data to a Computer (SD) 9.1 Copying Data to a Computer (SD) This section describes how to eject the SD memory card from the instrument and copy data from the card to a computer. If the computer does not have an SD mem- ory card slot, please purchase an SD memory card reader. - Page 141 9.1 Copying Data to a Computer (SD) Double click the [PW3360SD]. Double click [Removable Disk] If the SD card was not formatted with instrument, will be dis- played. Copy the necessary folders or files to the specified folder on the computer.
-
Page 142: Copying Data To A Computer (Usb)
9.2 Copying Data to a Computer (USB) 9.2 Copying Data to a Computer (USB) This section describes how to copy data from an SD memory card or the instru- ment’s internal memory to a computer by connecting the instrument and computer with the included USB cable. - Page 143 9.2 Copying Data to a Computer (USB) Press the [USB Drive] key on the [FILE, SD] screen. If the instrument is connected to the computer, the following message will be dis- played on the instrument: Connecting to mass storage. To cansel, hit ESC. Cancel: ESC The computer will recognize the SD memory card and internal memory as remov- able disks.
-
Page 144: Sf1001 Power Logger Viewer (Optional)
9.3 SF1001 Power Logger Viewer (Optional) 9.3 SF1001 Power Logger Viewer (Optional) The SF1001 Power Logger Viewer is a software application that runs on a computer to analyze data recorded with the instrument. The SF1001 can load measurement data recorded with the instrument. However, note that it may lose the ability to load files if they are opened with another application or overwritten, causing the format to change. - Page 145 9.3 SF1001 Power Logger Viewer (Optional) Printing reports You can print user-specified measurement data as reports. Converting measurement data into CSV-format files Parameters displayed on the Time-series Graph screen, Summary screen, Daily/ Weekly/Monthly Report screen, and Wave- form screen as well as data for the displayed time period can be saved as a CSV-format file.
-
Page 146: Checking Recording And Measurement Data With Excel
Since recording and measurement data is stored in CSV-format files, it can be ® loaded into Excel Harmonic data (PW3360-21 only) and waveform data use a binary format and can- ® not be loaded into Excel . Review this data with the SF1001 Power Logger Viewer (option). -
Page 147: Saving Data As An Excel ® File
9.4 Checking Recording and Measurement Data with Excel® ® Saving Data as an Excel File ® When you open measurement data in Excel and overwrite the original file by sav- ing it as a CSV-format file, the file format will change. When you open a measure- ®... -
Page 148: Example Of Data From A Measurement File
Instrument information Recording start time Measurement data Measurement information Measurement File Contents Instrument information Parameter Parameter name Format Description Instrument informa- HIOKI PW3360 PW3360 serial tion S/N.123456789 number (VerX.XX) (Version number) Automatic: YYMMDDXX FOLDER Folder name User-specified: ABCDE Folder name (5 characters) 1P2W/1P2Wx2/1P2Wx3/... - Page 149 9.4 Checking Recording and Measurement Data with Excel® Parameter Parameter name Format Description Calculation selec- tion ot the total har- THD (Total har- monic distortion (PW3360-21 monic distortion) THD-F/ THD-R See: "Appendix4 only) Calculation selection Terminology" (p. 1sec/2sec/5sec/10sec/ 15sec/30sec/1min/2min/ INTERVAL...
- Page 150 9.4 Checking Recording and Measurement Data with Excel® Measurement information Parameter Parameter Format Description name Output time YYYY-MM-DD Date Output time and date and date hh:mm:ss Etime Elapsed time hhhh:mm:ss Elapsed time from start of recording A : U1 (voltage CH1) peak exceeded B : U2 (voltage CH2) peak exceeded C : U3 (voltage CH3) peak exceeded D : I1 (current CH1) peak exceeded...
- Page 151 9.4 Checking Recording and Measurement Data with Excel® Measurement data header Parameter Parameter name Description Freq_xxx[Hz] Frequency U1_xxx[V] Voltage RMS U1(CH1) U2_xxx[V] U2(CH2) See: 5.4, "Viewing Voltage U3_xxx[V] U3(CH3) and Current Value U12(CH12) Details" (p. 89) U12_xxx[V] For 3P3W2M wirings, value for third channel as calculated from U1 and U2 Voltage fundamental waveform value ...
- Page 152 9.4 Checking Recording and Measurement Data with Excel® Parameter Parameter name Description I1_xxx[A] Current RMS I1(CH1) I2_xxx[A] I2(CH2) See: 5.4, "Viewing Voltage I3_xxx[A] I3(CH3) and Current Value Details" (p. 89) I12(CH12) I12_xxx[A] For 3P3W2M wirings, value for third channel as calculated from I1 and I2 Current fundamental wave value...
- Page 153 9.4 Checking Recording and Measurement Data with Excel® Parameter Parameter name Description Q1_xxx[var] Reactive power Q1(CH1) Q2_xxx[var] Q2(CH2) Q3_xxx[var] Q3(CH3) Q_xxx[var] Q(total) PF1_xxx Power factor PF1(CH1) PF2_xxx PF2(CH2) PF3_xxx PF3(CH3) See: "PF/Q/S calculation" PF_xxx PF(total) (p. 68) Displacement power factor "Appendix4 Termi- DPF1_xxx DPF1(CH1)
- Page 154 9.4 Checking Recording and Measurement Data with Excel® Parameter Parameter name Description Active power demand quantity WP-dem[Wh] (Regeneration) Active power demand quantity Active energy (Regener- (Regeneration), first circuit to third cir- ation) for each interval WP-dem1[Wh] to cuit time WP-dem3[Wh] Active power demand quantity (Regeneration) for each of three 1P2W circuits...
- Page 155 9.4 Checking Recording and Measurement Data with Excel® Parameter Parameter name Description PFdem Power factor demand value The average value of the power factor for each Power factor demand value, first cir- time interval cuit to third circuit PFdem1 to PFdem3 ...
-
Page 156: Converting Measured Value Exponential Data
9.4 Checking Recording and Measurement Data with Excel® Converting Measured Value Exponential Data Measured values are displayed exponentially so that the instrument can accommo- date values of varying lengths. To make it easier to view data in Excel , exponential data can be converted into numerical data. -
Page 157: Using The Pw3360/Pw3365 Auto Excel Graph Creation Application
By installing the PW3360/PW3365 Auto Excel Graph Creation Application, you can automatically create graphs from recording and measurement data in Excel graph cannot be created form harmonic data (only PW3360-21) or waveform data because these data are binary format. Click Click ... - Page 158 9.5 Using the PW3360/PW3365 Auto Excel® Graph Creation Application Install the software on your computer. [MANU- For more information about how to install and use the software, see AL.pdf] , which is included in the archive file.
-
Page 159: Using Communications (Lan)
10.1 LAN Communications Using Communications Chapter 10 (LAN) 10.1 LAN Communications Using a LAN connection, you can operate the PW3360 remotely using an Internet browser. You must configure the instrument’s LAN settings, create a network, and connect the instrument and a computer with a LAN cable. The instrument provides function- ality for automatically detecting whether a straight or cross cable is being used. -
Page 160: Configure The Instrument's Lan Settings
10.1 LAN Communications Configure the Instrument's LAN Settings • Make these settings before connecting to a network. Changing settings while connected can duplicate IP addresses of other network devices, and incorrect address information may other- wise be presented to the network. •... - Page 161 10.1 LAN Communications Network environment configuration Example 1. Connecting the instrument to an existing network To connect to an existing network, the network system administrator (IT department) has to assign set- tings beforehand. Some network device settings must not be duplicated. Obtain the administrator's assignments for the following items, and write them down.
-
Page 162: Connecting The Instrument And Computer With A Lan Cable
10.1 LAN Communications Connecting the Instrument and Computer with a LAN Cable • When connecting the instrument to your LAN using a LAN cable of more than 30 m or with a cable laid outdoors, take appropriate coun-termeasures that include installing a surge protector for LANs. - Page 163 10.1 LAN Communications When connecting the instrument to an existing network (when connecting the instrument to a hub) Preparation items(provide either of the following) A 100Base-TX straight cable (up to 100 m in length, commercially available) Model 9642 LAN Cable (optional) Connect the LAN cable to the instrument’s LAN interface.
- Page 164 10.1 LAN Communications When connecting the instrument directly to a computer (when connecting the instrument to a computer) Preparation items(provide either of the following) A 100Base-TX straight or cross cable (up to 100 m in length) Model 9642 LAN Cable (optional) Connect the LAN cable to the instrument’s LAN interface.
-
Page 165: Remote Control Of The Instrument By Inter- Net Browser
10.2 Remote Control of the Instrument by Internet Browser 10.2 Remote Control of the Instrument by Inter- net Browser The instrument includes a standard HTTP server function that supports remote con- trol by an internet browser on a computer. The instrument's display screen and control panel keys are emulated in the browser. Operating procedures are the same as on the instrument. - Page 166 10.2 Remote Control of the Instrument by Internet Browser If the HTTP screen is not displayed ® Check Internet Explorer ’s settings. ® On the Internet Explorer settings, click [Tools]-[Internet Options]. On the [Advanced] tab, enable [Use HTTP1.1] and disable [Use HTTP1.1 through proxy connections].
-
Page 167: Operating The Instrument Remotely
10.2 Remote Control of the Instrument by Internet Browser Operating the Instrument Remotely Click Remote Control Screen The remote operation page will be displayed. Click If a password has been set, the following page will be displayed. Enter the password and click the [SET] button. -
Page 168: Setting A Password
10.2 Remote Control of the Instrument by Internet Browser Setting a Password You can restrict remote operation by setting a password. Click [Password Setting] on the main page. The following page will be displayed. Enter the [Old Password], [New Password], and [Confirm New Pass- word] fields and click the... -
Page 169: Downloading Recorded Data To Computer
10.3 Downloading Recorded Data to Computer 10.3 Downloading Recorded Data to Computer Because the instrument is running an FTP (File Transfer Protocol)* server, using the FTP client function of the computer allows files from the SD memory card or internal memory to be downloaded to the computer. - Page 170 ON/OFF USER NAME Configure a user name used when connecting an FTP client to the instrument. (Up to 20 one-byte characters, example: HIOKI) PASSWORD Configure a password used when connecting an FTP client to the instrument. The password does not appear on the screen (displayed as ****************).
-
Page 171: Download
10.3 Downloading Recorded Data to Computer Download Run an FTP client software. This section explains an example of using a free software WinSCP. Explorer can be used when the FTP authorization is not used. Enter the following and click [Login]. Host name IP address of the instrument(p. - Page 172 10.3 Downloading Recorded Data to Computer Click [SD] or [MEM]. Internal memory SD memory card Copy to any folder by selecting a folder or file. • To copy measured data, copy the “Folders for measured data”. See: 8.2, "Folder and File Structure" (p. 116) •...
- Page 173 10.3 Downloading Recorded Data to Computer • Previous data excluding the latest one may end up getting downloaded to the computer (as data left from the previous access gets saved as temporary Internet files in web browsers). When wanting to perform remote control: See: 10.2, "Remote Control of the Instrument by Internet Browser"...
- Page 174 10.3 Downloading Recorded Data to Computer...
-
Page 175: Using Pulse Input And Output
Using Pulse Input Chapter 11 and Output The pulse I/O terminals can be used to input a pulse signal from an external source or to output a pulse signal that is proportional to active energy during recording and measurement. Pulse signal input External device Wire... -
Page 176: Connecting Wires To The Pulse I/O Terminals
11.1 Connecting Wires to the Pulse I/O Terminals 11.1 Connecting Wires to the Pulse I/O Termi- nals This section describes how to connect wires to the pulse I/O terminals. When using pulse output, the signal must be pulled up to the external power supply. See: 11.4, "Outputting a Pulse Signal"... -
Page 177: Configuring Pulse Settings
11.2 Configuring Pulse Settings 11.2 Configuring Pulse Settings When using the pulse I/O terminals, you must configure the instrument’s pulse set- tings. [SET 8/8, PULSE] Press the key to display the screen. Configure the settings as desired. Pulse input FILTER ON/OFF SCALING 0.001 to 100.000... -
Page 178: Inputting A Pulse Signal
11.3 Inputting a Pulse Signal 11.3 Inputting a Pulse Signal This section describes how to input a pulse signal from an external source. After configuring scaling (coefficient), sub-unit, and unit (five byte characters) settings, you can convert an input pulse signal. When recording and measurement are started, pulses are measured, and pulse values are saved for each save time interval. - Page 179 11.3 Inputting a Pulse Signal Filter Frequency High/Low period 25 Hz or less 20 ms or more (Mechanical contact use) 100 s or more 5 kHz or less (Electronic contact use) • The pulse input low terminal is common with the instrument GND and is not isolated.
-
Page 180: Outputting A Pulse Signal
11.4 Outputting a Pulse Signal 11.4 Outputting a Pulse Signal A pulse signal is output each time active energy consumption (WP+) exceeds the pulse output rate during recording and mea- surement. For example, if the output rate is 10 kWh, the pulse sig- nal will be output each time the active energy consumption (WP+) exceeds the output rate after recording and measurement start, specifically at 10 kWh, 20 kWh, and 30 kWh. - Page 181 11.4 Outputting a Pulse Signal The pulse output terminal is isolated from the instrument’s internal circuitry. When using pulse output, connect the “PULSE OUT Hi” terminal to an external power supply using a pull-up resistor as shown in the following example external circuit: Power source (30V or less) Pull-up resistor...
- Page 182 11.4 Outputting a Pulse Signal...
-
Page 183: Chapter 12 Specifications
12.1 General Specifications Chapter 12 Specifications 12.1 General Specifications Operating Indoors, Pollution degree 2, altitude up to 2,000 m (6562-ft.) environment -10°C to 50°C (14°F to 122°F), 80%RH or less (non-condensat- Operating ing) temperature When using LAN communications, 0°C to 50°C (32°F to 122°F), When operating on battery power, 0°C to 40°C (32°F to 104°F), ... - Page 184 12.1 General Specifications Backup battery Clock and settings (Lithium battery), life Approx. 10 years at 23°C (at 73.4°F) Without PW9002: Approx. 180W x 100H x 48D mm / Approx. 7.09”W x 3.94”H x 1.89”D (excluding protrusions) Dimensions With PW9002: Approx.
-
Page 185: Basic Specifications
12.2 Basic Specifications 12.2 Basic Specifications Input specifications Number of Voltage: 3 channels, Current: 3 channels channels Single-phase 2-wire (1P2W, 1P2W 2 circuits,1P2W 3 circuits) × × Single-phase 3-wire (1P3W, 1P3W1U) Measurement Three-phase 3-wire (3P3W2M, 3P3W3M) line type Three-phase 4-wire (3P4W) Current only Measurement ... - Page 186 (lag, lead), active power demand value (consump- tion, regeneration), reactive power demand value (lag, lead), power factor demand, pulse input, harmonic voltage level, harmonic current level, harmonic power level, content percentage, phase angle, total harmonic distortion (THD-F or THD-R) (PW3360-21 only)
- Page 187 12.2 Basic Specifications Display range, effective measurement range, effective peak range chart (representative example: 9661 sensor) Display Effective measurement Display Effective peak range range range Item Range Lower limit Lower limit Upper limit Upper limit Range Voltage 5.00 V 90.00 V 780.00 V 1000.0 V ±...
- Page 188 12.2 Basic Specifications Other conditions Real-Time Clock Auto-calendar, leap-year correcting 24-hour clock function Real-time Within ±0.3 s per a day (power on, 0°C to 50°C) clock accuracy Within ±0.5 s per a day (power on, -10°C to 0°C) Temperature ...
-
Page 189: Detailed Measurement Specifications
12.3 Detailed Measurement Specifications 12.3 Detailed Measurement Specifications Measurement items Voltage RMS (U) Measurement True RMS type method Measurement 600 V single range range 45 Hz to 66 Hz: ±0.3% rdg. ±0.1% f.s. With a fundamental frequency of 50 Hz/60 Hz Measurement Up to 1 kHz: ±3% rdg. - Page 190 12.3 Detailed Measurement Specifications Frequency (f) Measurement Reciprocal method method Measurement 40.000 Hz to 70.000 Hz range Measurement Voltage U1 channel Measurement ±0.5%rdg. accuracy For sine wave input from 90 V to 780 V Voltage waveform peak (Upeak/Upk), Current waveformpeak (Ipeak/Ipk) Measurement Peak value (absolute value) for each calculation interval (10 cycles method...
- Page 191 12.3 Detailed Measurement Specifications Reactive power (Q, PF/Q/S calculation selection: RMS calculations) Measurement ±1 dgt. relative to calculations from measured values accuracy Uses the sign of reactive power Q (fundamental wave reactive Lag/Lead power). display Positive : Lag Negative : Lead For SD memory card and internal memory output data, the polarity indicates lag/lead.
- Page 192 12.3 Detailed Measurement Specifications Apparent power (S, PF/Q/S calculation selection: fundamental calculations) This apparent power S is defined as the fundamental wave apparent power. Calculated from the fundamental wave active power and the funda- Measurement mental wave reactive power. method See: "Apparent power"...
- Page 193 12.3 Detailed Measurement Specifications Power factor (PF, PF/Q/S calculation selection: fundamental calculations) This power factor PF is defined as the displacement power factor DPF. Uses the sign of reactive power Q (fundamental wave reactive Lag/Lead power). display Positive opposite sign : Lag Negative opposite sign : Lead For SD memory card and internal memory output data, the polarity...
- Page 194 12.3 Detailed Measurement Specifications Active power demand quantity (WPdem), Reactive power demand quantity (WQdem), Data is output but not displayed. Active power values are integrated separately for consumption and regeneration for each interval time. Measurement Reactive power values are integrated separately for lag and lead method during the interval time.
- Page 195 Analysis each order for voltage, current, and power parameters See: "Harmonic voltage, current, and power (PW3360-21 only)" (p. 206) Harmonic phase angle: Harmonic phase angle for each order for voltage, current, and power See: "Harmonic phase angle (PW3360-21 only)" (p. 207)
- Page 196 12.3 Detailed Measurement Specifications Harmonic Wave (PW3360-21 only) • Harmonics level 1 th to 15 th: ±5%rdg.±0.2%f.s. 16 th to 20 th: ±10%rdg.±0.2%f.s. 21 th to 40 th: ±20%rdg.±0.3%f.s. However, accuracy figures from the clamp sensor specifications are added for current and power.
-
Page 197: Functional Specifications
Enlarged views (selection of four parameters for enlarged views) Trend (Selection of one measurement parameter for a time-series display of maximum, minimum, and average values) Harmonics (voltage, current, and power levels, content percentage, phase angle graph, and list) (PW3360-21 only) Wiring Wiring diagram, Wiring check (wiring confirmation) Setting... - Page 198 Energy cost Currency: 3 user-specified alphanumeric characters THD calcula- tion selection THD-F/THD-R (PW3360-21 only) Calculated and displayed based on the amount of space remaining Remaining on the SD memory card or in the internal memory, the save interval, save time and the save items.
- Page 199 PW3360-20: Average only / all data (maximum, minimum, and aver- age) Save items PW3360-21: Average only (no harmonics)/ all data (No harmonics) / average only (w/harmonics)/ all data (w/harmonics) ON/OFF (Saves the displayed screen as a BMP at a fixed interval.) The minimum interval time for saving screen copies is 5 min.
- Page 200 12.4 Functional Specifications Setting screen JAPANESE/ENGLISH/CHINESE/GERMAN/ITALIAN/FRENCH/ Language SPANISH/TURKISH/KOREAN Phase name R S T/A B C/L1 L2 L3/U V W A system reset causes the instrument settings to be reset to their System reset default values. However, the time, language, frequency, IP address, subnet mask, and default gateway are not reset.
- Page 201 (this information is not saved). Graph (voltage, current, and active power levels, content percent- Harmonic age, phase angle) (PW3360-21 List (voltage, current, and active power levels, content percentage, only) phase angle) Displays voltage and current waveforms, voltage and current RMS values, and frequency.
- Page 202 12.4 Functional Specifications Maximum/minimum/average value processing methods Maximum Minimum Average value value value Blank: Blank: Measurement parameter Blank: Arithmetic mean Simple max. Simple mini. value value Voltage RMS value Current RMS value Frequency Voltage waveform Upeak peak No average value Current waveform Ipeak peak...
- Page 203 No display (THD-F) (PW3360-21 only) PF/Q/S calcula- No display (RMS calculation) tion selection Page/item THD calculation (PW3360-21 only) Quick Set content No display (THD-F) SD card (disabled) Save destination Save to internal memory if no SD card has been inserted.
- Page 204 / 30 / 60 min. Displays the available save time. PW3360-20: AVG only* / ALL data (maximum, minimum, and average) PW3360-21: AVG only (no Harmonic)*/ ALL data (no Harmonic) / AVG only (w/Harmonic)/ ALL Save items data (w/Harmonic) No screen saving (no display)
- Page 205 12.4 Functional Specifications External interface specifications SD memory card interface Slot SD standard compliant x 1 Compatible SD memory card/ SDHC memory card (Use only HIOKI-approved card SD memory card) Format SD memory card format Saved data Settings data, measurement data, screen data, and waveform data...
- Page 206 12.4 Functional Specifications Pulse output Outputs a pulse signal proportional to active energy during integral Functions energy measurement. Open collector, 30 V/5 mA max. (photocoupler-isolated) Output signal Active-low Target Active energy: For consumption (WP+) component only OFF / 1 Wh / 10 Wh / 100 Wh / 1 kWh / 10 kWh / 100 kWh / Pulse rate 1000 kWh (Default value: 1 kWh) Pulse width...
- Page 207 12.4 Functional Specifications Other functionality Holds displayed values but not the clock. Display hold Measurement continues internally, and readings are applied to maxi- mum, minimum, and average values. Disables all key operation, except the power switch. Key lock Turned ON and OFF by pressing and holding the ESC key for at function least 3 seconds.
-
Page 208: Calculation Formulas
12.5 Calculation Formulas 12.5 Calculation Formulas Voltage and current RMS values Wiring Three- Single-phase Single-phase Three-phase setting phase 2 wire 3 wire 3 wire 4 wire Item 1P2W 1P3W 1P3W1U 3P3W2M 3P3W3M 3P4W – ---- - Voltage U [Vrms] •... - Page 209 12.5 Calculation Formulas Reactive power Three- Wiring Single-phase Single-phase Three-phase phase setting 2 wire 3 wire 3 wire 4 wire Item 1P2W 1P3W 1P3W1U 3P3W2M 3P3W3M 3P4W PF/Q/S (RMS calculation) Q=si – – • When S < |P| due to the effects of measurement error, unbalance, or other factors, S = |P| and Q = 0.
- Page 210 12.5 Calculation Formulas Apparent power Three- Wiring Single-phase Single-phase Three-phase phase setting 2 wire 3 wire 3 wire 4 wire Item 1P2W 1P3W 1P3W1U 3P3W2M 3P3W3M 3P4W ×I ×I ×I ×I PF/Q/S (RMS cal- culation) ------ - S ------ - U ×I •...
- Page 211 12.5 Calculation Formulas Power factor, Displacement power factor Three- Wiring Single-phase Single-phase Three-phase phase setting 2 wire 3 wire 3 wire 4 wire Item 1P2W 1P3W 1P3W1U 3P3W2M 3P3W3M 3P4W Displace- ment power factor c 1 1 = si DPF= si ----------- -...
- Page 212 12.5 Calculation Formulas Demand quantity (output data only; not displayed) Three- Wiring Single-phase Single-phase Three-phase phase setting 2 wire 3 wire 3 wire 4 wire Item 1P2W 1P3W 1P3W1U 3P3W2M 3P3W3M 3P4W Active power WP+dem = demand quan- tity (consumption) •...
- Page 213 12.5 Calculation Formulas Demand value, Pulse input Three- Wiring Single-phase Single-phase Three-phase phase setting 2 wire 3 wire 3 wire 4 wire Item 1P2W 1P3W 1P3W1U 3P3W2M 3P3W3M 3P4W Active power Pdem+ = -- - demand value (consumption) • h: Interval duration Pdem+[W] •...
- Page 214 12.5 Calculation Formulas Harmonic voltage, current, and power (PW3360-21 only) Wiring Single-phase Single-phase Three-phase Three- setting 2 wire 3 wire 3 wire phase Item 4 wire 1P2W 1P3W 1P3W1U 3P3W2M 3P3W3M 3P4W Voltage [Vrms] • When using 3P3W3M wiring, the phase voltage is used.
- Page 215 12.5 Calculation Formulas Harmonic phase angle (PW3360-21 only) Wiring Three- Single-phase Single-phase Three-phase setting phase 2 wire 3 wire 3 wire Item 4 wire 1P2W 1P3W 1P3W1U 3P3W2M 3P3W3M 3P4W φU φU φU φU φU φU Voltage phase ...
- Page 216 12.5 Calculation Formulas Total harmonic distortion (PW3360-21 only) Wiring Three- Single-phase Single-phase Three-phase phase setting 2 wire 3 wire 3 wire 4 wire Item 1P2W 1P3W 1P3W1U 3P3W2M 3P3W3M 3P4W THD-F_U THD-F_U Total harmonic dis- THD-F_U THD-F_U THD-F_U THD-F_U tortion-F ...
-
Page 217: Range Configuration And Accuracy By Clamp Sensor
12.6 Range Configuration and Accuracy by Clamp Sensor 12.6 Range Configuration and Accuracy by Clamp Sensor • The range-configuration table shows the full-scale display value of each measurement range. • Voltage measurements is indicated as 5 V to 1000 V. If a mea- surement is below 5 V, it will be displayed as the value zero. -
Page 218: When The 9660, 9661, Or 9695-03 Is Used
12.6 Range Configuration and Accuracy by Clamp Sensor When the 9660, 9661, or 9695-03 is Used Power ranges Current range Voltage Wiring 5.0000 A 10.000 A 50.000 A 100.00 A 500.00 A 1P2W 3.0000 kW 6.0000 kW 30.000 kW 60.000 kW 300.00 kW 1P3W 1P3W1U... -
Page 219: When The 9694 Or 9695-02 Is Used (Cat Iii, 300 V)
12.6 Range Configuration and Accuracy by Clamp Sensor When the 9694 or 9695-02 is used (CAT III, 300 V) Power ranges Current range Voltage Wiring 500.00 mA 1.0000 A 5.0000 A 10.000 A 50.000 A 1P2W 300.00W 600.00W 3.0000kW 6.0000kW 30.000kW 1P3W 1P3W1U... -
Page 220: Model Pw9003 Voltage Line Power Adapter
12.7 Model PW9003 Voltage Line Power Adapter 12.7 Model PW9003 Voltage Line Power Adapter Banana input terminal Input terminal Connect the L9438-53 voltage Cords (2) that come with the PW3360. Connect the two banana leads (connect to the PW3360’s volt- age input terminals and supply the measurement voltage) and Output cord one AC adapter connection cord (connect to the Z1006 AC... -
Page 221: Maintenance And Service
For the replacement of the parts, please contact your autho- rized Hioki distributor or reseller. The useful lives of the parts depend on the operat- ing environment and frequency of use. Operation cannot necessarily be guaranteed for the following recommended replacement period of each part. - Page 222 13.1 Trouble Shooting If damage is suspected If damage is suspected, check the "Before Having the Instrument Repaired" (p. 215) section before contacting your authorized Hioki distributor or reseller. Calibrations IMPORTANT Periodic calibration is necessary in order to ensure that the instru- ment provides correct measurement results of the specified accu- racy.
-
Page 223: Before Having The Instrument Repaired
13.1 Trouble Shooting Before Having the Instrument Repaired Before returning for repair Symptom Check Item, or Cause Remedy and Reference If powering the instrument with the AC adapter Verify that the power cord or AC • Are the power cord and AC adapter is connected properly. - Page 224 Please purchase a new period of time with the bat- battery pack. Contact your Hioki dis- tery pack installed? tributor for more information. If the The battery pack •...
-
Page 225: Cleaning
Contact your authorized *** SYSTEM ERROR *** Hioki distributor or reseller. The adjustment values of the An adjustment value failure PW3360 are corrupted and the has occurred. instrument must be repaired. - Page 226 13.3 Error Indication Error Error display Cause Solution/more information While the Quick Set is run- F4 [STOP QS] Press the *** ERROR *** ning, you cannot switch to key to exit the Quick Set and Invalid key the Measurement, Settings, then perform your desired File, or Wirings screen.
- Page 227 Formatting failed. The instrument needs to be repaired. An internal memory error occurred. Contact your authorized Hioki distributor or reseller. The instrument was unable *** FILE ERROR *** to load the settings because No settings file. Select a settings file (exten- the selected file is not a set- Select a settings file.
- Page 228 13.3 Error Indication SD card error Error display Cause Solution/more information Data cannot be saved to the Insert an SD memory card. *** SD CARD ERROR *** SD memory card because See: 2.4, "Inserting (Remov- SD Card not found. no SD memory card has ing) an SD Memory Insert an SD Card.
- Page 229 13.3 Error Indication Error display Cause Solution/more information Back up the SD memory You attempted to access a card using a computer and *** SD CARD ERROR *** corrupt file or a corrupt SD format the card with the Error while attempting to memory card.
-
Page 230: Disposing Of The Instrument
13.4 Disposing of the Instrument 13.4 Disposing of the Instrument When disposing of this instrument, remove the lithium battery and dispose of battery and instrument in accordance with local regula- tions. • To avoid electric shock, turn off the power switch and dis- connect the cord and cables before removing the lithium battery. - Page 231 13.4 Disposing of the Instrument Pressing with your fingers on the corners of the two protectors on the left and right sides of the instrument, remove them. Using a Phillips head screwdriver, remove the four screws holding the lower case on the bottom of the instrument.
- Page 232 13.4 Disposing of the Instrument...
-
Page 233: Appendix
Appendix Appendix1 How the Instrument Samples Data The instrument samples each channel at 10.24 kHz. The three voltage channels and three current channels are switched at 61.44 kHz with a multiplexer (MUX), and two A/D converters (one for voltage and another for current) sample the channels. Since U1 and I1, U2 and I2, and U3 and I3 are sampled simultaneously, there is no phase difference between voltage and current readings for the same channel. -
Page 234: Appendix2 Three-Phase 3-Wire Measurement
Appendix2 Three-phase 3-wire Measurement I Three-phase Three-phase 3-wire Power-supply side 3-wire Load side Neutral point I I An artificial circuit of a three-phase 3-wire line : The vectors of line-to-line voltage : The vectors of phase to neutral voltage : The vectors of line (phase) current 3-phase/3-wire/3-wattmeter measurement (3P3W3M) In 3-wattmeter measurement, three phase voltages (... - Page 235 Additionally, since the sum of the voltage and current vectors always equals 0 under these conditions, the instrument internally calculates the third voltage ( ) and cur- rent ( ) values as follows: Since the values calculated internally are also applied to the 3-phase total reactive power Q, apparent power S, and power factor PF values, these values can also be calculated accurately in the event of an unbalanced state (PF/Q/S calcula- tion selection: when using RMS calculation).
- Page 236 Differences in 3-phase/3-wire/3-wattmeter measurement (3P3W3M) calcu- lations between the PW3360 and the 3169-20/21 This section describes differences in how the PW3660 Clamp on Power Logger and the 3169-20/21 Clamp on Power HiTester perform calculations during 3-phase/3- wire/3-wattmeter (3P3W3M) measurement. As indicated in the following table, the apparent power and power factor values gen- erated by the 3169-20/21 for each channel are not available for each phase because the instrument uses line-to-line voltages to calculate apparent power and power fac- tor for each channel.
-
Page 237: Appendix3 Method For Calculating Active Power Accuracy
Appendix3 Method for Calculating Active Power Accuracy The accuracy of active power calculations can be calculated as follows, taking into account the phase accuracy: Example measurement conditions Wiring: 3-phase/3-wire/2-wattmeter measurement (3P3W2M) Clamp sensor: Model 9661 Current range: 100 A (power range: 120 kW) See: "12.6 Range Configuration and Accuracy by Clamp Sensor"... -
Page 238: Appendix4 Terminology
Harmonic content percentage By observing this value, it is possible to ascertain the harmonic (PW3360-21 only) component content for individual orders. This metric provides a use- ful way to track the harmonic content percentage when monitoring a specific order. - Page 239 An international standard governing measurement of harmonic cur- rent and harmonic voltage in power supply systems as well as har- IEC61000-4-7 monic current emitted by equipment. The standard specifies the performance of a standard instrument. LAN is the abbreviation of Local Area Network. The LAN was devel- oped as a network for transferring data through a PC within a local area, such as an office, factory, or school.
- Page 240 5% or less; it may be higher at the terminal point of the (PW3360-21 only) system. THD-R: The ratio of the size of the total harmonic component to the size of...
-
Page 241: Index
Index Index Index Number 3169-20/21 Energy ..........88, 91 ..........A 4 Energy cost ........... 69 Enlarge ..........98 Error indication ........217 AC adapter ..........34 Excel ........... 139, 149 Active energy ........88, 91 Exponential ......... 148 Active power ......59, 88, 90 Alligator clip ......2, 22, 50, 53 Amount of space used... - Page 242 Index Index Reactive power ....68, 88, 90, ............A 7 ............19 Recording ..........101 LAN cable ........... 151 Recording and measurement ....101 Language ........29, 80 Recording start ......76, 101 Lead Recording stop ......77, 101, 105 ............A 7 Leakage current ......
- Page 243 Index Index Voltage Line Power Adapter ....36 Voltage phase ........61 Voltage range ........67 Voltage transformer .......36 ..........36, 43, 67 Waveform ..........74 Waveforms ..........96 Wireless LAN ........151 Wiring ............65 Wiring check ..........59 Wiring diagram ........45...
- Page 244 Index Index...
- Page 248 5 Commonwealth Ave Woburn, MA 01801 Phone 781-665-1400 Toll Free 1-800-517-8431 Visit us at www.TestEquipmentDepot.com...
Need help?
Do you have a question about the PW3360-21 and is the answer not in the manual?
Questions and answers