
Related Manuals for Hioki PW3335


Summary of Contents for Hioki PW3335
- Page 1 PW3335 PW3335-01,PW3335-02 Instruction Manual PW3335-03,PW3335-04 POWER METER Nov. 2015 Revised edition 1 PW3335A981-01 15-11H 6 0 0 4 4 0 0 1 1...
-
Page 3: Table Of Contents
Performing Synchronized Measurement Configuring Settings ......38 with Multiple Instruments ....78 3.2.1 Selecting the Current Input Method Connecting 2 instruments (PW3335) with a ............38 synchronization cable ......79 3.2.2 Selecting Display Content ....40 Configuring synchronized measurement . 80 ... - Page 4 Contents Using D/A Output ......85 Setting the LAN’s default gateway ..119 Displaying the LAN’s MAC address ..120 Connecting wires to D/A output terminals 87 Connecting the instrument to a computer 3.7.1 Level Output, High-speed Level Output, with a LAN cable ........
- Page 5 Contents High-speed Level Output ..A3 Appendix 2.3Detailed Specifications of Waveform Output ....A3 Appendix 3 Example Accuracy Calculations ..........A4 Appendix 4 Rack Mounting ......A5 Appendix 5 Dimensional Diagram....A9 Appendix 6 Terminology ......A10 Index Index1 付 録 索 引...
- Page 6 Contents...
-
Page 7: Introduction
See: "Rear" (p.18) Model PW3335-03 and PW3335-04 can measure relatively high current with the use of HIOKI Clamp on Sen- sors (clamp sensors), which are option, or current sensors. Hereafter, those sensors are collectively referred to as "current sensors". Please read the instruction manuals of each sensor for details before using. -
Page 8: Confirming Package Contents
Voltage and current input terminal safety cover ×2 Safety cover installation screws (M3×6 mm) ×4 Options (sold separately) The following options are available for the instrument. Contact your authorized Hioki distributor or reseller when ordering. Communications and control options ... -
Page 9: Safety Information
Safety Information Safety Information This instrument is designed to conform to IEC 61010 Safety Standards, and has been thoroughly tested for safety prior to shipment. However, using the instrument in a way not described in this manual may negate the provided safety features. - Page 10 Safety Information Symbols for various standards Indicates the Waste Electrical and Electronic Equipment Directive (WEEE Directive) in EU member states. This symbol indicates that the product conforms to regulations set out by the EC Directive. Other Symbols (p. ) Indicates the location of reference information. Bold-faced alphanumeric characters in the text indicate characters shown on the operation keys and display panel.
-
Page 11: Operating Precautions
• Before using the instrument for the first time, verify that it operates normally to ensure that no damage occurred during storage or shipping. If you find any damage, contact your authorized Hioki distributor or reseller. To measure accurately • Warm up the instrument for more than 30 minutes before use. - Page 12 Installation of the instrument with the ventilation holes obstructed may cause a malfunction or fire. Do not place another PW3335 or measuring instrument or other heat-generating device underneath or on top of this instrument. Doing so may damage the instrument or cause burns or fire.
- Page 13 Operating Precautions Handling the Instrument To avoid electric shock, do not remove the instrument's case. The internal components of the instrument carry high voltages and may become very hot during operation. Do not allow the instrument to get wet, and do not take measurements with wet hands. This may cause an electric shock.
- Page 14 Operating Precautions Connecting, Input and Measurement • The maximum input voltage is 1000 V DC/AC and the maximum input current to the current input terminals is 30 A DC/AC. Attempting to measure a voltage or current in excess of each of the maximum inputs could destroy the instrument and result in personal injury or death.
- Page 15 3. Turn off the power to the line to be measured. Remove the measurement cables. 4. Contact your authorized Hioki distributor or reseller. When connecting cables to the input terminals, the communication connectors, or the external I/O terminals, observe the following to avoid electric shock and short circuits.
- Page 16 Operating Precautions Before Turning Power On • Before turning the instrument on, make sure the supply voltage matches that indi- cated on its power connector. Connection to an improper supply voltage may dam- age the instrument and present an electrical hazard. •...
-
Page 17: Chapter 1 Overview
Overview 1.1 Product Overview The PW3335 is a power meter that can be used to perform power measurements for single-phase devices such as battery-driven devices and household electronics. Thanks to its broad selection of current ranges from 1 mA to 20 A (with an effective measurement range of 10 μA to 30 A), it comprises a single-device solution for measuring parameters ranging from standby power... - Page 18 PW3335-04 • The PW3335 can generate level (analog) output for each cycle of an input voltage or input current. Addi- tionally, The active power level can be output for each cycle for the voltage or current assigned to the syn- chronization source.
-
Page 19: Names And Functions Of Parts
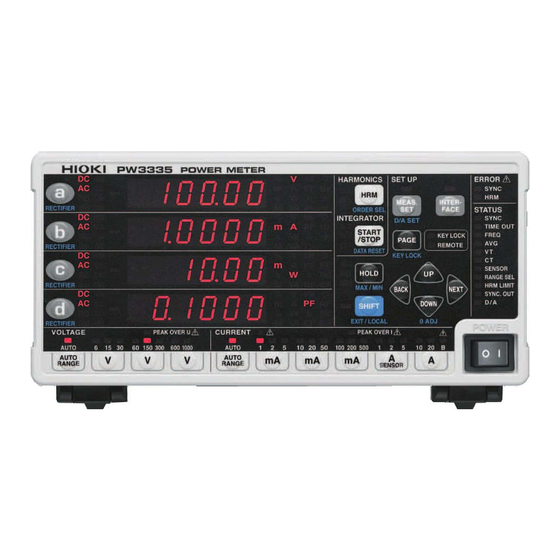
1.3 Names and Functions of Parts 1.3 Names and Functions of Parts Front Panel Example: HRM (ORDER SEL) PW3335-04 Harmonic display (switch among level, content percentage, and normal display) (Choose the order you wish to display in the shift state.) START/STOP (DATA RESET) Starts/stops integration (resets integrated values in the shift state). - Page 20 1.3 Names and Functions of Parts Activates the SHIFT state Press to light up the blue lamp before setting functions shown in blue underneath t keys. Display parameters Pressing on the first row, on the second row, on the third row, or on the fourth row of the measured value display switches the display parameter, causing the selected display parameter to light up.
- Page 21 1.3 Names and Functions of Parts Rectifier indicator lamps (p.42) When using the AC+DC rectifier, both the DC and AC lamps light DC AC When using the AC+DC Umn rectifier, the DC, AC, and Umn DC AC Umn lamps light up. Lights up when using the DC rectifier.
- Page 22 OUT (Master). Flashes with external synchronized SYNC. OUT signal input when set to IN (Slave). Turns off when set to OFF. (p.78) PW3335-02 PW3335-04 Lights up when the 7 channels of D/A output are set to val- ues other than their default values. (p.88) These lamps indicate the instrument’s overall setting status.
- Page 23 The lamp will light up if pressed when setting the inter- INTERFACE face. • LAN • RS-232C PW3335 PW3335-02 PW3335-03 PW3335-04 • GP-IB PW3335-01 PW3335-04 • Used to switch among settings configured with • Used with the key lock function.
- Page 24 1.3 Names and Functions of Parts Rear Example: PW3335-04 Power Inlet Current input terminal ( I ) Connect the supplied Input current signals. (p.26) power cord. (p.33) Voltage input terminal (U ) Input voltage signals. (p.26) External current sensor input terminal...
- Page 25 1.3 Names and Functions of Parts This instrument can be rack-mounded by Bottom panel removing its feet. Appendix 4 Rack Mounting (p. A5) See: Parts removed from this instrument should be stored in a safe place to enable future reuse. Feet Vents Keep clear of obstructions.
-
Page 26: Measurement Workflow
1.4 Measurement Workflow 1.4 Measurement Workflow Install the instrument, connect wires and cords, and turn on the instrument. Installing the Instrument (p.6) CHECKS • Are the wires from the measurement targets shut off? • Is the instrument turned off, and has the power cord been disconnected? Connecting Wires and the Power Cord Connect the measurement lines to the instrument and then connect the power cord to the instrument. - Page 27 1.4 Measurement Workflow Configure settings. (These settings can also be changed during measurement.) Setting the current input method (p.38) Selecting display parameters (p.40) Selecting voltage and current ranges (p.43) Setting the synchronization source (p.48) Selecting rectifiers (p.42) Configure the following settings as necessary: When SYNC lamp (ERROR) lights up: Setting the frequency measurement range...
- Page 28 "3.9.1 Fixing Display Values (Display Hold)" (p.106) See: "3.9.2 Displaying Maximum, and Minimum Values (MAX/MIN)" (p.107) When you wish to use D/A output PW3335-02 PW3335-04 "Output voltage of level output"(p.95) See: When you wish to use the RS-232C interface "Setting the RS-232C communications speed"(p.124)
- Page 29 1.4 Measurement Workflow Start measurement. Activating power to the measurement lines Measuring and outputting data The instrument will display the measured values. You can change the voltage and current range as well as display parameters during measurement. Example: Voltage Current Active power Power factor When you wish to hold display...
- Page 30 1.4 Measurement Workflow...
-
Page 31: Chapter 2 Measurement
2.1 Installation and Connection Procedures Measurement Chapter 2 Preparations 2.1 Installation and Connection Procedures Please read "Operating Precautions" (p.5) carefully before installing or connecting the instrument. Verify that power to the measurement lines has been cut off before connecting the instrument to them. Connect the connection Install the instrument Remove the safety... -
Page 32: Connecting The Measurement Lines
2.2 Connecting the Measurement Lines 2.2 Connecting the Measurement Lines Please read "Handling the Cables" (p.7) carefully before installing, connecting the measurement lines, or connecting the instrument. Verify that power to the measurement lines has been cut off before connecting the instrument to them. -
Page 33: Connecting The Measurement Lines
(M3×6 mm) for securing the safety cover in place that shipped with the prod- uct. If you loose any screw or find that any screws are damaged, please contact your Hioki distributor for a replacement. Connect cables to the instrument’s voltage input terminals and current input terminals. - Page 34 IEC 62301:2011 (Household electrical appliance – Measurement of standby power). Calculate the instrument loss caused by the PW3335 based on the procedure described in "Example instrument loss calculation and connection method selection" (p.30) and choose the connection method that yields the least instrument loss.
- Page 35 2.2 Connecting the Measurement Lines You can connect the instrument’s current input terminals to the measurement line’s L side (Hi side) as shown in the figure below and perform measurement using either Method 1 (connect- ing the current input terminals to the load side) or Method 2 (connecting the voltage input termi- nals to the load side), but these setups are susceptible to the effects of common-mode voltage.
- Page 36 Depending on the magnitude of the input voltage and input current, instrument loss (loss caused by the input resistance of the voltage inputs and the input resistance of the current inputs) will affect measured values. Following are examples of how to calculate instrument loss for the PW3335 and an explanation of how to choose the connection method.
- Page 37 2.2 Connecting the Measurement Lines Example 2: Input voltage of 3.3 V DC, current of 28 A DC, and active power of 92.4 W DC Method 1: Since the input current is 28 A DC, the 20 A range (with an effective measurement range of 0.2 A to 30 A) will be used.
- Page 38 Connect the instrument using a VT (PT) and CT. Source Load Source Load When measuring measurement lines that exceed the maximum input current (30 A) Connect the instrument using a optional current sensor. (PW3335-03 or PW3335-04 only) Current sensor Current sensor Source Load Source Load...
-
Page 39: Connecting The Power Cord
2.3 Connecting the Power Cord 2.3 Connecting the Power Cord • Before turning the instrument on, make sure the supply voltage matches that indi- cated on the its power inlet. Connection to an improper supply voltage may damage the instrument and present an electrical hazard. Rated supply voltage: 100 V AC to 240 V AC, rated power supply frequency: 50 Hz/ 60 Hz •... -
Page 40: Turning On The Instrument
If key operation causes a message or indication that is not described in this manual to be displayed, immediately cycle the instrument’s power. Self-test (example: PW3335-03) The product model and version number are displayed. -
Page 41: Performing Zero-Adjustment
2.5 Performing Zero-adjustment 2.5 Performing Zero-adjustment Zero-adjustment (offset adjustment) is performed for voltage and current measured values after the instru- ment has warmed up for approximately 30 minutes in order to ensure that its measurement accuracy specifi- cations are satisfied. During zero-adjustment, the offsets of the instrument’s voltage and current internal circuitry are adjusted. -
Page 42: Activating Power To The Measurement Lines
2.6 Activating Power to the Measurement Lines 2.6 Activating Power to the Measurement Lines Before activating power to the measurement lines Before activating power to the measurement lines, turn on the instrument and verify that no errors are displayed. If any measurement target lines are live before the instrument is turned on, the instrument may be damaged, or an error may be displayed when it is turned on. -
Page 43: Chapter 3 Configuration And Measurement
3.1 Pre-Measurement Inspection Before using the instrument the first time, verify that it operates normally to ensure that the no damage occurred during storage or shipping. If you find any damage, contact your authorized Hioki distributor or reseller. Peripheral Device Inspection... -
Page 44: Configuring Settings
3.2 Configuring Settings 3.2 Configuring Settings 3.2.1 Selecting the Current Input Method PW3335-03 PW3335-04 This section describes how to select the current input method. The instrument can perform measurement using the current input methods listed below. The default setting is the current direct input method (setting: OFF). - Page 45 3.2 Configuring Settings Press Press to switch to the current input settings screen. ([SEnSor] will be displayed in display area Press until the display area flashes. Press to set the current input method. Default setting: OFF ⋅⋅⋅ (direct input) → →...
-
Page 46: Selecting Display Content
3.2 Configuring Settings 3.2.2 Selecting Display Content This section describes how to select the information shown on the instrument’s display. • Selecting display parameters • Selecting rectifiers (p.42) "Appendix 1 Detailed Specifications of Measurement Items (Display Items)" (p. A1) See: Default settings : Voltage (V), AC+DC : Current (A), AC+DC... - Page 47 3.2 Configuring Settings If a warning lamp or “o.r” is displayed ERROR SYNC "3.2.5 Setting the Frequency Measure- See: ment Range (Zero-cross filter)" (p.50) ERROR "3.4.4 About the HRM ERROR lamp" See: (p.77) PEAK OVER, o.r "3.10 When warning lamp, o.r, or the See: Unit Indicator Flashes"...
-
Page 48: Selecting The Rectifier
3.2 Configuring Settings Selecting the rectifier The instrument provides the five rectifiers listed below. Since data for all rectifiers is processed in parallel internally, the rectifier can be switched during measurement. Displays true RMS values for DC only, AC only, or mixed DC and AC voltage and current. Displays mean value rectified RMS equivalents for DC only, AC only, or mixed DC and AC volt- age. -
Page 49: Selecting The Voltage And Current Ranges
3.2 Configuring Settings 3.2.3 Selecting the Voltage and Current Ranges When input exceeds 1,000 V, ±1,500 V peak, or 30 A, ±100 A peak The maximum input voltage and maximum input current are 1,000 V, ±1,500 V peak, and 30 A, ±100 A peak. If the maximum input voltage or maximum input current is exceeded, immediately halt measurement, deactivate power to the measurement lines, and dis- connect the cables from the instrument. -
Page 50: Automatically Setting The Range (Auto-Range Operation)
3.2 Configuring Settings Automatically setting the range (auto-range operation) Selecting auto-range operation causes the range to be switched automatically according to the measured value. This feature is convenient when you do not know the optimal range. Setting auto-range operation "Auto-range operation" (p.45) See: Press for the voltage range or current range. - Page 51 3.2 Configuring Settings Auto-range operation During auto-range operation, the range is switched as described below: Range increased Range decreased • When the measured value exceeds When the measured value is less than 15% of the range, the 150% of the range range will be switched to the optimal range.
-
Page 52: Skipping Unnecessary Ranges (Range Select Function)
The PW3335’s range select function makes it possible to limit range switching to a smaller pool of necessary ranges by letting you enable the ranges you wish to use and disable the ranges you do not wish to use (i.e., the ranges you wish to skip). - Page 53 3.2 Configuring Settings Press until the display area flashes. Press to set ON or OFF. Default setting: ON → → ⋅⋅⋅ Settings: (The lamp for the range that was disabled will turn off.) If there are other ranges you wish to select, repeat steps through 6.
-
Page 54: Setting The Synchronization Source (Sync)
3.2 Configuring Settings 3.2.4 Setting the Synchronization Source (SYNC) This section describes how to set the synchronization source used to determine the cycle (between zero- cross events) that will be used as the basis for calculations. You can select from the following parameters: U, I, DC (fixed at 200 ms) When the synchronization source is set to I or DC, SYNC lamp will light up. - Page 55 3.2 Configuring Settings • Setting the synchronization source to DC when using AC input will cause display values to fluctuate, pre- venting accurate measurement. Set the synchronization source to a value other than DC when using AC input. • Input for the parameters selected as synchronization sources must be at least 1% of the range. •...
-
Page 56: Setting The Frequency Measurement Range (Zero-Cross Filter)
3.2 Configuring Settings 3.2.5 Setting the Frequency Measurement Range (Zero-cross filter) If the SYNC lamp (ERROR) lights up, change the zero-cross filter setting. When the synchronization source is set to voltage (U) or current (I), the SYNC lamp (ERROR) will light up if the synchronization signal cannot be acquired. - Page 57 3.2 Configuring Settings Press to switch to the zero-cross filter settings screen. ([Fr.] will be dis- played in display area Press until the display area flashes. Press to set the zero- cross filter (100 Hz/ 500 Hz/ 5 kHz/ 100 kHz). Default setting: 500 Hz →...
-
Page 58: Significance Of Changing The Zero-Cross Threshold Level
Significance of changing the zero-cross threshold level The PW3335 calculates parameters such as RMS values and active power based on one cycle of the syn- chronization source’s input waveform (voltage U or current I). This cycle is obtained by detecting the zero- cross interval (the interval from one rising edge until the next cycle’s rising edge). -
Page 59: Setting The Zero-Cross Filter's Threshold Level
3.2 Configuring Settings Setting the zero-cross filter’s threshold level Press Press to switch to the zero-cross filter’s threshold level settings screen. ([rAnGE] will be displayed in display area Press until the display area flashes. Press to display the range to set (it will flash). Press until the display area flashes. -
Page 60: Setting The Timeout
3.2 Configuring Settings 3.2.6 Setting the Timeout Accurate measurement cannot be performed when using input of a low frequency of less than 10 Hz (with a repeating period of greater than 0.1 sec.) because each input cycle will exceed the instrument’s calculation processing interval (causing a timeout). - Page 61 3.2 Configuring Settings Press to exit the settings. The instrument will return to the normal display (Mea- surement screen). • When the frequency of the input to the set synchronization source is less than 5 Hz, the data update (dis- play update) timing will vary with the frequency of the input to the synchronization source.
-
Page 62: Displaying Measured Values As An Average (Avg: Averaging)
3.2 Configuring Settings 3.2.7 Displaying Measured Values as an Average (AVG: Averaging) In averaging operation, the number of averaging iterations for measured values is set, and averaged data is displayed. Used when measured values fluctuate, causing excessive variation in the display, this setting pro- vides a way to reduce variation in display values. - Page 63 3.2 Configuring Settings Press to exit the settings. The instrument will return to the normal display (Mea- surement screen). • Averaging will restart when there is a change that affects measured values, for example in the range, number of averaging iterations, current input method, VT ratio, or CT ratio. Since no average value exists immediately after the start of averaging, the invalid data display [- - - - -] will...
-
Page 64: Setting The Vt Ratio And Ct Ratio
3.2 Configuring Settings 3.2.8 Setting the VT Ratio and CT Ratio When inputting a voltage in excess of the instrument’s maximum input voltage of 1,000 V or a current in excess of its maximum input current of 30 A, use an external VT (PT) or CT, respectively. This section describes how to set the ratio (VT ratio or CT ratio) when using an external VT or CT. -
Page 65: Setting The Vt Ratio
3.2 Configuring Settings Setting the VT ratio Press Press to switch to the VT ratio settings screen. ([vt.] will be displayed in display area Press until the digit you wish to set in display area , which will start flashing. Press to set the VT ratio. -
Page 66: Setting The Ct Ratio
3.2 Configuring Settings Setting the CT ratio Press Press to switch to the VT ratio settings screen. ([Ct.] will be displayed in display area Press until the digit you wish to set in display area , which will start flashing. Press to set the CT ratio. -
Page 67: Integration
3.3 Integration 3.3 Integration The PW3335’s integration function can operate in either of two modes: fixed-range integration mode or auto- range integration mode. Fixed-range integration mode Integration operation uses the set measurement range. (When auto-range operation is enabled, integration is fixed to the range in effect at the start of operation.) - Page 68 3.3 Integration The instrument performs integration for the current and active power in the positive direction (Ah+, Wh+), in the negative direction (Ah-, Wh-), and as sums (Ah, Wh) simultaneously and can display the integrated value for each. Integration can be started and stopped, and the integrated value can be reset, using either the instrument’s keys or the external control function.
- Page 69 3.3 Integration Displayed integrated values : Displayed − : Displays [- - - - Rectifier T.AV A T.AV W − − * * AC+DC, AC+DC Umn * During auto-range integration mode operation, triggers the invalid data ([- - - - -]) display.
-
Page 70: Starting Integration
3.3 Integration Starting integration Verify that the instrument is in the integration reset state (RUN lamps off). Press Integration will start, and the lamp will light Stopping integration Press while the lamp is lit up (indicating that the instrument is performing integration). -
Page 71: Canceling Integration (Resetting Integrated Values) (Data Reset)
3.3 Integration Canceling integration (resetting integrated values) (DATA RESET) Settings cannot be changed while integration is being performed (while the lamp is lit up or flashing). To cancel integration, use the following procedure. When integration is canceled, measurement results up to that point will be reset. - Page 72 3.3 Integration Press Press to switch to the integration intEG.t time settings screen. ([ ] will be displayed in display area Press until the digit you wish to set in display area , which will start flashing. Press to set the integra- tion time.
-
Page 73: Enabling Auto-Range Integration
3.3 Integration Enabling auto-range integration Press Press to switch to the current i.AUto input settings screen. ([ ] will be displayed in display area Press until the display area flashes. Press to set ON (enable) or OFF (disable). Default setting: OFF →... -
Page 74: Starting And Stopping Auto-Range Integration
3.3 Integration Starting and stopping auto-range integration Press when the AUTO lamp to the left of is lit up. Auto-range integration will start, and the lamp will light up. When auto-range integration starts, the current will switch to auto-range operation, and the range will vary between the 200 mA range and the 20 A range. -
Page 75: Integration Precautions
3.3 Integration Integration precautions When integration starts with the 20 A fixed range, the voltage and current auto-range setting will be can- celed, and measurement will be fixed to the range in effect when integration started. Set the range so that the PEAK OVER U (overvoltage input alarm) lamp and... -
Page 76: Integrated Value Display Format
3.3 Integration 3.3.1 Integrated Value Display Format The following tables describe the format of integrated values after they have been reset. When the number of digits in an integrated value increases, the number of digits in the format will also increase. Similarly, when the number of digits in an integrated value decreases, the number of digits in the format will also decrease. -
Page 77: Viewing Harmonic Measured Values
3.4 Viewing Harmonic Measured Values 3.4 Viewing Harmonic Measured Values The instrument displays the results of harmonic analysis for voltage, current, and active power. Since all calculation processing is performed in parallel internally, you can obtain harmonic measured values with simultaneity with other measured values simply by switching display parameters. Additionally, when the synchronization frequency is 45 Hz to 66 Hz, the instrument can perform harmonic measurement that compliant with IEC 61000-4-7:2002. - Page 78 3.4 Viewing Harmonic Measured Values The following two harmonic display methods are available: Displaying components for the same order as the display parameter (default state) Example: If [odr 1] or similar is shown in area on the display while displaying harmonics Press to light up LEVEL...
- Page 79 3.4 Viewing Harmonic Measured Values Parameters shown with normal display parameters Total harmonic voltage distortion (THD V %), total harmonic current distortion (THD A Example: THD V% Press to display THD V % THD A % in the display area. Parameters shown as fundamental wave parameters (displayed as RECTIFIER FND) Fundamental wave voltage RMS value (FND...
- Page 80 3.4 Viewing Harmonic Measured Values Parameters shown as harmonic level (LEVEL) Harmonic voltage RMS value (HRM V), harmonic current RMS value (HRM A), harmonic active power (HRM Press to light up LEVEL lamp. Press , or change the harmonic order. After pressing (1st order: fundamental wave compo- nent) →...
- Page 81 3.4 Viewing Harmonic Measured Values Parameters displayed as harmonic content percentage (HD %) Harmonic voltage content percentage (HRM V %), harmonic current content percentage (HRM A harmonic active power content percentage (HRM W Press to light up HD % lamp. Press , or change the harmonic order.
-
Page 82: Setting The Harmonic Analysis Order Upper Limit
3.4 Viewing Harmonic Measured Values 3.4.3 Setting the Harmonic Analysis Order Upper Limit The instrument allows you to set an upper limit value for the harmonic analysis order. One example of how this setting can be used is to set a limit on the uppermost order during total harmonic distortion (THD) mea- surement. -
Page 83: About The Hrm Error Lamp
3.4 Viewing Harmonic Measured Values If the upper limit does not flash Failure of the value to flash indicates that the upper limit value cannot be changed. Take the following action to address the issue: Status Solution and reference for more information The upper limit value cannot be changed until the integrated value is reset (so that During integration operation lamp turns off). -
Page 84: Performing Synchronized Measurement With Multiple Instruments
(PW3335) set up as the master (instrument setting of OUT) and thereby controlling the instrument (PW3335) set up as the slave (instrument setting of IN). The instrument (PW3335) set up as the slave will match the timing of the instrument (PW3335) set up as the master for the following operations: •... -
Page 85: Connecting 2 Instruments (Pw3335) With A Synchronization Cable
Connect the instruments’ external synchronization terminals (EXT. SYNC) with the 9165 Connection Cord. 9165 Connection Cord Turn on the two instruments (PW3335). (The order in which the instruments are turned on does not matter.) • When performing synchronized measurement with more than three instruments, connect the instrument in parallel using a BNC adaptor such as a BNC T-adaptor (jack-plug-jack). -
Page 86: Configuring Synchronized Measurement
3.5 Performing Synchronized Measurement with Multiple Instruments Configuring synchronized measurement You can set the master and slave by configuring the synchronized control input and output settings. Setting Description SYNC.OUT lamp Turns off the synchronized control function. The external synchronization terminal (EXT.SYNC) setting is [IN], but input signals (Default setting) are ignored. - Page 87 3.5 Performing Synchronized Measurement with Multiple Instruments When drawing external synchronization from two or more instruments, be sure to set only one as the power meter. Use of two or more instruments may cause damage or malfunc- tion. • When an instrument is set to oUt, the synchronization signal is output from the external synchronization terminal (EXT.SYNC) according to the internal processing timing (200 ms).
-
Page 88: External Control
3.6 External Control 3.6 External Control By connecting an external device to the instrument’s external control terminals and sending signals to the instrument from that device, the instrument can be controlled, for example to start and stop integration and reset integrated values. External control terminal (EXT.CONTROL) The external control terminals are input terminals for controlling the instrument by means of either 0/5 V logic signals or short/open contact signals. - Page 89 3.6 External Control • When integration is started with external control, it can only be stopped by external control. The integration set time is ignored. If you attempt to stop integration with , [Err.11] will be displayed. • A delay (data update interval) of up to 200 msec. will occur between input of the integration start signal and the actual start of integration.
-
Page 90: Connecting Wires To The External Control Terminals
3.6 External Control Connecting wires to the external control terminals Before connecting wires to the terminals, see "Connecting, Input and Measurement" (p.8). The external control terminals are input terminals for controlling the instrument by means of either short/open contact signals or 0/5 V logic signals. Do not input a voltage in excess of 5 V. -
Page 91: Using D/A Output
3.7 Using D/A Output PW3335-02 PW3335-04 The PW3335-02 and PW3335-04 generate voltage output in response to input from the D/A output terminals. Level (analog) output Converts the instrument’s measured values into signal levels and outputs a DC voltage. The output voltage is updated in response to display updates (data updates: approximately every 200 ms). - Page 92 3.7 Using D/A Output Output terminals and description of output Available output parameters and output voltages (DA1 to DA7) Output voltage Output parameters Voltage ( Level output Select from V), Current (A), Active power (W), 2 V (STD.2) and 5 V (STD.5). Apparent power (VA), Reactive power (var), Power factor (PF), Phase angle ( °...
-
Page 93: Connecting Wires To D/A Output Terminals
3.7 Using D/A Output Connecting wires to D/A output terminals Before connecting wires to the terminals, see "Connecting, Input and Measurement" (p.8). To avoid damaging the instrument, do not input voltage to the output terminals or short the terminals. To avoid an electrical accident, use the specified wire type. Connect wires to the terminals that you have set to output the desired parameters. -
Page 94: Level Output, High-Speed Level Output, And Waveform Output
3.7.1 Level Output, High-speed Level Output, and Waveform Output The PW3335 provides seven D/A output terminals. You can set each to a desired output parameter to gener- ate voltage output based on the output parameter input. For example, if you set the output parameter to active power (W), the terminal will output a voltage based on the active power. -
Page 95: Setting The Output Parameter, Rectifier, And Output Method For D/A Output Channels
3.7 Using D/A Output Setting the output parameter, rectifier, and output method for D/A output channels Press to place the instrument in the shift state. Press to switch to the D/A output parameter settings screen. ([ ] will be displayed in display area Press until the display area flashes. - Page 96 3.7 Using D/A Output Press until the output method flashes. Press to change the output method. The available output parameters vary with the output method and rectifier. Example: For V and AC+DC → → → → Std.2 Std.5 FASt.2 FASt.5 ⋅⋅⋅...
-
Page 97: Setting D/A Output When Enabling Auto-Range Integration
3.7 Using D/A Output Setting D/A output when enabling auto-range integration During auto-range integration mode operation, you can set the current range (200 mA to 20 A, b, totAL [total]) you wish to output for the following measurement parameters. : Current range can be set Lo.: 0 V output Rectifier Measurement items Rated output voltage... - Page 98 3.7 Using D/A Output For time average (T.AV A or T.AV W) Press until the parameter flashes. Press to select the parameter you wish to output. If you select time-average, the current range will be shown in display area d. Press until the output method flashes.
- Page 99 3.7 Using D/A Output For integrated value (Ah+, Ah-, Ah, Wh+, Wh-, or Wh) Press until the parameter flashes. Press to select the parameter you wish to output. If you select integrated value, the current range will be shown in display area d. Press until the output f.s.
-
Page 100: Example Uses
3.7 Using D/A Output Example uses D/A output can be used in combination with a data logger or recorder. For more information about the output voltage, output resistance, response time, and output update rate, see "Chapter 5 Specifications" (p.135). Example uses of level output •... -
Page 101: Output Voltage Of Level Output
3.7 Using D/A Output Output voltage of level output Voltage, current STD.2 and FASt.2 (2 Vf.s.) settings STD.5 and FASt.5 (5 Vf.s.) settings STD.2 STD.5 FAST.5 FAST.2 Active power: STD.2 and FASt.2 (2 Vf.s.) settings Active power: STD.5 and FASt.5 (5 Vf.s.) settings Apparent power, reactive power: Apparent power, reactive power: STD.2 (2 Vf.s.) settings... - Page 102 3.7 Using D/A Output Phase angle STD.2 (2 Vf.s.) settings STD.5 (5 Vf.s.) settings Voltage/ current ripple rate, total harmonic voltage/ current distortion STD.2 (2 Vf.s.) settings STD.5 (5 Vf.s.) settings Although the voltage ripple rate, current ripple rate, total harmonic voltage distortion, and total harmonic cur- rent distortion are displayed up to 500.00%, level output changes to +9 V at 450% when using the STD.2 (2 V) setting and 180% when using the STD.5 (5 V) setting, voltages in excess of that value are not output.
- Page 103 3.7 Using D/A Output Maximum Current Ratio STD.2 (2 Vf.s.) settings STD.5 (5 Vf.s.) settings Although the maximum current ratio is displayed up to 6.12 M, level output changes to +9 V at 45 when using the STD.2 (2 V) setting and 18 when using the STD.5 (5 V) setting, voltages in excess of that value are not output.
- Page 104 3.7 Using D/A Output Current integration, active power integration Fixed to STD.5 (5 Vf.s.) f.s.: 5 m/ 50 m/ 500 m/ 5/ 50/ 500/ 5 k/ 50 k/ 500 k/ 5 M/ 50 M/ 500 M/ 5000 M [Ah/ Wh] +5 V at +f.s.
-
Page 105: Output Voltage Of Waveform Output
3.7 Using D/A Output Output voltage of waveform output Input For sine wave input with an RMS value of 150 V Instantaneous voltage waveform output voltage at 50 Hz in the 150 V range Output of voltage with an RMS value of 1 V Voltage and current phase difference: 0°... -
Page 106: Using A Current Sensor
3.8 Using a Current Sensor 3.8 Using a Current Sensor PW3335-03 PW3335-04 An optional current sensor can be used to measure currents in excess of the instrument’s current effective measurement range maximum of 30 A. By setting the instrument’s CT ratio based on the rating of the current sensor being used, it is possible to read the CT’s primary-side current value directly. -
Page 107: Before Connecting A Current Sensor
3.8 Using a Current Sensor Before connecting a current sensor Please read "Operating Precautions" (p.5) carefully before connecting a current sensor to the instru- ment. When the clamp sensor is opened, do not short-circuit two wires to be measured by bringing the metal part of the clamp into contact with them, and do not use over bare conductors. -
Page 108: Connecting A Type.1 Current Sensor
3.8 Using a Current Sensor Connecting a TYPE.1 current sensor Connect the current sensor directly to one of the instrument’s external current sensor input terminal. Connect the current sensor’s BNC connector to a external current sensor input termi- nal. Align the groove on the BNC connector with the connector guides on the instru- ment and insert. - Page 109 3.8 Using a Current Sensor Verify that the instrument’s power cord as well as the power cord for the AC adapter that came with the 9555-10 are unplugged from their outlets. Verify that the instrument and 9555-10 have been turned off. Connect the AC adapter that came with the 9555-10 and then connect the power cord to the AC adapter.
-
Page 110: Setting External Current Sensor Input
3.8 Using a Current Sensor Setting external current sensor input This section describes how to set the type of current sensor being used, the instrument’s CT ratio, and the measurement range. "3.2.1 Selecting the Current Input Method" (p.38) See: "3.2.8 Setting the VT Ratio and CT Ratio" (p.58) "3.2.3 Selecting the Voltage and Current Ranges"... -
Page 111: Using An External Ct
3.8 Using a Current Sensor Using an external CT If energized components are exposed when connecting the current sensor, exercise care not to touch them or the CT. Doing so may result in electric shock, bodily injury, or a short-circuit accident. When using an external CT, avoid open-circuiting the secondary winding. -
Page 112: Other Functions
3.9 Other Functions 3.9 Other Functions 3.9.1 Fixing Display Values (Display Hold) You can hold the display of all measured values by pressing (placing the instrument in the display hold state). Activating display hold Press The display of measured values will be fixed HOLD when is pressed, and the... -
Page 113: Displaying Maximum, And Minimum Values (Max/Min)
3.9 Other Functions 3.9.2 Displaying Maximum, and Minimum Values (MAX/MIN) The instrument continuously measures instantaneous, maximum, and minimum values. The display can be switched to these values with the key. • The maximum value (including waveform peak value) for each measurement parameter is detected and held on the display. -
Page 114: Clearing Maximum And Minimum Values
3.9 Other Functions Clearing maximum and minimum values Pressing after pressing to place the instrument in the SHIFT state will clear the maximum and minimum values and restart their measurement. Maximum and minimum values are also cleared, and their measurement restarted, at the start of integration. -
Page 115: Disabling Control Keys (Key Lock)
3.9 Other Functions 3.9.3 Disabling Control Keys (Key Lock) Control keys can be disabled (by placing the instrument in the key lock state) to prevent inadvertent operation during measurement. Enabling the key lock state KEY LOCK The instrument will not accept key lock input while the lamp is lit up. -
Page 116: Initializing The Instrument (System Reset)
• Disconnect any voltage or current input from the instrument before performing the reset. • The RS-232C communications speed, GP-IB address, and LAN-related settings will not be initialized. Example: PW3335-03 Turn on the instrument. While the product model and ver-... -
Page 117: Factory Settings
AC+DC PF Voltage range 300 V range (auto-range off) Current range 20 A range (auto-range off) Synchronization source Current input Direct input (off) PW3335-03 PW3335-04 VT ratio 1 (OFF) CT ratio 1 (OFF) Frequency measurement range (zero-cross filter) 500 Hz Timeout 0.1 sec. -
Page 118: When Warning Lamp, O.r, Or The Unit Indicator Flashes
3.10 When warning lamp, o.r, or the Unit Indicator Flashes 3.10 When warning lamp, o.r, or the Unit Indicator Flashes 3.10.1If the PEAK OVER U or PEAK OVER I Lamp Lights Up These lamps will light up if the voltage input or current input waveform peak value exceeds the figures listed below. -
Page 119: When O.r (Over-Range) Is Displayed
3.10 When warning lamp, o.r, or the Unit Indicator Flashes 3.10.3 When o.r (over-range) Is Displayed This indication is displayed when the voltage or current exceeds 152% of the range. When using the voltage 1,000 V range, it is displayed when 1,060.5 V is exceeded. For active power, [o.r] is not displayed until the 231.04% of the power range is exceeded, even if the voltage or current reading is shown as [o.r]. -
Page 120: When The Unit Indicator Flashes
3.10 When warning lamp, o.r, or the Unit Indicator Flashes 3.10.4 When the Unit Indicator Flashes Status Solution The unit indicator flashes while The average value being displayed contains [o.r] data. If no [o.r] data is present during displaying the average averaging processing, the unit indicator will not flash. -
Page 121: Chapter 4 Connection To A Pc
• You can control the instrument by creating a program and connecting to its communications command port via TCP. Using the RS-232C Interface (p.123) PW3335 PW3335-02 PW3335-03 PW3335-04 • You can control the instrument using communications commands (see the Communications Command Instruction Manual). -
Page 122: Configuring And Connecting The Instrument
4.1 Configuring and Connecting the Instrument 4.1 Configuring and Connecting the Instrument 4.1.1 Using the LAN Interface You can control the instrument remotely with an Internet browser on a computer (p.130) or use command communications. Before doing so, you must configure the instrument’s LAN settings and connect it to the computer with a LAN cable. -
Page 123: Setting The Lan's Ip Address
4.1 Configuring and Connecting the Instrument Setting the LAN’s IP address Before using the LAN, set the LAN’s IP address. Press Press to switch to the LAN’s IP address settings screen. ([iP] will be displayed in display area Press until the digit you wish to set in the display area which will start flashing. -
Page 124: Setting The Lan's Subnet Mask
4.1 Configuring and Connecting the Instrument Setting the LAN’s subnet mask Before using the LAN, set the LAN’s subnet mask. Press Press to switch to the LAN’s sub- net mask settings screen. ([SUbnEt] will be displayed in display area Press until the digit you wish to set in the display area which will start flashing. -
Page 125: Setting The Lan's Default Gateway
4.1 Configuring and Connecting the Instrument Setting the LAN’s default gateway Before using the LAN, set the LAN’s default gateway. Press Press to switch to the LAN’s sub- net mask settings screen. ([GAtE] will be displayed in display area Press until the digit you wish to set in the display area which will start flashing. - Page 126 4.1 Configuring and Connecting the Instrument Displaying the LAN’s MAC address You can check the instrument’s MAC address. The MAC address cannot be changed. Press Press display address. ([MAC] will be displayed in display area Press The instrument will return to the normal display (Mea- surement screen).
-
Page 127: Connecting The Instrument To A Computer With A Lan Cable
If, after reading “Troubleshooting (Communications)” in the Communications Command instruction Manual*, you think the instrument may be broken or malfunctioning, please contact your authorized Hioki distributor or reseller. If you think the device you are attempting to connect to the instrument may be broken or malfunc- tioning, please contact that device’s manufacturer. - Page 128 4.1 Configuring and Connecting the Instrument Making Connections Between the Instrument and a PC 100BASE-TX You can monitor and control the instrument from a PC cross cable by connecting the instrument to the PC with LAN cable (100BASE-TX cable) Instrument Connection cable: Use one of the following.
-
Page 129: Using The Rs-232C Interface
4.1 Configuring and Connecting the Instrument 4.1.2 Using the RS-232C Interface PW3335 PW3335-02 PW3335-03 PW3335-04 You can use the RS-232C interface to control the instrument using command communications. Items to verify before configuring settings and connecting to the instrument • Always turn both devices OFF when connecting and disconnecting an interface con- nector. -
Page 130: Setting The Rs-232C Communications Speed
4.1 Configuring and Connecting the Instrument Setting the RS-232C communications speed Press Press to switch to the LAN’s sub- net mask settings screen. ([rS.232C] will be displayed in display area Press until the display area flashes. Press to select the com- munications speed. -
Page 131: Connecting The Rs-232C Cable
4.1 Configuring and Connecting the Instrument Connecting the RS-232C Cable Recommended cable: Model 9637 RS-232C Cable (9pin-9pin/1.8 m crossover cable) Connect the RS-232C cable to the instrument’s RS-232C connector. Be sure to secure it in place with the screws. Set the controller’s communications protocol so that it is the same as the instrument’s settings. - Page 132 Recommended cable: Model 9637 RS-232C Cable (1.8 m, 9pin-9pin, crossover cable) Crossover Wiring Socket-contact Socket-contact 9-pin D-sub 9-pin D-sub PW3335-end Computer/AT-end Pin No. Pin No. Device with D-sub 25-pin connector Use a crossover cable with a socket-contact 9-pin D-sub and a pin-contact 25-pin D-sub connector.
-
Page 133: Using The Gp-Ib Interface
4.1 Configuring and Connecting the Instrument 4.1.3 Using the GP-IB Interface PW3335-01 PW3335-04 You can use the GP-IB interface to control the instrument using command communications. Items to verify before configuring settings and connecting to the instrument • Turn off all devices before connecting or disconnecting interface connectors. Failure to do so may result in electric shock. - Page 134 4.1 Configuring and Connecting the Instrument Specifications Supports all source handshake functions. Supports all acceptor handshake functions. Supports standard talker functions.Supports serial poll functions.Talk only mode is not supported.Supports the talker cancel function by MLA (My Listen Address). Supports standard listener functions.Listener only mode is not supported.Supports the listener cancel func- tion by MTA (My Talk Address).
-
Page 135: Setting The Gp-Ib Address
4.1 Configuring and Connecting the Instrument Setting the GP-IB address Before using the GP-IB interface, you must set the GP-IB address. Press Press to switch to the GP-IB address settings screen. ([GPib.] will be displayed in display area Press until the display area flashes. -
Page 136: Operating The Instrument From A Pc's Browser (Lan Only)
4.2 Operating the Instrument from a PC's Browser (LAN only) 4.2 Operating the Instrument from a PC's Browser (LAN only) By connecting the instrument to a computer via a LAN, you can operate from the instrument using a PC Web browser such as Internet Explorer®. -
Page 137: Operating The Instrument Remotely
4.2 Operating the Instrument from a PC's Browser (LAN only) Operating the instrument remotely Selecting [Remote] on the menu displays the Remote Operation screen. The screen shown on the instrument will be shown as-is in the browser window. The buttons on the control panel correspond go the buttons on the instrument. You can also operate the instrument remotely by clicking the screen with the mouse (the same key operation as the instrument). - Page 138 4.2 Operating the Instrument from a PC's Browser (LAN only) Display parameter operation chart Voltage, current, and power parameters Measurement items Display item to click Operation Voltage Click Current Click Active power Click Apparent power Click Reactive power Click Power factor Click ○...
-
Page 139: Canceling The Remote State (Activating The Local State)
4.3 Canceling the Remote State (Activating the Local State) 4.3 Canceling the Remote State (Activating the Local State) During communications, REMOTE lamp is lit to indicate the remote control state. Control keys are disabled, with the exception of If the remote state is activated while the instrument is displaying the Settings screen, it will automatically switch to the normal display (Measurement screen). - Page 140 4.3 Canceling the Remote State (Activating the Local State)
-
Page 141: Chapter 5 Specifications
5.1 Environmental and Safety Specifications Chapter 5 Specifications 5.1 Environmental and Safety Specifications Operating environment Indoors, altitude up to 2000 m (6562 ft.), pollution degree 2 ° ° ° ° Operating temperature and C to 40 C (32 F to 104 F), 80% RH or less (no condensation) humidity °... -
Page 142: General Specifications
Single-phase 2-wire(1P2W) Input methods Voltage Isolated input, resistance voltage division method Current Isolated input, shunt input method Isolated input from external current sensors (PW3335-03 or PW3335-04 only) ± Input resistance Voltage input terminal: 2 MΩ 0.04 MΩ (50 Hz/60 Hz) Current input terminal: 1 mA to 100 mA range 500 mΩ... - Page 143 Cancelation of remote operation with LOCAL (REMOTE lamp will turn off.) RS-232C interface (included with the PW3335, PW3335-02, PW3335-03, and PW3335-04, specify at time of order) Connector D-sub 9-pin connector × 1 Communication method Full duplex, Start-stop synchronization Stop bits: 1 (fixed)
-
Page 144: Measurement Specifications
5.3 Measurement specifications 5.3 Measurement specifications Accuracy We define measurement tolerances in terms of f.s. (full scale), rdg. (reading) and dgt. (digit) values, with the following meanings: f.s. (range) This is usually the name of the currently selected range. rdg. (reading or displayed value) The value currently being measured and indicated on the measuring instrument. - Page 145 5.3 Measurement specifications Measurement accuracy For more information about the measurement accuracy for input from external current sensors, see "Measurement accuracy" (p.152). Voltage 50%f.s. ≤ Input < 100%f.s. 100%f.s. ≤ Input Frequency (f) Input < 50%f.s. ±0.1% rdg.±0.1%f.s. ±0.1% rdg.±0.1%f.s. ±0.2% rdg.
- Page 146 5.3 Measurement specifications Effective measuring range Voltage: 1% to 150% of the range (1,000 V range, up to 1,000 V) Current: 1% to 150% of the range Active power: 0% to 225% of the range (when using 1,000 V range, up to 150%) However, valid when the voltage and current fall within the effective measurement range.
- Page 147 5.3 Measurement specifications Current Measurement Specifications (I: Displayed as A on panel display) Measurement types Rectifiers: AC+DC, DC, AC, FND, AC+DC Umn Effective measuring range ±1% to ±150% of the range Display range Up to ±152% of the range. However, zero-suppression when less than ±0.5% or less than ±9 μA. Polarity Displayed when using DC rectifier Over-range display...
- Page 148 5.3 Measurement specifications Power Factor Measurement Specifications (λ: Displayed as PF on panel display) Measurement types Rectifiers: AC+DC, AC, FND, AC+DC Umn Effective measuring range As per voltage, current, and active power effective measurement ranges Display range ±0.0000 to ±1.0000 Polarity Polarity is assigned according to the lead/lag relationship of the voltage waveform rising edge and the current waveform rising edge.
- Page 149 5.3 Measurement specifications Integration Measurement Specifications Integration operation Switchable between fixed-range integration and auto-range integration. modes Fixed-range integration Integration can be performed for all voltage and current ranges. The voltage and current ranges are fixed once integration starts. Other settings continue to be in effect. The current range keys are disabled.
- Page 150 5.3 Measurement specifications Integration status display During integration operation lamp lights up (during external control operation, lamp lights up) When stopped lamp flashing (during external control operation, lamp lights up) Integrated value reset lamp off (during external control operation, lamp off) Functions Stopping integration based on integration time setting (timer) Stopping/starting integration and resetting integrated values based on external control...
- Page 151 5.3 Measurement specifications Current Waveform Peak Value Measurement Specifications (Ipk: Displayed as A pk on panel display) Measurement method Measures the current waveform’s peak value (for both positive and negative polarity) based on sampled instantaneous current values. Range configuration Current range 1 mA 2 mA 5 mA...
- Page 152 5.3 Measurement specifications Time Average Active Power Measurement Specifications (T.AV P: Displayed as T.AV W on panel display) Measurement method Calculates the average by dividing the active power integrated value by the integration time. Measurement accuracy (Active power measurement accuracy) + (±0.01% rdg. ±1 dgt.) Effective measuring range As per the active power integration effective measurement range.
- Page 153 5.3 Measurement specifications Harmonic Measurement Specifications Measurement method Zero-cross simultaneous calculation method Uniform thinning between zero-cross events after processing with a digital antialiasing filter Interpolation calculations (Lagrange interpolation) When the synchronization frequency falls within the 45 Hz to 66 Hz range IEC 61000-4-7:2002 compliant Gaps and overlaps may occur if the measurement frequency is not 50 Hz or 60 Hz.
- Page 154 5.3 Measurement specifications D/A Output Specifications (included with PW3335-02 and PW3335-04, specify at time of order) Number of output channels Configuration 16-bit D/A converter (polarity + 15 bits) Output parameters Output parameters for all channels Select from: Voltage, current, active power, apparent power, reactive power, power fac-...
- Page 155 5.3 Measurement specifications Maximum output voltage Approx. ±12 V DC Output update rate Level output (STD.2/ STD.5): Same as the data update period. Update rate is unrelated to number of averaging iterations setting and display hold op- eration. High-speed level output (FAST.2/ FAST.5): AC Updated once every cycle for the input waveform set as the synchronization source.
- Page 156 5.3 Measurement specifications External Current Sensor Input Specifications (CURRENT SENSOR) (included with PW3335-03 and PW3335-04, specify at time of order) Terminal Isolated BNC terminals Input method Isolated input from a voltage-output current sensor (instrument’s external current sen- sor input terminals are not isolated) Maximum input voltage 8 V, ±12 V peak...
- Page 157 5.3 Measurement specifications When using a current sensor with a rating of 200 A (with the CT ratio set to 40) 9272-10 (200 A): TYPE.2; 9278: TYPE.2; CT6863: TYPE.2; CT6843: TYPE.2 Voltage range Range noted Current on panel range 6.0000 V 15.000 V 30.000 V 60.000 V...
- Page 158 5.3 Measurement specifications Measurement accuracy External current sensor input instrument measurement accuracy only Voltage 50%f.s. ≤ Input < 100%f.s. 100%f.s. ≤ Input Frequency (f) Input < 50%f.s. ±0.1% rdg.±0.1%f.s. ±0.1% rdg.±0.1%f.s. ±0.2% rdg. 0.1 Hz ≤ f < 16 Hz ±0.1% rdg.±0.2%f.s.
- Page 159 5.3 Measurement specifications Temperature coefficient Voltage: ±0.03%f.s./°C or less Current, active power: ±0.08%f.s./°C or less (instrument temperature coefficient; f.s.: instrument measurement range) Add current sensor temperature coefficient to above. Effect of power factor Instrument: ±0.15%f.s. or less (45 to 66 Hz with power factor = 0) Internal circuit voltage/current phase difference: ±0.0859°...
-
Page 160: Functional Specifications
5.4 Functional Specifications 5.4 Functional Specifications Auto-range (AUTO) Functions Automatically changes the voltage and current range according to the input. Operation Pressing the AUTO key turns on the auto-range function (causing the AUTO lamp to light up). Pressing the AUTO key again turns the auto-range function off, as does press- ing any range key (causing the AUTO... - Page 161 5.4 Functional Specifications Scaling (VT, CT) Functions Applies user-defined VT and CT ratio settings to measured values. VT ratio setting range OFF (1.0) 0.001 to 0.009, 0.010 to 0.099, 0.100 to 0.999, 1.000 to 9.999, 10.00 to 99.99, 100.0 to 999.9, 1000. (setting: 0) CT ratio setting range OFF (1.0) 0.001 to 0.009, 0.010 to 0.099, 0.100 to 0.999, 1.000 to 9.999, 10.00 to 99.99,...
- Page 162 5.4 Functional Specifications Maximum value/ minimum value hold (MAX/MIN HOLD) Functions • Detects maximum and minimum measured values (except current integration, active power integration, integration elapsed time, time average current, and time average active power values) as well as maximum and minimum values for the voltage wave- form peak and current waveform peak and holds them on the display.
- Page 163 The timing of calculations; display updates; data updates; integration start, stop, and re- set events; display hold operation; key lock operation; and zero-adjustment operation for the slave PW3335, PW3335-01, PW3335-02, PW3335-03, or PW3335-04 is synchro- nized with the master PW3335, PW3335-01, PW3335-02, PW3335-03, or PW3335-04.
- Page 164 5.4 Functional Specifications Key-lock (KEY LOCK) Functions Disables key input in the measurement state, except for the KEY LOCK key. Operation Pressing the KEY LOCK key enables the key lock function (causing the KEY LOCK lamp to light up). Constraints The key lock state will be canceled when the instrument is placed in the remote state (and the REMOTE...
-
Page 165: Calculation Formulas Specifications
5.5 Calculation Formulas Specifications 5.5 Calculation Formulas Specifications Basic measurement parameter calculation formulas (1) Voltage calculation formulas Item (RECTIFIER) Calculation formulas − ∑ RMS value (AC+DC) Average value rectification π − ∑ RMS value converted value mn ... - Page 166 5.5 Calculation Formulas Specifications (2) Current calculation formulas Item (RECTIFIER) Calculation formulas M- ∑ RMS value (AC+DC) - ∑ Simple average value (DC) AC component RMS value (AC) - AC Fundamental wave component RMS from harmonic calculation formula value (FND) ...
- Page 167 5.5 Calculation Formulas Specifications (3) Power calculation formulas Item (RECTIFIER) Calculation formulas M- Active power ∑ × (AC+DC, AC+DC Umn) Active power simple average value × (DC) - Active power AC component (AC) Fundamental wave active power from harmonic calculation formula (FND) ×...
- Page 168 5.5 Calculation Formulas Specifications (4) Harmonic measurement parameter calculation formulas Item Calculation formulas Harmonic voltage + Harmonic voltage content × percentage - θU Harmonic voltage phase angle - ∑ Total harmonic voltage distortion × Harmonic current + Harmonic current content ×...
-
Page 169: Chapter 6 Maintenance And Service
The regular replacement of those parts is recommended to use the instrument properly for a long time. For the replacement of the parts, please contact your authorized Hioki distributor or reseller. The useful lives of the parts depend on the operating environment and frequency of use. -
Page 170: Troubleshooting
6.1 Troubleshooting Cleaning To clean the instrument, wipe it gently with a soft cloth moistened with water or mild detergent. IMPORTANT Never use solvents such as benzene, alcohol, acetone, ether, ketones, thinners or gasoline, as they can deform and discolor the case. Disposing of the instrument Handle and dispose of the instrument in accordance with local regulations. - Page 171 6.1 Troubleshooting If the HRM lamp (ERROR) lights up Accurate harmonic measurement cannot be performed while the lamp (ERROR) is lit up. • The lamp (ERROR) will light up when the instrument receives input outside the synchronization fre- quency range for harmonic measurement or if it is unable to perform harmonic measurement due to the effects of noise.
-
Page 172: Error Indication
Contact your authorized Hioki distributor or reseller if a repair should become necessary. Error display... - Page 173 6.2 Error Indication Error display Description Cause and Remedy This error is displayed when no external signal is received while the instrument has been set as the slave with the external syn- chronization function. Synchronization loss See: 3.5 Performing Synchronized Measurement with Multiple Instruments (p.78) This error is displayed when the voltage or current exceeds 152% of the range (or 1,060.5 V when using the 1,000 V voltage...
- Page 174 6.2 Error Indication...
-
Page 175: Appendix A1
Appendix 1 Detailed Specifications of Measurement Items (Display Items) Appendix Appendix 1 Detailed Specifications of Measure- ment Items (Display Items) Measured value display (if using communications, measured value data) : Displayed −: Not displayed Rectifier Measurement items Display range AC+DC AC+DC Up to ±152% of range. -
Page 176: Appendix 2 Detailed Specifications Of Output
Appendix 2 Detailed Specifications of Output Appendix 2 Detailed Specifications of Output Appendix 2.1 Detailed Specifications of Level Output PW3335-02 PW3335-04 : Installed − : Not installed Lo.: 0 V output Rectifier Measurement items Rated output voltage AC+DC AC+DC +Umn ... -
Page 177: Appendix 2.2 Detailed Specifications Of
Appendix 2 Detailed Specifications of Output Appendix 2.2 Detailed Specifications of High-speed Level Output PW3335-02 PW3335-04 : Installed − : Not installed Rectifier Measurement items Rated output voltage AC+DC AC+DC +Umn − − − − Voltage Relative to ±100% of the range −... -
Page 178: Appendix 3 Example Accuracy Calculations
Appendix 3 Example Accuracy Calculations Appendix 3 Example Accuracy Calculations Basic approach to accuracy When the accuracy notation combines rdg. and f.s. Accuracy specification: ±0.2% rdg. ±0.1%f.s. Measurement range: 300.00 V Measured value: 100.00 V Since the value being measured is 100.00 V; (A) Reading error (±% rdg.): ±0.2% of 100.00 V = ±0.20 V (B) Full-scale error (±%f.s.): ±0.1% of 300 V = ±0.30 V (C) Total error (A+B): ±0.50 V... -
Page 179: Appendix 4 Rack Mounting
Appendix 4 Rack Mounting Appendix 4 Rack Mounting By removing the screws on the sides, this instrument can be installed in a rack mounting plate. Observe the following precautions regarding the mounting screws to avoid instrument damage and electric shock accidents. •... - Page 180 Appendix 4 Rack Mounting Rack mounting plate (JIS, for mounting 1 instrument) Rack mounting plate (JIS, for mounting 2 instruments) Rack mounting plate (same hardware for EIA/JIS, for mounting 2 instruments)
- Page 181 Appendix 4 Rack Mounting Installation procedure Remove the feet from the bottom of the instrument, and the screws from the sides (four near the front). × 6 mm × 6 mm 1 instrument Installing the spacers on both sides of the instrument, affix the rack mounting plate (for mounting 1 instrument) with the M4 ×...
- Page 182 Appendix 4 Rack Mounting 2 instrument Attach rack mounting plates (same hardware for EIA/JIS, for mounting 2 instruments) to the inside sides of the two instruments that are to be connected together using M4 × 8 mm screws (4 locations). Connect the rack mounting plates attached in step (1) above using M3 ×...
-
Page 183: Appendix 5 Dimensional Diagram
Appendix 5 Dimensional Diagram Appendix 5 Dimensional Diagram Example: PW3335-04 (Unit: mm) -
Page 184: Appendix 6 Terminology
Appendix 6 Terminology Appendix 6 Terminology Terminology Description Crest factor, which is the ratio of the crest value (peak value) to the RMS value of the volt- age waveform or current waveform, and can be defined with the following expression. Crest factor = crest value (peak value)/RMS value Crest factor For a pure sine wave, the crest factor is 1.4142…... - Page 185 PW3335 (crest factor of 6) Since the PW3335 has a dynamic range of ±60 mA for the 10 mA range, the 10 mA range, which is the optimal range, can be used.
- Page 186 (for the PW3335, calculation of up to the 50th order depending on the input frequency) THD-F is typically used. The PW3335 displays THD-F as THD. (THD-R is not available as a measurement parameter.) The PW3335 calculates parameters such as RMS values and active power based on one cycle of the synchronization source’s input waveform (voltage U or current I).
-
Page 187: Index Index1
Index Index External current sensor input ......38 ...............42 AC+DC ............42, A 12 ............42, A 12 AC+DC Umn ..........42, A 12 FREQ ..............50 Accuracy calculations ........A 4 Frequency measurement range ......50 Additional integration ..........64 Auto-range ............44 Averaging... - Page 188 Index Maximum value ..........107 Total harmonic voltage distortion ....A 12 ..............A 11 TYPE.1 current sensors ........38 Measurement items ........... A 1 TYPE.2 current sensors ........38 Measurement workflow ........20 Minimum value ..........107 Unit indicator flashes ........
Need help?
Do you have a question about the PW3335 and is the answer not in the manual?
Questions and answers