Hioki PQ3198 Measurement Manual
Power quality analyzer
Hide thumbs
Also See for PQ3198:
- Instruction manual (304 pages) ,
- Selection manual (5 pages) ,
- Instruction manual (304 pages)
Table of Contents
Advertisement
Quick Links
PQ3198
POWER QUALITY ANALYZER
Measurement Guide
Mar. 2019 Edition1
EN
PQ3198A981-00 19-03H
Measurement
(Number indicates
reference step no.)
Procedure
1
Turn on the instrument.
Perform zero adjustment after 30-min. warm-up.
2
Load settings.
Configure initial
(Load settings file from the SD
settings.
memory card. For more information,
see the instruction manual.)
Connect the instrument to the measurement line.
3
Verify connections.
4
6
Perform simple
Configure settings as
configuration.
desired.
5
Verify settings and connections.
7
Start recording.
Stop recording.
Verify that data has been saved and analyze.
Turn off the instrument. (The instrument will be
unavailable for checking or analyzing data.)
8
Analyze data on a computer.
1
Getting
For more information, see
ready
the instruction manual.
After purchasing the instrument
(first time only)
•
Attach the Z1003 Battery Pack to the instrument.
•
Turn on the instrument and set its clock.
Preparation before measurement
-1
Perform the pre-measurement inspection.
-2
Insert an SD memory card into the instrument.
(Be sure to close the cover.)
-3
Connect the AC adapter.
-4
Connect the voltage cords and current sensors.
-5
Turn on the instrument.
4
2
3
5
Thank you for purchasing the Hioki
PQ3198 Power Quality Analyzer.
This guide introduces the basic
measurement procedure to first-
Read First
time users.
Before using the instrument, be
sure to read the instruction manual
carefully.
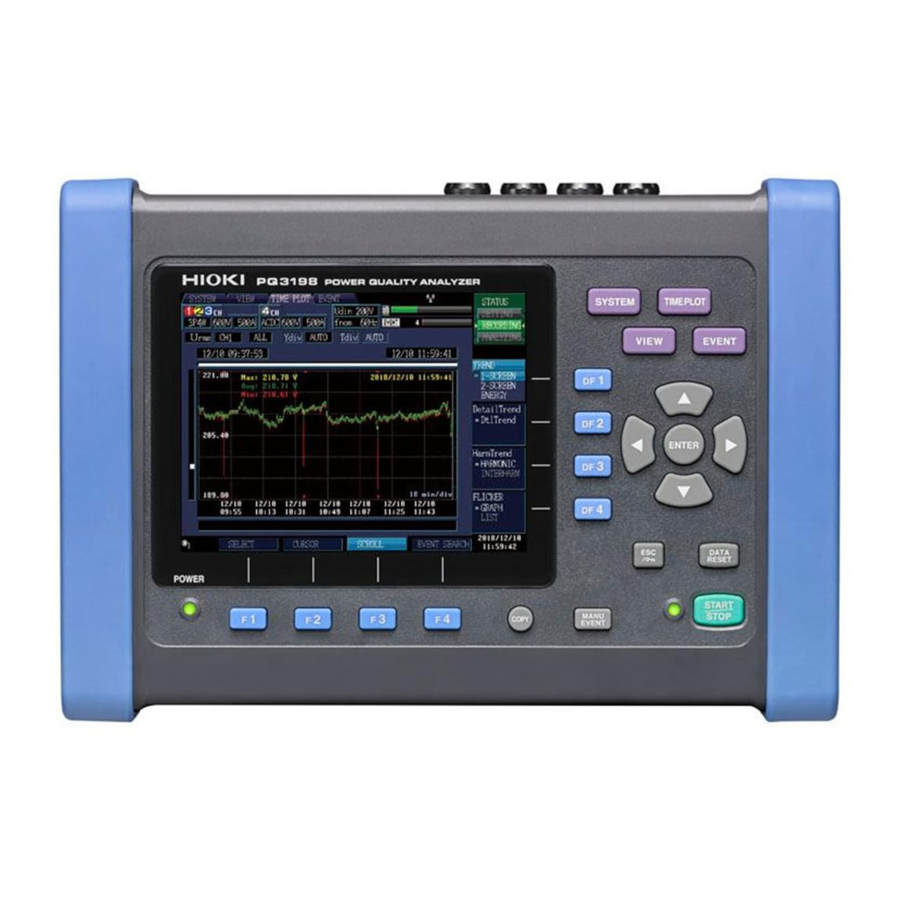
Key functions
A
B
C
E.
DATA RESET
E
D
Delete displayed measurement
F
data. (Data stored on the SD
memory card will not be deleted.)
F.
START/STOP
K
J
I
G
H
Start and stop recording.
A. Menu keys
G. START/STOP LED
SYSTEM:
Recording standby : Flashing
Configure various settings and event
thresholds.
Recording
VIEW:
Display instantaneous values and
H.
MANU EVENT
waveforms.
TIMEPLOT:
Generate events.
Display measurement data as a time
I.
COPY
key
series graph.
EVENT:
Record data on screen currently
being displayed.
Display measured events as a list.
B.
DF
keys
J.
F
keys
Select detailed screen display from each
Select and change display
content and settings.
screen.
K. POWER LED
C. Cursor key,
ENTER
key
Select and accept settings.
When using AC adapter: Steady
D.
ESC
key
When using battery
Cancel selections and changes.
2
Initial
Perform zero adjustment.
settings
Configure the connection and
current sensor settings.
1
Push
(Shown: Connection selected)
3
Select a
setting
Display
pull-down
menu
Select
Accept
4
Push
(Zero adjustment will be performed.)
3
Verify connections to the measurement line.
Connect the instrument to the measurement line, referring to the connection diagram shown on the screen.
Measured values
key
Verify that the connections are correct, referring to the vector
key
diagrams and measured values on the
If you discover an error, verify the connections and return to
step (2) to reconfigure the initial settings.
green
4
: Steady green
Simple
key
configuration
Example: Configuring settings for the
abnormal voltage detection pattern
1
Push
green
: Steady
red
3
Push (The following screen will be displayed.)
2
Push to
display
5
Push (The following screen will be displayed.)
6
[Declared input voltage]
Verify
These values will be set automatically. Change the values if they are incorrect.
7
Push (A message informing you that the simple configuration process is starting will be displayed.
Select
[Yes]
to continue with the process.)
Attach voltage cords to measurement lines
Securely clip the leads to metal parts such
Vector diagrams
as terminal screw terminals or bus bars.
(Example: Secondary side of breaker)
Applying clamp sensors to lines to be measured
Always clamp the instrument around only one conductor.
Clamping the instrument around two or more of conductors
in a bundle prevents the instrument from measuring any
current regardless of whether the measurement target is a
single-phase or three-phase circuit.
OK
Load side
Line
[Wiring]
screen.
Source
side
Settings such as the current range, nominal input voltage, measurement
frequency, and event thresholds will be automatically configured based
on the selected connection mode.
(You will need to set the measurement line type, current sensor type, and external VT/CT ratio.)
Select from the five available patterns according to your objective. To investigate the cause of a
power supply issue, select the abnormal voltage detection pattern. To investigate power supply qual-
ity (i.e., to monitor a power system), select the basic power supply quality measurement pattern.
Easy setting course patterns
Setting Contents
2
Monitors voltage factors (dips, swells, inter-
ruptions, etc.) and frequency to detect events.
Voltage event
This pattern is used to investigate the cause
detection
Push to
of equipment malfunctions. The TIMEPLOT
interval will be set to 1 minute.
display
Monitors voltage factors (dips, swells, inter-
ruptions, etc.), frequency, current, voltage and
Standard Power
current harmonics, and other characteristics
Quality
to detect events. This pattern is primarily used
to monitor systems. The TIMEPLOT interval
will be set to 10 minutes.
Measures rush current. The TIMEPLOT inter-
val will be set to 1 minute, and the rush cur-
Inrush Current
rent threshold will be set to 200% of the RMS
current (reference value) set during simple
configuration.
4
Select
Records measured values over an extended
[Easy setting
period of time using a TIMEPLOT interval of
Record measured
course]
10 minutes. All event detection functionality
value
other than manual, start, and stop events is
Display
turned off.
pull-down menu
Performs EN50160-compliant measurement.
Select
Standard-compliant evaluation and analysis
EN50160
can be performed by analyzing data using the
[Voltage event
application software PQ ONE, which is sup-
detection]
plied with the instrument.
Accept
For more information about settings, see the
instruction manual.
[Frequency]
and
Make certain that the current
flow direction arrow points
toward the load side.
Current flow direction arrow
Description
Advertisement
Table of Contents

Related Manuals for Hioki PQ3198


Summary of Contents for Hioki PQ3198
-
Page 1: Key Functions
PQ3198 Verify connections to the measurement line. Thank you for purchasing the Hioki PQ3198 Power Quality Analyzer. POWER QUALITY ANALYZER Connect the instrument to the measurement line, referring to the connection diagram shown on the screen. This guide introduces the basic... - Page 2 Press the START/STOP key to start recording. Data will be automatically saved to the SD memory card. Starting recording Verifying settings and connections -1. Are measured values or crest factors out of range? -3. Are the voltage and current phase relationships Operating mode and key operation •...
Need help?
Do you have a question about the PQ3198 and is the answer not in the manual?
Questions and answers