Hioki PQ3198 Instruction Manual
Power quality analyzer
Hide thumbs
Also See for PQ3198:
- Selection manual (5 pages) ,
- Measurement manual (2 pages) ,
- Instruction manual (304 pages)
Table of Contents
Advertisement
Quick Links
PQ3198
POWER QUALITY ANALYZER
Be sure to read this manual before using the instrument.
When using the instrument for the
first time
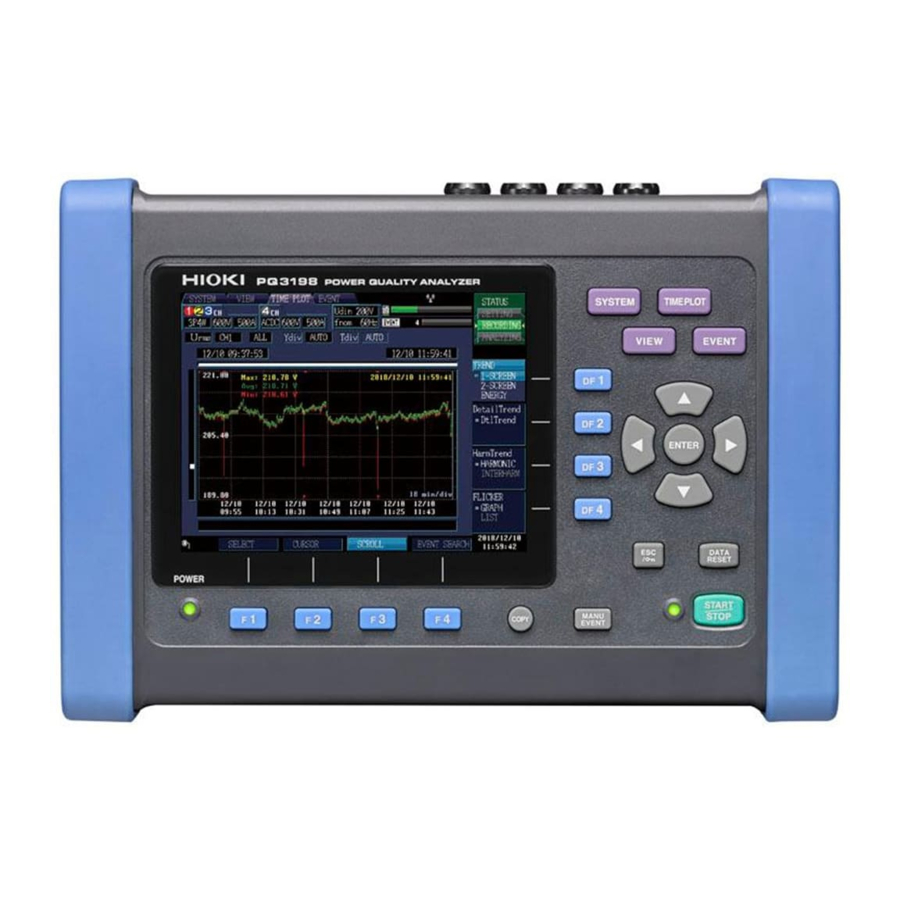
Names and Functions of Parts
Basic Operations
Measurement Preparations
Jan. 2021 Revised edition 2
PQ3198A961-02 21-01H
Troubleshooting
p.23
Maintenance and Service
p.27
Error Indication
p.37
HIOKI PQ3198A961-02
Instruction Manual
p.6
p.249
p.253
EN
Advertisement
Table of Contents

Related Manuals for Hioki PQ3198


Summary of Contents for Hioki PQ3198
- Page 1 PQ3198 Instruction Manual POWER QUALITY ANALYZER Be sure to read this manual before using the instrument. p.6 When using the instrument for the Troubleshooting first time Names and Functions of Parts p.23 Maintenance and Service p.249 Basic Operations p.27...
- Page 2 HIOKI PQ3198A961-02...
-
Page 3: Table Of Contents
Attaching the Z5020 Magnetic Strap ... 40 Installing the battery pack ....41 Changing Measurement Conditions. 71 Pre-Operation Inspection ....42 Changing the Recording Settings ..75 Connecting the AC Adapter .... 43 Changing the Measurement Period 78 PQ3198A961-02 HIOKI PQ3198A961-02... - Page 4 Displaying an IEC flicker fluctuation 10.2 Installation ........170 graph..........131 Installation procedure......171 Displaying an IEC flicker list....134 Displaying a ΔV10 flicker fluctuation graph..........135 Displaying a ΔV10 flicker list ..... 138 HIOKI PQ3198A961-02...
- Page 5 13.3 Screen Specifications ....214 13.4 Event Specifications ...... 226 13.5 GPS Time Synchronization Function .......... 227 13.6 Interface Specification ....228 13.7 Other Functions ......230 13.8 Calculation Formula ...... 231 13.9 Range Breakdown and Combination Accuracy ....244 HIOKI PQ3198A961-02...
- Page 6 Contents HIOKI PQ3198A961-02...
-
Page 7: Introduction
Introduction Introduction Thank you for purchasing the Hioki PQ3198 Power Quality Analyzer. To obtain maximum perfor- mance from the instrument over the long term, be sure to read this manual carefully and keep it handy for future reference. Be sure to also read the separate document “Operating Precautions” before use. - Page 8 Indicates the Waste Electrical and Electronic Equipment Directive (WEEE Directive) in EU member states. This is a recycle mark established under the Resource Recycling Promotion Law (only for Japan). Ni-MH Indicates that the product conforms to regulations set out by the EU Directive. HIOKI PQ3198A961-02...
- Page 9 The value currently being measured and indicated on the measuring in- (reading or displayed strument. value): The smallest displayable unit on a digital measuring instrument, i.e., the dgt. input value that causes the digital display to show a "1" as the least-signif- (resolution): icant digit. HIOKI PQ3198A961-02...
-
Page 10: Confirming Package Contents
When you receive the instrument, inspect it carefully to ensure that no damage occurred during shipping. In particular, check the accessories, panel switches, and connectors. If damage is evi- dent, or if it fails to operate according to the specifications, contact your authorized Hioki distrib- utor or reseller. - Page 11 Confirming Package Contents Options The following options are available for the instrument. Contact your authorized Hioki distributor or reseller when ordering. The options are subject to change. Visit our website for updated information. Voltage measurement Power supply L9243 Grabber Clip ...
-
Page 12: Safety Notes
CAT IV: When measuring the circuit from the service drop to the service entrance, and to the power meter and primary overcurrent protection device (distribution panel). HIOKI PQ3198A961-02... -
Page 13: Usage Notes
• Before using the instrument, check it and verify that it operates properly to make sure that it suffered no damage during storage or transportation. If you find any damage or failure, contact your authorized Hioki distributor or reseller. Instrument Installation Installing the instrument in inappropriate locations may cause a malfunction of instrument or may give rise to an accident. - Page 14 • If the instrument exhibits abnormal operation or display during use, review the infor- mation in "14.2 Trouble Shooting" (p.250) and "14.3 Error Indication" (p.253) before contacting your authorized Hioki distributor or reseller. • To avoid damage to the instrument, protect it from physical shock when transporting and handling.
- Page 15 • Keep the clamp closed when not in use, to avoid accumulating dust or dirt on the fac- ing core surfaces, which could interfere with clamp performance. Important Use only the Hioki specified voltage cords and input cables. Using a non-specified cable may result in incorrect measurements due to poor connection or other reasons. HIOKI PQ3198A961-02...
- Page 16 Failure to do so could result in equipment malfunction or damage. • After connecting the communications cable, tighten the screws on the connector securely. Failure to secure the connector could result in equipment malfunction or damage. HIOKI PQ3198A961-02...
- Page 17 About the battery pack • For battery operation, use only the Hioki Model Z1003 Battery Pack. We do not take any responsibility for accidents or damage related to the use of any other batteries.
- Page 18 Contact your authorized Hioki distributor or reseller as soon as possible. Continuing to use the instrument may result in fire or electric shock.
- Page 19 • Keep discs inside a protective case and do not expose to direct sunlight, high temperature, or high humidity. • Hioki is not liable for any issues your computer system experiences in the course of using this disc. Using the Magnetic Adapter and Magnetic Strap Persons wearing electronic medical devices such as a pacemaker should not use magnetic adapter and magnetic strap.
- Page 20 Usage Notes HIOKI PQ3198A961-02...
-
Page 21: Chapter 1 Overview
By measuring power supply quality parameters, you can assess the power supply's quality and identify the causes of various power supply malfunctions. The PQ3198's ability to measure all power supply quality parameters simultaneously makes this process a quick and simple one. - Page 22 • Outlets and other points of power supply for electric and electronic equipment What is the expected cause? • Voltage abnormalities (RMS value fluctuations, waveform distortion, transient voltages, high-order har- monics [noise at frequencies of several kHz and above]) • Current abnormalities (leak current, inrush current) HIOKI PQ3198A961-02...
- Page 23 • Continue recording for the necessary period, check the state of the power supply malfunction based on the detected events, and take corrective action as appropriate. (The PQ3198 can be used not only for the investigation phase, but also to verify the effectiveness of corrective action taken.)
- Page 24 By understanding the precise times at which abnormalities (events) start and stop, you can more easily identify problematic equipment and locations. Check for heat and unusual sounds. Motors, transformers, and wiring may produce heat or unusual sounds due to causes such as overload- ing or harmonics. HIOKI PQ3198A961-02...
-
Page 25: Product Overview
1.2 Product Overview 1.2 Product Overview The PQ3198 Power Quality Analyzer is an analytical instrument for monitoring and recording power supply anomalies, allowing their causes to be quickly investigated. The instrument can also be used to assess power supply problems (voltage drops, flicker, harmonics, etc.). -
Page 26: Features
SD memory card data storage Easy downloading of data to a computer via USB or LAN By allowing the PQ3198 to record data continuously for up to one year, the ability to use high-capacity up Included software simplifies analysis. to 8 GB memory cards inspires peace of mind. -
Page 27: Measurement Flowchart
Disconnect the voltage cords and current sensors from the measurement line and turn off the instrument. 3.8 (p.48) (The display data will be erased. It cannot be redisplayed.) Analyze the data on a computer using the computer application. Chapter 12 (p.177) HIOKI PQ3198A961-02... -
Page 28: Start And Stop Recording
Relationship between the operation status and key operations [Setting] [Recording] [Analyzing] Start Stop recording recording Revert to [Setting] mode Do not remove the SD memory card while recording or analyzing data. Doing so may cause data on the card to be corrupted. HIOKI PQ3198A961-02... -
Page 29: Chapter 2 Names And Functions Of Parts Basic Operations & Screens
Flashing green strument. See:"2.2 Basic Operations" (p.27) Normal operation: Solid green When recording: When using battery pack: Solid red Solid green See: "3.8 Turning the Power On and Off (Set- ting the Default Language)" (p.48) HIOKI PQ3198A961-02... - Page 30 Starts and stops recording. To resume re- currently displayed ating recording of mea- cording, press the DATA RESET key to re- screen to the SD memo- sured values and event set the data followed by the START/STOP ry card. waveforms. key. HIOKI PQ3198A961-02...
- Page 31 Connect a GPS box using an RS-232C Insert an SD memory card here. Be sure to close cable. the cover when recording. See: (p.43) LAN interface Connect a computer here using the optional 9642 LAN Cable. See: (p.182) HIOKI PQ3198A961-02...
- Page 32 (from the left) indicate the year of manufacture, and the next two indicate the month of manufacture. Required for production control. Do not peel off the label. Battery compartment Install the included Model Z1003 Battery Pack. See: (p.41) HIOKI PQ3198A961-02...
-
Page 33: Basic Operations
Mea- Press the COPY key. Data will be saved to the SD sured values and event waveforms card. at that time will be recorded. See: "9.5 Saving, Displaying, and Deleting Screen Copies" See: "Manual Events" (p.11) (p.166) HIOKI PQ3198A961-02... -
Page 34: Display Items And Screen Types
[Waiting] is also displayed Once the memory is full, no additional data can be when recording is stopped. recorded. Lights up when data is being recorded. Lights up when the instrument is in [Analyzing] mode after recording stops. HIOKI PQ3198A961-02... - Page 35 Setting the Clock See: : (p.82) No event has been detected. (White) No. of events recorded Event indicator (Max. 9999 *) Full bar indicates 9999 * events. * : When the Max. Recordable events is set to 9999 HIOKI PQ3198A961-02...
-
Page 36: Warning Indicators
VT (PT) and CT have been set. *: The nominal input voltage (Udin), which is calculated from the nominal supply voltage using the trans- former ratio, indicates the voltage that is actually input to the instrument. HIOKI PQ3198A961-02... -
Page 37: Screen Types
Configures the recording, TIME Items, TIME PLOT interval, PLOT interval settings. real-time control, and re- See: 5.2 (p.75) peated recording settings. See: 5.2 (p.75) to 5.3 (p.78) Time See: Configures the real-time control, repeated record- ing settings.5.3 (p.78) HIOKI PQ3198A961-02... - Page 38 Displays a list of screenshot Delete data. List Load* Displays a list of the files Delete stored on the SD memory card. Format *The List's F1 (Load) will appear when the cursor is in the stored data folder. (********). HIOKI PQ3198A961-02...
- Page 39 1 to 4 as a graph. See: 6.4 (p.103) List Displays the sum voltage, current, power measured values (or- ders 0 to 50) for channels 1 to 4 as a graph. See: 6.4 (p.103) HIOKI PQ3198A961-02...
- Page 40 (0.5 s before and 29.5 s after EVENT IN) (for 400 Hz mea- surement, approx. 0.125 s before and approx. 7.375 s after EVENT IN). See: 8.6 (p.153) HIOKI PQ3198A961-02...
- Page 41 Can display 6 orders of inter-harmonics. Displays the average value or the maximum, minimum, and average values during the TIME PLOT interval as a time series. (You can select voltage or current to be displayed.) : Inter-harmonics are displayed when [Recording Items] is set [All data]. HIOKI PQ3198A961-02...
- Page 42 You can also an- alyze instantaneous values, waveforms, and other information at the time of the event's occurrence on the [VIEW] screen. HIOKI PQ3198A961-02...
-
Page 43: Chapter 3 Measurement Preparations
30 minutes before performing zero adjustment or making measurements. Set the clock. (p.82) Set the connection mode. (p.53) Verify that the connections have been made properly. (p.64) Perform quick setup. (p.66) HIOKI PQ3198A961-02... -
Page 44: Initial Instrument Preparations
Measuring object (Colors of the CH and colored clips) Single-phase 2-wire (1P2W) 1 (CH1 red) Single-phase 3-wire (1P3W) 2 (CH1 red, CH2 yellow) 3-phase 3-wire (3P3W2M) 3-phase 3-wire (3P3W3M) 3 (CH1 red, CH2 yellow, CH3 blue) 3-phase 4-wire (3P4W) HIOKI PQ3198A961-02... -
Page 45: Bundle The Voltage Cord Leads With The Spiral Tubes
Wind the spiral tube around the leads. Wrap the two leads together with the spiral tube. The five spiral tubes should be ap- plied with suitable spacing. Attach alligator clips that are Spiral tube the same color as the cords. Colored Black HIOKI PQ3198A961-02... -
Page 46: Attaching The Strap
Put the strap through buckle. the strap loop of the instrument. The magnetic force varies depending on thickness and unevenness of steel panels. Check for lack of the magnetic force so as not to let the instrument slip down. HIOKI PQ3198A961-02... -
Page 47: Installing The Battery Pack
Remove the labeling on the battery pack. the cover. Exercise care not to pinch the battery pack wires between the batter pack and the instrument. Reattach the battery pack cover to the instrument and tighten the screws securely. HIOKI PQ3198A961-02... -
Page 48: Pre-Operation Inspection
3.3 Pre-Operation Inspection 3.3 Pre-Operation Inspection Before using the instrument the first time, verify that it operates normally to ensure that the no damage occurred during storage or shipping. If you find any damage, contact your dealer or Hioki representative. Metal exposed... -
Page 49: Connecting The Ac Adapter
AC adapter. 3.5 Inserting (Removing) an SD Memory Card Important • Use only HIOKI-approved SD memory cards (model Z4001, etc). Proper operation is not guar- anteed if other cards are used. • Format new SD memory cards before use. - Page 50 See: "5.2 Changing the Recording Settings" (p.75) ▲Arrow Insert the card horizontally. Inserting the SD memory card at an angle may cause the writeprotect lock to engage, preventing data from being written to the card. HIOKI PQ3198A961-02...
-
Page 51: Connecting The Voltage Cords
Connection Procedure Plug the voltage cables into the appropri- ate channels' voltage measurement jacks. Insert the plugs into the jacks as far as they will go. HIOKI PQ3198A961-02... -
Page 52: Connecting The Current Sensors
Align the arrow with the concave part of the terminal to insert the connector. When disconnecting the current sensor, be sure to grip the part of the connector indicated by the arrows and pull it straight out. Current input terminal HIOKI PQ3198A961-02... - Page 53 To measure voltage and current beyond the range of the instrument or current sensor Use an external VT (PT) or CT. By specifying the VT or CT winding ratio on the instrument, the input level at the primary side can be read directly. See: "4.7 Quick setup" (p.66) HIOKI PQ3198A961-02...
-
Page 54: Turning The Power On And Off (Setting The Default Language)
2. Disconnect the power cord, voltage cords, and current sensors from the instrument. 3. Contact your authorized Hioki distributor or reseller. For best precision, allow at least 30 minutes warm-up before executing zero adjustment and measuring. Turning the power off... - Page 55 Turkish Polish Polish • This default language setting is retained even if the system is reset (p.92). • The language is not retained when the instrument is reset to its factory settings with a boot key reset (p.92). HIOKI PQ3198A961-02...
- Page 56 3.8 Turning the Power On and Off (Setting the Default Language) HIOKI PQ3198A961-02...
-
Page 57: Chapter 4 Configuring The
4.1 Warm-up and Zero-adjust Operation Warm-up It is necessary to allow the PQ3198 to warm up to ensure its ability to make precise measurements. Allow the instrument to warm up for at least 30 minutes after turning it on. (p.48) Zero Adjustment This function adjusts the DC components superimposing on voltage and current to zero. -
Page 58: Setting The Clock
4.2 Setting the Clock 4.2 Setting the Clock This section describes how to set the PQ3198's clock. It is recommended to check the clock before starting recording. [SYSTEM] screen [Main] [Hardware] Move Select value to change Set value Accept setting... -
Page 59: Configuring The Connection Mode And Current Sensors
Select the connection mode Accept setting Cancel Accepting the settings will cause a connection diagram for the selected connection mode to be displayed. Accepting the selection displays the wiring diagram of the selected wiring mode. (p.55) HIOKI PQ3198A961-02... - Page 60 These sensors will need to be manually configured. To measure multiphase power, use the same type of current sensor on each phase line. For example, to measure 3-phase 4-wire power, use the same model current sen- sors on channels 1 to 3. HIOKI PQ3198A961-02...
-
Page 61: Connection Diagram
1P3W The vector diagram shows the measure- ment line in its ideal (balanced) state. The L1021-01, L1021-02 Patch Cord can be used to consolidate two cords being connected to the same phase into a single cord. HIOKI PQ3198A961-02... - Page 62 3P3W3M The vector diagram shows the measure- ment line in its ideal (balanced) state. The L1021-01, L1021-02 Patch Cord can be used to consolidate two cords being connected to the same phase into a single cord. HIOKI PQ3198A961-02...
- Page 63 3P4W2.5E (CH4:ACDC) The vector diagram shows the measure- ment line in its ideal (balanced) state. The L1021-01, L1021-02 Patch Cord can be used to consolidate two cords being connected to the same phase into a single cord. HIOKI PQ3198A961-02...
- Page 64 4.3 Configuring the Connection Mode and Current Sensors (2) Measuring multiple systems Used for a separate system Two circuits (3) Measuring a system and a DC power supply ±24 V, ±15 V, ±5V, etc. Used for a separate system power supply HIOKI PQ3198A961-02...
-
Page 65: Setting The Vector Area (Tolerance Level)
CH1 for current. Setting Contents:( ∗ : Default setting) ∗ ±1 ±30 (%) (±20 U/I phase difference Sets the tolerance level for the current phase difference relative to the voltage. Setting Contents:( ∗ : Default setting) ∗ +60 (°) (0 HIOKI PQ3198A961-02... -
Page 66: Connecting To The Lines To Be Measured (Preparing For Current Measurement)
L1,L2, and L3 or U,V, and W, as appropriate. Changing the phase names [SYSTEM] screen [Wiring] [Phase name] Display the pull-down menu Select the connection mode Accept setting Cancel Accepting the settings will cause the selected phase names to be shown on the connection diagram. (p.55) HIOKI PQ3198A961-02... - Page 67 Adapter. In this case, connect each cords so that it is hang- ing off the adapter in a manner that balances its weight. Check the voltage values to verify that the connections have been made securely. Model 9804-01, 9804-02 Magnetic Adapter Model L1000 Voltage Cord Secondary side of breaker HIOKI PQ3198A961-02...
- Page 68 Load side Line Source side Make certain that the current flow direction arrow points toward the load. Current flow direction arrow HIOKI PQ3198A961-02...
- Page 69 (steel). In particular, Model Z5004 can prevent the own weight of the voltage cords from detaching those alligator clips or magnet adapters. How to attach the strap "Attaching the Z5020 Magnetic Strap" (p.40) HIOKI PQ3198A961-02...
-
Page 70: Verifying Correct Wiring (Connection Check)
• Are the current sensors securely plugged into the current measurement jacks on the instrument? (p.46) • Are the current sensors properly attached to the lines? (p.62) • Are the current sensors appropriate for the line current to be measured? • Is the sensor range set correctly? HIOKI PQ3198A961-02... - Page 71 • Check that the voltage measurement clips are attached to the lines If vector direction (phase) or col- according to the wiring diagram. or is incorrect. Current vectors: • Check that the current sensors are attached to the lines according to the wiring diagram. HIOKI PQ3198A961-02...
-
Page 72: Quick Setup
What settings are affected by quick setup? For accurate measurements, settings such as range must be properly configured. When you use quick setup, the following settings are automatically configured using HIOKI-rec- ommended values according to the selected connection settings: current range, nominal input voltage, measurement frequency, event thresholds, etc. - Page 73 The 150 (50 Hz) and 180 (60 Hz) cycle settings provide the TIME PLOT intervals required for IEC61000-4-30-compliant measurement. When using a measurement fre- quency of 400 Hz, selecting 150/180 cycle will result in a 1200 cycle interval. HIOKI PQ3198A961-02...
- Page 74 Do not change the interval time, event threshold, or other settings once they have been configured. Doing so will prevent measurement in compliance with EN51060. Easy settings course details (settings) For more information about the easy settings course, see "(7) Easy settings" (p.219). HIOKI PQ3198A961-02...
-
Page 75: Verifying Settings And Starting Recording
No problem Check the clock Problem Change settings [SYSTEM] Change the settings on the screen. See: "4.2Setting the Clock" (p.52) No problem Start recording. See: "Start and Stop Recording" (p.22) HIOKI PQ3198A961-02... -
Page 76: Using The Instrument During A Power Outage
However, the instrument will turn off about 180 minutes after the outage occurs. Once the power is back on, the instrument will turn back on and resume recording. Integral values and other data will be reset, and the integration process will resume. HIOKI PQ3198A961-02... -
Page 77: Chapter 5 Changing Settings (As Necessary)
∗ CH4: AC+DC /DC/OFF Declared input voltage Selects the nominal input voltage (Udin) for the measurement line. Setting Contents:( ∗ : Default setting) ∗ 100/101/110/120/127/200/202/208/220/230 /240/277/347/380/400/415/480/ 600/VARIABLE (set from 50 V to 780 V in 1 V increments) HIOKI PQ3198A961-02... - Page 78 Set if using an external CT. Setting Contents:( ∗ : Default setting) ∗ /40/60/80/120/160/200/240/300/400/600/800/1200/ VARIABLE (0.01 to 9999.99) Frequency Selects the nominal frequency (fnom) for the measurement line. Setting Contents:( ∗ : Default setting) ∗ 50 Hz /60 Hz/400 Hz HIOKI PQ3198A961-02...
- Page 79 Setting Contents:( ∗ : Default setting) ∗ THD-F / THD-R Harm Calc Selects the harmonic calculation method. Setting Contents:( ∗ : Default setting) ∗ U, I, P: All Levels /U, I, P: All % of FND/U, P: %, I: Level HIOKI PQ3198A961-02...
- Page 80 Pst, Plt /ΔV10 Filter Sets the lamp system when Pst, Plt are selected for flicker measurement. ΔV10 This setting is not available when is selected for the flicker setting. Setting Contents:( ∗ : Default setting) ∗ 230V /120V HIOKI PQ3198A961-02...
-
Page 81: Changing The Recording Settings
SD card remaining capacity. The actual number of days of data that can be saved may be less than the indicated amount depend- ing on the number of screen copies made and events generated. HIOKI PQ3198A961-02... - Page 82 High-order harmonic current component Voltage K factor unbalance factor Current Flicker unbalance factor (ΔV10/ Pst, Plt) Detailed trend graphs are always displayed with maximum and minimum values. HIOKI PQ3198A961-02...
- Page 83 50 Hz), 180 cycles (60 Hz), or 1200 cycles (400 Hz). When the memory is full The PQ3198 stops recording data to the SD memory card. Recording times (reference value) for a Z4001 SD Memory Card 2 GB...
-
Page 84: Changing The Measurement Period
The recording will start at “10:50:00.” If the set recording interval is of 30 s or less, recording will start from the next zero second. Stop operation is the same as with the [Manual] setting. HIOKI PQ3198A961-02... - Page 85 Start date and stop date Start time and stop time Set- ting — — — Any value 1 Week — — from 1 to 55 Any value 1 Day — Start time and stop time from 1 to 366 HIOKI PQ3198A961-02...
- Page 86 • In the event of a power outage (interruption of power to the instrument), the folder will be segmented. • Once the data storage files exceed about 100 MB, data will be segmented, regard- less of the repeat count. HIOKI PQ3198A961-02...
-
Page 87: Changing Hardware Settings
Select the setting/ change the value Accept setting Cancel Language Sets the display language. Setting Contents: Japanese Japanese English English Chinese Simplified Chinese Trad Traditional Chinese Korean Korean German German French French Italian Italian Spanish Spanish Turkish Turkish Polish Polish HIOKI PQ3198A961-02... - Page 88 Valid setting range: 00:00 on January 1, 2010 to 23:59 on December 31, 2079. External output Set when using the external control terminal to connect the PQ3198 to an external device. Setting Contents:( ∗ : Default setting) Disables external output.
- Page 89 Use as an event trigger. START/STOP Use to start and stop recording. RS-232C connection Set when connecting the PQ3198 to Model PW9005 GPS Box with an RS-232C cable. Setting Contents:( ∗ : Default setting) ∗ Disables the RS connection. Outputs data to a Model PW9005 GPS Box. If select- ing this setting, select the time zone.
-
Page 90: Changing Lan Settings
1]. If [Current sensor] is selected, [LAN] will be displayed for F4. Set when connecting the PQ3198 to a computer with a LAN cable. See:"Configure the Instruments LAN Settings" (p.180) Setting Contents: Sets the IP address. (3 characters.3 characters.3 IP Address characters.3 characters (***.***.***.***)) -
Page 91: Changing Event Settings
Specify the 0th order level as an absolute 0 to 50 (OFF) percentage value. Orders Level/content (1,2,3)(sum) 1.3 × (0 to [varies with range]) W 1,2,3,4, Harmonic power 0 to 50 percentage (OFF) Specify as absolute value. /0% to 100% 5,6,8 HIOKI PQ3198A961-02... - Page 92 Note 8: The sum value threshold is 2 times for 1P3W, 3P3W2M, and 3P3W3M, and 3 times for all others. Note 9: The setting precision for thresholds is ±1 dgt. Note 10: Sets the threshold values as percentages of nominal voltage (Uref)*. HIOKI PQ3198A961-02...
- Page 93 To turn voltage/current/power events on or off, or to adjust associated thresholds (p.88). To turn harmonic events on or off, or to adjust associated thresholds (p.89). To generate an event using an external input signal (p.90). To generate an event manually (p.90). To periodically generate an event (p.91). HIOKI PQ3198A961-02...
- Page 94 [9999] comparison events. If an event occurs for 5 min. or more at a frequency of 3 times per second or greater while [Max. recordable events] is set to [9999] , the resulting event data may be incomplete. HIOKI PQ3198A961-02...
- Page 95 Set thresholds are stored internally regardless of the event’s ON/OFF setting. Even if a threshold is set, no events will be generated unless the event is set to ON. When the measurement frequency (fnom) is 400 Hz, measurement is limited to the 10th order. HIOKI PQ3198A961-02...
- Page 96 (manual event) key is pressed. The voltage and current waveforms and measured values when the external event occurs can be recorded. Manual events are always enabled. See: More about how to record event waveforms: "Appendix 4 Recording TIME PLOT Data and Event Waveforms" (p.A12) HIOKI PQ3198A961-02...
- Page 97 Continuous event generation will stop as soon as the measurement is finished. Used to observe the instance when the event is generated and the changes in the instantaneous wave- forms after that. In the case of this instrument, waveforms of up to one second are recorded. HIOKI PQ3198A961-02...
-
Page 98: Initializing The Instrument (System Reset)
"5.8 Factory Settings" (p.93) Reverting the instrument to its factory settings (boot key reset) You can revert all settings, including language and communications settings, to their default values by turning on the instrument while holding down the ENTER keys. HIOKI PQ3198A961-02... -
Page 99: Factory Settings
Set language LCD Backlight Display color Color 1 External output Short pulse Beep sound External control (IN) Event RS-232C connection Vector area settings Setting Default value Setting Default value Phase area ±30 U/I phase difference Amplitude area ±20 HIOKI PQ3198A961-02... - Page 100 5.8 Factory Settings HIOKI PQ3198A961-02...
-
Page 101: Chapter 6 Monitoring Instantaneous Values (View Screen)
This screen is shown when an event is selected on [EVENT] screen in [Analyzing] mode. As shown in the screenshot to the right, the event num- ber, time and date, and type are displayed. See:"8.3 Analyzing the Measurement Line Status When Events Occur" (p.145) HIOKI PQ3198A961-02... -
Page 102: Displaying Instantaneous Waveforms
To scroll through the wave- scroll waveform form (p.99) The instantaneous waveform displays the wave- data (p.99) form sampled at 20 kHz. (Measured values are To hold the display (p.99) calculated using waveforms sampled at a differ- ent frequency for each parameter.) HIOKI PQ3198A961-02... - Page 103 To enlarge the graph, increase the scale. Setting Contents:( ∗ : Default setting) ∗ 5ms/div , 10ms/div, 20ms/div, 40ms/div The scale can also be changed without using the pull-down menu by pressing the up and down cursor keys. HIOKI PQ3198A961-02...
- Page 104 Cursor color Red: CH1 Yellow: CH2 Blue: CH3 Cursor White: CH4 Scroll bar You can read waveform instantaneous values with the cursor. Normally, the cursor is located at the begin- ning of the waveform. HIOKI PQ3198A961-02...
- Page 105 If you select an event and display a waveform, you can scroll horizontally to analyze 14 waveforms at 50 Hz, 16 waveforms at 60 Hz, or 112 waveforms at 400 Hz. Holding the display [Hold] (Measured values and waveforms will be held.) HIOKI PQ3198A961-02...
-
Page 106: Displaying Phase Relationships ([Vector] Screen)
To change the harmonic number of orders (p.102) To hold the display (p.108) Changing the axis display, RMS value/phase angle display, and phase angle value display Select a setting Display the pull-down menu Select a setting Accept setting Cancel HIOKI PQ3198A961-02... - Page 107 ∗ Uses U1 as the reference source. Uses I1 as the reference source. Uses U2 as the reference source. Uses I2 as the reference source. Uses U3 as the reference source. Uses I3 as the reference source. HIOKI PQ3198A961-02...
- Page 108 Change the number of order (Up to the 50th order can be set) Accept setting Cancel The harmonic number of orders can also be changed without using the pull-down menu by pressing the up and down cursor keys. HIOKI PQ3198A961-02...
-
Page 109: Displaying Harmonics
Select with the key. To change the display channel (p.104). To change the axis display (p.104). To change the RMS value/phase angle display (p.104). To display inter-harmonics (p.105). To change the display order (p.105). To hold the display (p.108). HIOKI PQ3198A961-02... - Page 110 Setting Contents:( ∗ : Default setting) ∗ Level Phase Phase angle Content Content percentage In the level display, the high-order harmonic component bar graph and measured value (harmH) are dis- played next to the U and I bar graphs. HIOKI PQ3198A961-02...
- Page 111 You can also change the displayed order without displaying the pull-down menu by using the up and down cursor keys. [Harmonic Order] Display the pull-down menu Change the number of order (Selectable settings: THD, 0th order through 50th order) Accept setting Cancel HIOKI PQ3198A961-02...
-
Page 112: Displaying Harmonics As A List
When the 400 Hz measurement frequency is selected, harmonic analysis is performed up to the 10th order, and inter-harmonic analysis is not available. Changing the display channels, items, RMS value, phase angle, inter- harmonics Select a setting Display the pull-down menu Select a setting Accept setting Cancel HIOKI PQ3198A961-02... - Page 113 The inter-harmonics order is obtained by add- ing 0.5 to the harmonics order for the same row. Example: The order of inter-harmonics on the right of the 20th harmonic is 20.5. Inter-harmonics Harmonic Harmonic number of orders HIOKI PQ3198A961-02...
- Page 114 6.4 Displaying Harmonics Holding the display [Hold] (Measured values and waveforms will be held.) HIOKI PQ3198A961-02...
-
Page 115: Displaying Measured Values Numerically (Dmm Screen)
• When the instrument has failed to synchronize When the interruption event is set to off, the instrument evaluates measured values on the basis of a threshold value of 200% for swell, or 10% for dip and interruption. HIOKI PQ3198A961-02... - Page 116 6.5 Displaying Measured Values Numerically (DMM Screen) Holding the display [Hold] (Measured values will be held.) HIOKI PQ3198A961-02...
-
Page 117: Chapter 7 Monitoring
RMS values and 50 frequency values calculated every During 400 Hz 1 s (for a 50 Hz signal). Of those, the maximum and measurement minimum values are recorded. See: Trend graph recording methods: "Recording TIME PLOT Data and Event Waveforms" (pA.12) RMS voltage calculation HIOKI PQ3198A961-02... - Page 118 19 days 16 hours 35 days 1 hour 19 days 16 hours 35 days 35 days 2 hours 35 days 35 days 35 days 150/180 cycle 23 min. 36 sec. 47 min. 12 sec. 7 hours 52 min. (Approx. 3 sec) HIOKI PQ3198A961-02...
-
Page 119: Using The [Time Plot] Screen
[Analyzing] mode [Recording] [Setting] mode: When you want to change Stop recording Revert to [Setting] mode settings in [Recording] [Analyzing] [Setting] mode [Analyzing] mode: Revert to [Setting] mode In both cases, all displayed measurement data will be deleted. HIOKI PQ3198A961-02... -
Page 120: Displaying Trends
To change the displayed characteristic (when displaying [Energy] screen) (p.117) To enlarge or reduce the graph (p.118) To view the value and time over the cursor (p.119) To scroll through display data (p.119) To search for an event (p.120) HIOKI PQ3198A961-02... - Page 121 • Sum indicates the sum for channels 1 through 3 (varies with connection). • CH4 for S, Q, and PF can only be selected when CH4 is set to AC+DC. These values cannot be selected when CH4 is set to OFF for Eff. HIOKI PQ3198A961-02...
- Page 122 Displays the maximum value during the TIME PLOT interval. Displays the minimum value during the TIME PLOT interval. Displays the average value during the TIME PLOT interval. Displays the maximum, minimum, and average ∗ values during the TIME PLOT interval. HIOKI PQ3198A961-02...
- Page 123 Changing the displayed items ([ENERGY] screen) [Select] Select Display the pull-down menu Select a setting Accep setting Cancel Displayed items Setting Contents:( ∗ : Default setting) Active integration amount for WP+ consumption, ∗ WP- regeneration Reactive power WQLAG lag, WQLEAD lead HIOKI PQ3198A961-02...
- Page 124 To enlarge the graph, increase the scale. Setting Contents:( ∗ : Default setting) ∗ AUTO , ×1, ×2, ×5, ×10, ×25, ×50 X-axis scale (Tdiv) Selects the X-axis scale. Setting Contents: ∗ AUTO , From 1min/div When recording, use AUTO. HIOKI PQ3198A961-02...
- Page 125 • The cursor on the scroll bar shows where the cur- sor is located relative to all measurement data. Display scope All measurement data HIOKI PQ3198A961-02...
- Page 126 Even when dip, swell, and interruption events have been turned off, flags are shown with measurement data when a dip or interruption (when the voltage falls 10% relative to the nominal voltage) or swell (when the voltage rises 200%) is judged to have occurred. Flag icon: HIOKI PQ3198A961-02...
-
Page 127: Displaying Detailed Trends
To search for an event (p.126) Unlike trend data, which consists of one graph each for the maximum, minimum, and aver- age values, detailed trend data is displayed as a single graph with vertically connected bands between the maximum and minimum values. HIOKI PQ3198A961-02... - Page 128 RMS current refreshed each half-cycle Irms1/2 (inrush current) Freq_wav One frequency cycle Pinst Instantaneous flicker value Pinst is only displayed when [Flicker] is set to [Pst, Plt]. Displayed channel Setting Contents:( ∗ : Default setting) ∗ / CH2/ CH3/ HIOKI PQ3198A961-02...
- Page 129 When you want to reduce the graph, make the scale smaller. When you want to enlarge the graph, make the scale larger. Setting Contents:( ∗ : Default setting) ∗ AUTO , From 1min/div (varies with TIME PLOT interval) AUTO scaling is used during recording. This cannot be changed. HIOKI PQ3198A961-02...
- Page 130 • When the TIME PLOT interval is set to 150 or 180 cycles, the time is shown in ms units. • The time displayed during cursor measurement is based on the CH1 voltage (U1). The event time shown on the event list and the time displayed during cursor mea- surement may not agree. HIOKI PQ3198A961-02...
- Page 131 (shown in white) illustrates which range of all measurement data is being shown on the screen. • The cursor on the scroll bar shows Display scope where the cursor is located relative to all measurement data. All measurement data HIOKI PQ3198A961-02...
- Page 132 This corresponds to the event selected on the event list. [Event search] Skips sideways through the event markers. Event mark (Red): Indicates a normal event. Analyzing events using waveforms Event number, time and date, type, channel HIOKI PQ3198A961-02...
-
Page 133: Displaying Harmonic Trends
Additionally, inter-harmonic trend data will not be displayed if [P&Harm] is selected. • During 400 Hz measurement, harmonic analysis is performed up to the 10th order, and inter-harmonic analysis is not available. HIOKI PQ3198A961-02... - Page 134 Displayed waveforms, displayed measured values Setting Contents:( ∗ : Default setting) Displays the maximum value during the TIME ∗ PLOT interval. Displays the minimum value during the TIME PLOT interval. Displays the average value during the TIME PLOT interval. HIOKI PQ3198A961-02...
- Page 135 This section describes how to read the value and time above the time series graph cursor. [Cursor] Move the vertical cursor left and right to read the display value. Cursor time The cursor value is shown in Cursor Cursor value same color selected order. HIOKI PQ3198A961-02...
- Page 136 The start time and stop time event markers are always displayed. Synchronization is achieved with an event selected from the event list. [Event search] Skips sideways through the event Event mark markers. (Red): Analyzing events Indicates a normal event. using waveforms Event number, time and date, type, channel HIOKI PQ3198A961-02...
-
Page 137: Displaying Flicker Values In Graph And List Form
Pst, Plt measurement immediately after settings have been configured, and the initial measured value may be excessively high. It is recommended to wait about 2 min- utes after making settings on the [SYSTEM] screen before starting measurement. HIOKI PQ3198A961-02... - Page 138 Setting Contents:( ∗ : Default setting) ∗ AUTO , ×1, ×2, ×5, ×10, ×25, ×50 X-axis scale (Tdiv) Selects the X-axis scale. Setting Contents: ∗ AUTO From 1min/div AUTO scaling is used during recording. This cannot be changed. HIOKI PQ3198A961-02...
- Page 139 (shown in white) illustrates which Scroll bar range of all measurement data is being shown on the screen. • The cursor on the scroll bar shows Display scope where the cursor is located relative to all measurement data. All measurement data HIOKI PQ3198A961-02...
-
Page 140: Displaying An Iec Flicker List
Even when dip, swell, and interruption events have been turned off, flags are shown with measurement data when a dip or interruption (when the voltage falls 10% relative to the nominal voltage) or swell (when the voltage rises 200%) is judged to have occurred. Flag icon: HIOKI PQ3198A961-02... -
Page 141: Displaying A Δv10 Flicker Fluctuation Graph
ΔV10 measurement immediately after settings have been configured, and the first and second ΔV10 measured values may be excessively high. It is recommended to wait about 5 minutes after making settings on the [SYSTEM] screen before starting measurement. HIOKI PQ3198A961-02... - Page 142 Setting Contents:( ∗ : Default setting) ∗ AUTO , ×1, ×2, ×5, ×10, ×25, ×50 X-axis scale (Tdiv) Selects the X-axis scale. Setting Contents: ∗ AUTO From 10min/div AUTO scaling is used during recording. This cannot be changed. HIOKI PQ3198A961-02...
- Page 143 (shown in white) illustrates which range of all measurement data is being shown on the screen. • The cursor on the scroll bar shows Display scope where the cursor is located relative to all measurement data. All measurement data HIOKI PQ3198A961-02...
-
Page 144: Displaying A Δv10 Flicker List
[TIME PLOT] screen [Flicker] [List] • Statistics are updated once an hour, and the ΔV10 flicker overall maximum value is updated once a minute. • The list is not displayed unless [Flicker] is set to [ΔV10] [SYSTEM]-DF1 [Main]- [Measure2]. HIOKI PQ3198A961-02... -
Page 145: Chapter 8 Checking Events (Event Screen)
Analyze events. (p.145 to p.153) You can display the screen at the time the selected event occurred. Events displayed by the PQ3198 • Start recording events • Stop recording events • Calculation events (events for which one or more thresholds can be set) •... -
Page 146: Using The Event Screen
[Analyzing] mode [Recording] [Setting] mode: When you want to change Stop recording Revert to [Setting] mode settings in [Recording] [Analyzing] [Setting] [Analyzing] mode mode: Revert to [Setting] mode In both cases, all displayed measurement data will be deleted. HIOKI PQ3198A961-02... -
Page 147: Displaying The Event List
To analyze the transient waveform (p.147) To view high-order harmonic measured values (p.150) To check fluctuation data (p.153) • Information that is recorded as the event includes the start, stop, the PQ3198 message, and event parameters set in the [SYSTEM] screen. - Page 148 The voltage waveform when the event occurred is shown. You can more the yellow cur- sor up and down 100 rows at a time with the keys. You can move the cursor to the most recent event with the key. HIOKI PQ3198A961-02...
- Page 149 Voltage waveform Wave comparison Timer event Timer Continuous event Cont External event Manual event Manu Start Start Stop Stop GPS_IN Note 1 GPS_OUT GPS_Err HIOKI PQ3198A961-02...
- Page 150 Indicates the time at which the worst value was detected. 10:05:32.016 Channel on which the worst value was detected Number of transient overvoltages detected from the transient overvoltage event IN Times 5Times to the transient overvoltage event OUT (up to 99999) HIOKI PQ3198A961-02...
-
Page 151: Analyzing The Measurement Line Status When Events Occur
Event waveform waveform when the event [VIEW] screen, and screen occurred. the waveform at the time of the event will be dis- played. The event number, event time, and event type will be displayed. Return to event list HIOKI PQ3198A961-02... - Page 152 Note2: When a series of swell, dip, interruption, or inrush current IN events occur, there may be no fluctua- tion data. How can event waveforms be recorded? See: "Appendix 4 Recording TIME PLOT Data and Event Waveforms" (p.A12) HIOKI PQ3198A961-02...
-
Page 153: Analyzing Transient Waveforms
50 Hz/60 Hz from having a sampled waveform pass through a highpass filter (fc = 5 kHz). • Since voltage waveform display data reduced to 20 kS/s, the effect from a transient waveform may not be reflected to the voltage waveforms. HIOKI PQ3198A961-02... - Page 154 X-axis range (Tdiv) (left: voltage waveform range; right: transient waveform range) Selects the X-axis scale. Setting Contents:( ∗ : Default setting) Voltage waveform range: ∗ 5ms/div , 10ms/div, 20ms/div, 40ms/div Transient waveform range: ∗ 25μs/div , 50μs/div, 100μs/div, 200μs/div, 400μs/div HIOKI PQ3198A961-02...
- Page 155 Return to event list Display scope Scroll bar Scroll bar The display scope on the scroll bar (shown in white) illustrates which Display scope range of all measurement data is being shown on the screen. All measurement data HIOKI PQ3198A961-02...
-
Page 156: Viewing High-Order Harmonic Waveforms
High-order harmonic waveforms of the event will be dis- display played. [HHarmonic] Return to event list Select with the key. To enlarge or reduce the graph (p.151) To read the value above the cursor (p.152) To scroll waveform data (p.152) HIOKI PQ3198A961-02... - Page 157 , x2, x5, x10, x20, x50 X-axis scale Selects the X-axis scale. Setting Contents:( ∗ : Default setting) ∗ 0.5ms/div , 1ms/div, 2ms/div, 5ms/div,10ms/div The scale can also be changed without using the pull-down menu by pressing the up and down cursor keys. HIOKI PQ3198A961-02...
- Page 158 (shown in white) illustrates which range of all measurement data is being shown on the screen. • The cursor on the scroll bar indi- Display scope cates where the cursor is located relative to all waveform data. All waveform data HIOKI PQ3198A961-02...
-
Page 159: Checking Fluctuation Data
To enlarge or reduce the graph (p.154) Blue: CH3 Gray: CH4 To read the value above the cursor (p.155) The maximum and minimum values during To scroll waveform data (p.156) the TIME PLOT interval are shown as the MAX and MIN values. HIOKI PQ3198A961-02... - Page 160 X-axis scale (Tdiv) When you want to reduce the graph, make the scale smaller. When you want to enlarge the graph, make the scale larger. Setting Contents:( ∗ : Default setting) ∗ AUTO ×5, ×2, ×1, ×1/2, ×1/5, ×1/10 HIOKI PQ3198A961-02...
- Page 161 Yellow: CH2 Blue: CH3 Cursor Gray: CH4 time The time displayed during cursor measurement is based on the CH1 voltage (U1). Event occurrence times displayed in the event list and times shown during cursor measurement may not agree. HIOKI PQ3198A961-02...
- Page 162 (shown in white) illustrates which range of all measurement data is being shown on the screen. Display scope • The cursor on the scroll bar shows where the cursor is located relative to all measurement data. All measurement data HIOKI PQ3198A961-02...
-
Page 163: Chapter 9 Data Saving And File Operations (System-Memory Screen)
(SYSTEM-MEMORY Chapter 9 screen) The PQ3198 saves settings data, measurement data, waveform data, event data, and screen copy data to an optional SD memory card. (Of this data, only setting conditions can be loaded by the instrument.) See:"3.5 Inserting (Removing) an SD Memory Card" (p.43) 9.1 [MEMORY] Screen... - Page 164 High-order harmonic waveform file 000001.WDU Fluctuation data file AT000000.BMP Screen data file saved once each screen copy interval PQ3198.SET Settings data file at start of time series measurement TP0000.ITV Time series measurement normal binary file FL0000.FLC Time series measurement flicker data HARDCOPY <Folder>...
- Page 165 • While the root folder is being displayed, you can move to the [PQ3198] folder with the right cursor key, regardless of the cursor position. • To go back one folder when the...
-
Page 166: Formatting Sd Memory Cards
SD format, resulting in decreased memory card performance. • The instrument can only store data on memory cards that use the SD format. • Use only HIOKI-approved SD memory cards (model Z4001, etc). Proper operation is not guaranteed if other cards are used. -
Page 167: Save Operation And File Structure
9.3 Save Operation and File Structure 9.3 Save Operation and File Structure Save operation Saving measurement data (p.163) Figure: Time series measurement normal data files TP0000.ITV memory 19010100 PQ3198 Data is automatically saved Saving card root TP0001.ITV according to the time control method settings. - Page 168 9.3 Save Operation and File Structure File structure (overall) HARD PQ3198 COPY Folder for saving screen copy data Folder naming conventions files (Example: The first set of binary data recorded on January 1, 2019) 19: Last 2 digits of the Western year...
-
Page 169: Saving, Display And Deleting Measurement Data
Day], the maximum recording time is 366 days. • When repeated recording is set to Week], the maximum recording time is 55 weeks. • Harmonics order data is not saved for [Power], but it is saved in THD. HIOKI PQ3198A961-02... - Page 170 9.4 Saving, Display and Deleting Measurement Data Delete [SYSTEM] screen [List] Select the num- ber (No.) you wish to delete [Delete] A deletion confirmation dialog box will be dis- played. Execute Cancel HIOKI PQ3198A961-02...
- Page 171 • The maximum displayed times of the trend data, detailed trend data, and har- monic trend data in the screen of the Hioki PQ3198 is subject to [TIME PLOT] certain constraints. To confirm all measured trend data, use the application software PQ ONE, which is supplied with the instrument.
-
Page 172: Saving, Displaying, And Deleting Screen Copies
Select the thumbnail whose screen you wish to view with the cursor keys and press the [View] key to view Cancel hard copies of screens for which a screen copy interval was set. HIOKI PQ3198A961-02... -
Page 173: Saving And Deleting Settings Files (Settings Data)
• All filenames are assigned automatically and cannot be changed by the user (for exam- ple, 00000000.SET). See:"9.3 Save Operation and File Structure" (p.161) • Up to 102 files can be displayed on the [Setting] screen. 8 9 9 HIOKI PQ3198A961-02... -
Page 174: Loading Settings Files (Settings Data)
Settings files should be placed in the [SETTING] folder, and screen copy files should be placed in the [HARDCOPY] folder. Filenames containing characters other than letters and numbers may not be properly displayed by the instrument. HIOKI PQ3198A961-02... -
Page 175: Chapter 10 Analyzing Data Using The Application (Pq One)
Displays lists of file information including settings and the number of events Dragging a folder containing measurement data displays lists of all data and event occur- rences included in the folder. Refer to the Application Software Instruction Manual (CD) for details. HIOKI PQ3198A961-02... -
Page 176: Installation
The Adobe Reader must be installed on your computer to view the Instruction Manual. (Adobe Reader can be downloaded from the Adobe website.) Operating environment Operating System (OS) Windows 7, Windows 8.1, Windows 10 Display resolution 1280 × 768 dots or more CD-ROM drive Used for installation HIOKI PQ3198A961-02... -
Page 177: Installation Procedure
Explorer. Click This PC, and then, double-click DVD RW Drive. Double-click the English folder. Double-click setup.exe (SET UP file). (The extension may not be displayed.) After the installer starts, follow the instruction to proceed with the installation. HIOKI PQ3198A961-02... - Page 178 10.2 Installation HIOKI PQ3198A961-02...
-
Page 179: Chapter 11 Connecting External Devices
When you connect the event output terminal to a trigger input terminal on a waveform When you connect the search signal of an recording device such as the Hioki Memory anomaly search device such as an overcur- rent relay to the event input terminal, you can... -
Page 180: Connecting To The External Control Terminal
The electric wire is locked in place. Longer wires may cause malfunction due to external noise. Wind the wires around a ferrite clamp as shown in the figure before connection (position the fer- rite clamp as near the terminal block as possible). HIOKI PQ3198A961-02... -
Page 181: Using The Event Input Terminal (Event In)
LOW level : 0 V to 0.8 V Maximum input voltage -0.5V to +6.0 V 170 ms or more HIGH 3.0 V to 5.0 V 0 V to 0.8 V 30 ms or more +5 V 10 kΩ 470 Ω 2200 pF HIOKI PQ3198A961-02... -
Page 182: Using The Event Input Terminal (Event Out)
This allows you to record waveforms on the Memory HiCorder when events occur on the PQ3198. You can record between 14 and 16 waveforms on the PQ3198 when events occur. When you want to record waveforms for a longer period of time, use the PQ3198 in parallel with a Memory HiCorder. -
Page 183: Chapter 12 Operation With A Computer
The SD memory card will be detected as a removable disk, and you will be able to copy data to a com- puter. Ethernet ("LAN") Connection Capabilities • Control the instrument remotely by internet browser. (p.184) • You will be able to download measurement data from the instrument to a computer (using the FTP server function). (p.187) HIOKI PQ3198A961-02... -
Page 184: Downloading Measurement Data Using The Usb Interface
USB connection. Alternately, you can use the computer’s “Safely Remove Hardware” icon to end the connection. 2. Disconnect the USB cable from the computer. The transferred data can be analyzed using the attached PQ ONE application software. Files other than screen copies cannot be opened directly. HIOKI PQ3198A961-02... -
Page 185: Control And Measurement Via Ethernet ("Lan") Interface
The instrument does not support network environments where an IP address is automatically acquired using DHCP. Configure the router to assign a fixed IP address to the PQ3198. For more information about router settings, see the instruction manual for your wireless LAN router. -
Page 186: Lan Settings And Network Environment Configuration
(subnets), this IP address specifies the device to serve as the gateway between the networks. If the computer and instrument are connected one-to-one, no gateway is used, and the instrument's default setting "0.0.0.0" can be kept as is. HIOKI PQ3198A961-02... - Page 187 When building a local network with no outside connection, the following private IP addresses are rec- ommended. Configure the network using addresses 192.168.1.0 to 192.168.1.24 IP Address : Computer : 192.168.1.1 : PQ3198 : assign to each instrument in order 192.168.1.2, 192.168.1.3, 192.168.1.4, ... Subnet Mask : 255.255.255.0 Default Gateway: Computer : ___.___.___.___...
-
Page 188: Instrument Connection
• A 100BASE-TX-compatible straight cable (up to 100 m, commercially available). For 10BASE commu- nication, a 10BASE-T-compliant cable may also be used. • Hioki Model 9642 LAN Cable (option) When connecting one instrument to a single computer (prepare any of the following): •... - Page 189 Connect to the Ethernet jack on the instrument. Connect to a 100BASE-TX hub. When connecting the instrument to a single computer (connect the instrument to the computer) Use the Hioki 9642 LAN Cable and cross-over adapter (9642 accessory) Cross-conversion Ethernet cable...
-
Page 190: Remote Control Of The Instrument By Internet Browser
(1) Check the network settings on the instrument and the IP address of the computer. See: "LAN Settings and Network Environment Configuration" (p.180) (2) Check that the LINK LED in the Ethernet internet jack is lit, and that (the LAN indicator) is displayed on the instrument's screen. See: "Instrument Connection" (p.182) HIOKI PQ3198A961-02... -
Page 191: Operating Procedure
*: The boot key reset will cause the instrument’s settings to be reverted to their default values. You can revert all settings, including language and communications settings, to their default values by turning on the instrument while holding down the ENTER key. HIOKI PQ3198A961-02... - Page 192 If the instrument does not accept key input Is the browser's security level set to “High”, or has JavaScript been disabled? Change the browser's security setting to Medium or Medium-high. The displayed information may vary with the browser being used. HIOKI PQ3198A961-02...
-
Page 193: Downloading Recorded Data To Computer
When the field is selected, a drop- down menu will be displayed. When entering alphanumeric char- acters, the setting will change. Reboot the instrument when changing the network Select a setting/ settings. Enter alphanumeric characters. Accept the setting Cancel HIOKI PQ3198A961-02... - Page 194 Configure a password used when connecting an FTP client to the instrument. Password The password does not appear on the screen (displayed as ****************). (Up to 20 one-byte characters, example: PQ3198) Download Run an FTP client software. This section explains an example of using a free software WinSCP.
- Page 195 When wanting to perform remote control: See:"Remote Control of the Instrument by Internet Browser" (p.184) To analyze data or convert to text data : Use the included PQ ONE application. For more information, see the PQ ONE instruction manual. HIOKI PQ3198A961-02...
- Page 196 12.4 Downloading Recorded Data to Computer HIOKI PQ3198A961-02...
-
Page 197: Chapter 13 Specifications
Approx. 300W × 211H × 68D mm (11.81″W × 8.31″H × 2.68″D) Body Strap can be attached. Mass Approx. 2.5 kg (88.2 oz.) (with Z1003 Battery Pack installed) Product warranty period 3 years Accessories See: "Accessories" (p.4) Options See: "Options" (p.5) HIOKI PQ3198A961-02... -
Page 198: Input Specifications/Output Specifications/Measurement Specifications
Current: 4 channels Input terminal form Voltage: Plug-in terminals (Safety terminals) Current: Dedicated connectors (Hioki PL14) Current sensor power supply For AC/DC auto-zero current sensors and AC flexible current sensors +5 V ±0.25 V, -5 V ±0.25 V; supplied current: 30 mA max./ch. - Page 199 Active energy WP+, WP- Apparent power 1,2,4,sum 1,2,4,sum 1,2,4,sum 1,2,4,sum 1,2,4,sum Reactive power 1,2,4,sum 1,2,4,sum 1,2,3,4, 1,2,3,4, 1,2,3,4, Reactive energy (lag) WQLAG, WQLEAD (lead) Power factor/displace- PF/DPF 1,2,4,sum 1,2,4,sum 1,2,3,4, 1,2,3,4, 1,2,3,4, ment power factor HIOKI PQ3198A961-02...
- Page 200 AVG, 1,2,3 1,2,3 1,2,3 erage value, 1-hour maximum dV10max,dV10max4, value, 1-hour fourth-largest val- dV10 total max ue, overall maximum value [during measurement period]) Short interval voltage flicker Pst 1,2,3 1,2,3 1,2,3 Long interval voltage flicker Plt HIOKI PQ3198A961-02...
- Page 201 Conditions of Guaranteed accuracy period: 1 year guaranteed accuracy Guaranteed accuracy period from adjustment made by Hioki: 1 year Temperature and humidity for guaranteed accuracy: 23°C±5°C (73°F±9°F), 80% RH or less Warm-up time: at least 30 minutes Power factor=1, common-mode voltage 0 V, specified after zero-adjustment...
- Page 202 See the Dip, Swell, and Interruption sections. Multiple-phase system treatment None Saved waveforms None Constraints With a 400 Hz measurement frequency, measured values recorded on the event voltage fluctua- tion graph consist of RMS voltage values for each waveform. HIOKI PQ3198A961-02...
- Page 203 When set to 400 Hz, saves the data of RMS voltage refreshed each half-cycle and RMS current refreshed each half-cycle obtained in the period between 0.125 sec prior to the event IN and 7.375 sec after the event IN. HIOKI PQ3198A961-02...
- Page 204 RMS data refreshed each cycle is saved from 0.5 s before to 29.5 s after the EVENT IN. When set to 400 Hz, RMS data refreshed each cycle is saved from 0.125 s before to 7.375 s after. HIOKI PQ3198A961-02...
- Page 205 50 Hz; With the measurement frequency setting of 50 Hz: 0.003 Hz or less With the meausurement frequency setting of 400 Hz: 0.10 Hz or less (with input voltage of 10 V to 1660 V) Event threshold HIOKI PQ3198A961-02...
- Page 206 Start of approx. 200 ms aggregation in which ±threshold was exceeded Event OUT Start of first approx. 200 ms aggregation after IN state in which ±threshold was not exceeded Multiple-phase system treatment Separate by channel Saved waveforms Event waveforms HIOKI PQ3198A961-02...
- Page 207 Start of the 200 ms aggregation in which the threshold was exceeded Event OUT Start of the first 200 ms aggregation after the IN state in which the threshold was not exceed Multiple-phase system treatment None Saved waveforms Event waveforms HIOKI PQ3198A961-02...
- Page 208 Start of the 200 ms aggregation in which the threshold was exceeded Event OUT Start of the first 200 ms aggregation after the IN state in which the threshold was not exceed Multiple-phase system treatment None Saved waveforms Event waveforms HIOKI PQ3198A961-02...
- Page 209 Calculated based on the ratio of channels' respective active power values (For more information, see "13.8 Calculation Formula" (p.231)) Displayed item Eff1, Eff2 Measurement range 0.00 to 200.00[%] ±1 dgt. for calculations derived from the various measurement values. Measurement accuracy Event threshold HIOKI PQ3198A961-02...
- Page 210 Start of approx. 200 ms aggregation in which the absolute value was greater than the threshold Event OUT Start of approx. 200 ms aggregation in which the reading was less than (threshold - hysteresis) following the EVENT IN state Multiple-phase system treatment Separate by channel Saved waveforms Event waveforms HIOKI PQ3198A961-02...
- Page 211 Start of approx. 200 ms aggregation in which the absolute value was less than the threshold Event OUT Start of the approx. 200 ms aggregation in which the reading was greater than (absolute value + hysteresis) following the EVENT IN state Multiple-phase system treatment Separate by channel Saved waveforms Event waveforms HIOKI PQ3198A961-02...
- Page 212 Start of approx. 200 ms aggregation in which reading was greater than the threshold Event OUT Start of approx. 200 ms aggregation in which the reading was less than (threshold - hysteresis) Multiple-phase system treatment None Saved waveforms Event waveforms HIOKI PQ3198A961-02...
- Page 213 Multiple-phase system treatment Separate by channel Saved waveforms Event waveforms High-order harmonic waveform 40 ms from the end of the first approx. 200 ms aggregation interval in which the reading was great- er than the threshold (8000 data points) HIOKI PQ3198A961-02...
- Page 214 (when the threshold is positive) or greater than (threshold + hysteresis) (when the threshold is neg- ative) in the EVENT IN state Multiple-phase system treatment Separate by channel Saved waveforms Event waveforms Constraints When using an AC-only current sensor, the 0th order is not specified for current and power. HIOKI PQ3198A961-02...
- Page 215 Inter-harmonic voltage (Defined for a nominal voltage of at least 100 V.) 1% or greater of harmonic input nominal voltage:: ±5.00% rdg. <1% of harmonic input nominal voltage: ±0.05% of nominal voltage Inter-harmonic current: Unspecified Event threshold Constraints Not displayed for 400 Hz measurement. HIOKI PQ3198A961-02...
- Page 216 Start of approx. 200 ms aggregation in which the absolute value is greater than the threshold. Event OUT Start of the approx. 200 ms aggregation in which the absolute value is less than (threshold - hys- teresis) in the EVENT IN state. Multiple-phase system treatment Separate by channel Saved waveforms Event waveforms HIOKI PQ3198A961-02...
- Page 217 Start of approx. 200 ms aggregation in which the absolute value was greater than the threshold Event OUT Start of approx. 200 ms aggregation in which the reading was less than (threshold - hysteresis) following the EVENT IN state Multiple-phase system treatment Separate by channel Saved waveforms Event waveforms HIOKI PQ3198A961-02...
- Page 218 0.0001 to 10000 PU broken into 1024 segments with a logarithm Flicker filter Select 230 V lamp, 120 V lamp. Pst ±5% rdg. (Specified within range 0.1000 to 20.000 using IEC61000-4-15 Class F1 perfor- Measurement accuracy mance test.) Event threshold HIOKI PQ3198A961-02...
- Page 219 Flagged data are referenced to decide the frequency for an interruption, and are recorded in status informa- tion of the TIME PLOT data. If events of a dip, swell, or interruption are set to off, the values are also flagged. HIOKI PQ3198A961-02...
-
Page 220: Screen Specifications
[SYSTEM] Settings cannot be changed, and measured values are updated approx- imately once every 0.5 s. [VIEW] Analysis of event specified on the [TIME PLOT] [EVENT] screen [TIME PLOT] Time series graph display [EVENT] Event display START LED HIOKI PQ3198A961-02... - Page 221 CT7731 (100 A): 100 A/50 A CT7736 (600 A): 500 A/50 A CT7742 (2 kA): 5000 A/500 A Current sensor automatic Connected sensors that support the HIOKI PL14 connector are automatically detected when selected on detection the settings screen. Phase names R S T/A B C/L1 L2 L3/U V W ―...
- Page 222 When repeated recording is set to 1 week: 1 to 55 count When repeated recording is set to 1 day: 1 to 366 count (When actual time control is enabled, set based on the stop time and date.) HIOKI PQ3198A961-02...
- Page 223 (only at 50 Hz)/180 cycle (only at 60 Hz) /1200 cycle (only at 400 Hz) Automatic saving Saves data to the SD memory card for each TIME PLOT interval. Screen copy interval OFF/5 minutes/10 minutes/30 minutes/1 hour/2 hours Outputs the display image to the SD memory card on a regular basis. HIOKI PQ3198A961-02...
- Page 224 See: "5.6 Changing Event Settings" (p.85) (6) [MEMORY] Screen Target interface SD memory card Function Mass storage, saving (of settings data), loading (of settings data, measurement data, event data, screen data, and version upgrade files), deletion of folders and files, and formatting HIOKI PQ3198A961-02...
- Page 225 SENSE width: OFF SENSE width: OFF Inrush current 200% of reference (Irms 1/2) value Active power Apparent power Reactive power Power factor/displace- ment power factor Voltage unbalance OFF, 3% OFF, 3% OFF, OFF OFF, OFF OFF, 2% factor (zero-phase, negative-phase) HIOKI PQ3198A961-02...
- Page 226 Multiples of 3 Order h Relative voltage (Un) Order h Relative voltage (Un) Order h Relative voltage (Un) 6.0% 5.0% 2.0% 5.0% 1.5% 1.0% 3.5% 0.5% 6...24 0.5% 3.0% 0.5% 2.0% 1.5% 1.5% 1.5% Un = nominal voltage (Uref) HIOKI PQ3198A961-02...
- Page 227 Display parameter 1 : Inter-harmonics ON/OFF Display selec- (Display of inter-harmonics is not available during 400 Hz mea- tion surement.) Display parameter 2 : Choose from LEVEL (RMS value), % of Fnd (content percent- age), and PHASE (phase angle). HIOKI PQ3198A961-02...
- Page 228 (positive, negative), Frequency 200 ms, High-order harmonic component, Zero-sequence negative-sequence unbalance ratio 3. Current : RMS current, Current total harmonic distortion, Current waveform peak value (pos- itive, negative), Frequency 200 ms, High-order harmonic component, Zero-sequence negative-sequence unbalance ratio HIOKI PQ3198A961-02...
- Page 229 Time series graph of maximum, minimum, and average values for up to 6 items Additional display Event occurrence point display function Event jump function Allows details for specified event to be analyzed on [VIEW] screen. Time-series graph cursors HIOKI PQ3198A961-02...
- Page 230 No display for 400 Hz measurement (8) IEC flicker list display (when flicker is set to IEC [Pst, Plt]) Display refresh rate Each time Pst is updated Displayed content Pst and Plt values Constraints No display for 400 Hz measurement HIOKI PQ3198A961-02...
- Page 231 (3) Fluctuation data display (detailed trend graph at event occurrence) Displayed screens Time series graph of fluctuation data at event occurrence Display update rate during Each time a displayed event occurs (display is overwritten) measurement Displayed content Urms1/2, Irms1/2 (inrush current) Cursor measurement HIOKI PQ3198A961-02...
-
Page 232: Event Specifications
When the upper limit or lower limit exceeded event ends, a SENSE END event is generated, and sense function operation terminates. If SENSE and SENSE END overlap, SENSE END will have priority. (SENSE START and SENSE END are not shown on the display.) HIOKI PQ3198A961-02... -
Page 233: Gps Time Synchronization Function
The yellow mark is also shown when time correction is canceled during recording. Red GPS mark : The PQ3198 has not detected the GPS box. Time correction function Corrected time and correction Set to amount of variation from universal coordinated time (UTC). -
Page 234: Interface Specification
Loading of screen copies (up to 102 files) ⋅ Deleting of files ⋅ Formatting of SD memory cards Media full processing Saving of data to SD memory card is stopped (time series data is stored on a first-in, first-out basis.) HIOKI PQ3198A961-02... - Page 235 [GND] terminal and [EVENT OUT] terminal reverts to high at data reset Rated voltage -0.5 V to +6.0 V Pin assignment Signal name Function Operation EVENT IN Event-in Level EVENT OUT Event-out Level ― Ground ― ― Ground ― HIOKI PQ3198A961-02...
-
Page 236: Other Functions
Function description Sets the language when the instrument is turned on for the first time. Boot key reset Reverts all settings, including the language setting, to the factory defaults. Turn on the instrument while holding down the ENTER keys. HIOKI PQ3198A961-02... -
Page 237: Calculation Formula
(60 Hz). During 400 Hz measurement, the calculation is performed with 80 waveforms. • The voltage waveform peak for CH4 can be calculated regardless of the connection method. c: measured channel, M: number of samples per period, s: number of sampling points HIOKI PQ3198A961-02... - Page 238 • Calculated with 10 waveforms (50 Hz measurement) or 12 waveforms (60 Hz measurement). For 400 Hz measurement, the calculation is performed with 80 waveforms. • The CH4 RMS current can be calculated regardless of the connection type. c: measured channel, M: number of samples per period, s: number of sampling points HIOKI PQ3198A961-02...
- Page 239 • When the power is over-range, efficiency results will also be over-range. • When the power value used as the denominator is 0, the efficiency results will be over-range. c: measured channel, M: number of samples per period, s: number of sampling points HIOKI PQ3198A961-02...
- Page 240 RMS voltage and fundamental wave RMS current. (For information on the formulae for harmonic voltage, harmonic current, and the sum of apparent power, see each of their calculation formulae.) c: measured channel, k: order for analysis HIOKI PQ3198A961-02...
- Page 241 The fundamental RMS voltage (phase voltage) from harmonic calculations is used for U1, U2, and U3. For 3-phase 3-wire connections, the value is detected as a line voltage and then converted to a phase voltage. At the negative-phase, seq2=240°, seq3=120° α=U1 phase angle, β=U2 phase angle, γ=U3 phase angle HIOKI PQ3198A961-02...
- Page 242 • β • ϒ seq2 seq3 seq2 seq3 The fundamental RMS current (phase current) from harmonic calculations is used for I1, I2, and I3. At the negative-phase, seq2=240°, seq3=120° α=I1 phase angle, β=I2 phase angle, γ=I3 phase angle HIOKI PQ3198A961-02...
- Page 243 • The inter-harmonic voltage content percentage is calculated by dividing the inter-harmonic voltage component for the specified order by the fundamental voltage component and multiplying by 100. • For 60 Hz measurement, the value 10 in the formula is replaced with 12. HIOKI PQ3198A961-02...
- Page 244 100. c: Measurement channel, k: Order of analysis, r: resistance after FFT, i: reactance after FFT However, for 60 Hz measurement, the value 10 in the formula is replaced with 12. HIOKI PQ3198A961-02...
- Page 245 • The K factor is also called the multiplication factor, and indicates the power loss using the harmonic RMS cur- rent for the electrical transformer. c: Measurement channel, k: Order of analysis, r: resistance after FFT, i: reactance after FFT HIOKI PQ3198A961-02...
- Page 246 • The value K in the equation indicates the total number of analyzed orders. Ithd-R[%] THDIR1 THDIR1 THDIR1 THDIR1 THDIR1 THDIR4 THDIR2 THDIR2 THDIR2 THDIR2 THDIRc= THDIR3 THDIR3 THDIR4 THDIR4 THDIR4 THDIR4 ------------------------------ × • The value K in the equation indicates the total number of analyzed orders. HIOKI PQ3198A961-02...
- Page 247 (Pis): P1s=(P0.7+P1+P1.5)/3, P3S=(P2.2+P3+P4)/3, P10s=(P6+P8+P10+P13+P17)/5, P50s=(P30+P50+P80)/3 Pst n ---------------------------- - • N indicates the number of measurements (N=12). (When N<12, the number of measurements is used as N.) c: measurement channel HIOKI PQ3198A961-02...
- Page 248 • h: measurement period, k: coefficient converted to 1 hour • (+): Value is only used when positive (lag). WQLEAD LEAD LEAD • h: measurement period, k: coefficient converted to 1 hour • (-): Value is only used when negative (lead). HIOKI PQ3198A961-02...
- Page 249 Pphase average calculation (Channel averaging processing) : Qharmk and Pharmk represent the signed averages for each channel. (Sum averaging processing) Qsumk and Psumk represent the signed averages for each channel. *3: For content percentage and order 0, signed average. HIOKI PQ3198A961-02...
-
Page 250: Range Breakdown And Combination Accuracy
Current range Current RMS value* Active power* 500.00 A 0.4% rdg.+0.112% f.s. 0.5% rdg.+0.112% f.s. 50.000 A 0.4% rdg.+0.22% f.s. 0.5% rdg.+0.22% f.s. ≤ ≤ *: When the measurement frequency (f) satisfies the following condition: 45 66 (Hz) HIOKI PQ3198A961-02... - Page 251 Active power* 500.00 A 2.5% rdg.+1.1% f.s. 2.1% rdg.+0.70% f.s. 2.2% rdg.+0.70% f.s. 50.000 A 2.5% rdg.+6.5% f.s. 2.1% rdg.+6.10% f.s. 2.2% rdg.+6.10% f.s. ≤ ≤ *: When the measurement frequency (f) satisfies the following condition: 45 66 (Hz) HIOKI PQ3198A961-02...
- Page 252 Current RMS value* Active power* 5000.0 A 1.6% rdg.+0.4% f.s. 1.7% rdg.+0.4% f.s. 500.00 A 50.000 A 1.6% rdg.+3.1% f.s. 1.7% rdg.+3.1% f.s. ≤ ≤ *: When the measurement frequency (f) satisfies the following condition: 45 66 (Hz) HIOKI PQ3198A961-02...
- Page 253 Current range Current RMS value* Active power* 5.0000 A 1.1% rdg.+0.16% f.s. 1.2% rdg.+0.16% f.s. 500.00 mA 1.1% rdg.+0.7% f.s. 1.2% rdg.+0.7% f.s. ≤ ≤ *: When the measurement frequency (f) satisfies the following condition: 45 66 (Hz) HIOKI PQ3198A961-02...
- Page 254 13.9 Range Breakdown and Combination Accuracy HIOKI PQ3198A961-02...
-
Page 255: Chapter 14 Maintenance And Service
• Clean the vents periodically to avoid blockage. Current Sensor Measurements are degraded by dirt on the facing core surfaces of the current sensor, so keep the surfaces clean by gently wiping them with a soft, dry cloth. HIOKI PQ3198A961-02... -
Page 256: Trouble Shooting
The calibration period varies depending on the status of the instrument and installation environ- ment. We recommend that the calibration period be determined in accordance with the state of the instrument and installation environment. Please contact your Hioki distributor to have your instrument periodically calibrated. - Page 257 When replacing parts, please contact your authorized Hioki distributor or reseller. The service life of parts varies with the operating environment and frequency of use. Parts are not guaranteed to operate throughout the recommended replacement cycle.
- Page 258 2% f.s. is not being supplied to U1 (the reference channel). When no apparent cause can be established Perform a system reset. This will return all settings to their factory defaults. See: "5.7 Initializing the Instrument (System Reset)" (p.92) HIOKI PQ3198A961-02...
-
Page 259: Error Indication
DRAM error. SRAM error error. SRAM The instrument needs to be repaired. Contact your Invalid FLASH. FLASH error. authorized Hioki distributor or reseller. Invalid ADJUST. Adjustment value error. Invalid Backuped values. more erroneous backed-up system variables have created a conflict. - Page 260 To delete them, use a computer. [HARDCOPY] folder. *** SD card error *** An SD memory card error Contact Hioki with information about the instrument’s SD-CARD ERROR. other than those listed above operational status at the time of the error. occurred.
- Page 261 START/ STOP. Contact your authorized Hioki distributor or reseller if a repair should become necessary. Turning on the instrument while the measurement target line is live may damage the instrument, causing an error to be displayed when it is turned on. Always turn on the instrument first and only activate power to the measurement line after verifying that the instrument is not displaying any errors.
-
Page 262: Disposing Of The Instrument
14.4 Disposing of the Instrument 14.4 Disposing of the Instrument The PQ3198 uses lithium batteries as a power source for saving measurement conditions. When disposing of this instrument, remove the lithium battery and dispose of battery and instru- ment in accordance with local regulations. - Page 263 Upper chassis Insert the tweezers between the battery holder and the battery and lift up the battery to remove it. Lithium battery CALIFORNIA, USA ONLY Perchlorate Material - special handling may apply. See www.dtsc.ca.gov/hazardouswaste/perchlorate HIOKI PQ3198A961-02...
- Page 264 14.4 Disposing of the Instrument HIOKI PQ3198A961-02...
-
Page 265: Appendix
ΔV10 (Overall maximum value) Apparent power dV10 total MAX High-order harmonic voltage Reactive power UharmH component High-order harmonic current Active energy (Consumption) IharmH component Active energy (Regeneration) Voltage waveform comparison Wave Reactive energy (Lag) WQLAG Efficiency Eff1,Eff2 Reactive energy (Lead) WQLEAD HIOKI PQ3198A961-02... -
Page 266: Appendix 2 Explanation Of Power Supply Quality Parameters And Events
. By measuring these parameters, it is possible to assess power supply quality. In order to allow the PQ3198 to detect abnormal values and abnormal waveforms, you set thresholds . When these thresholds are exceeded, events are generated. - Page 267 Principal parameters PQ3198 events and Waveform Phenomenon Primary issues indicating measurements power quality Swells occur when the A surge in voltage may Events are detected voltage rises momen- cause the device's using swells. tarily, for example when power to be damaged a power line turns on or or the device to reset.
- Page 268 Principal parameters PQ3198 events and Waveform Phenomenon Primary issues measurements indicating power quality Unbalance is caused Voltage unbalance, Events are detected by increases or negative-phase volt- using voltage unbal- decreases in the load age, and harmonics ance factor and cur-...
-
Page 269: Appendix 3 Event Detection Methods
Transient waveform (including fundament component) fundament component) The first detected transient wave- The waveform with the largest transient voltage value from the IN to the OUT form after event IN is saved. point is saved at event OUT. HIOKI PQ3198A961-02... - Page 270 : Start of the approx. 200 ms aggregation in which the reading is greater than ±threshold Event OUT : Start of the approx. 200 ms aggregation in which the reading returns to ± (threshold - 0.1 Hz) Note: Equivalent to 0.1 Hz frequency hysteresis. HIOKI PQ3198A961-02...
- Page 271 Sense : Sense events are detected when the reading is greater than or less than the sense upper limit be- tween the event IN and event OUT. (When event OUT conditions are fulfilled, the event OUT takes precedence.) HIOKI PQ3198A961-02...
- Page 272 : Start of the approx. 200 ms aggregation in which the 3rd-order harmonic voltage reading is greater than the threshold Event OUT : Start of the approx. 200 ms aggregation in which the Hysteresis reading is less than (the threshold - hysteresis) Threshold EVENT EVENT HIOKI PQ3198A961-02...
- Page 273 Dotted line: Judgment area Solid line: Judgment waveform (measured waveform) Threshold (% of nominal input voltage) Event IN Event IN and OUT: Event IN : First time at which waveform diverges from judgment area Event OUT : None HIOKI PQ3198A961-02...
- Page 274 Event OUT : Time at the start of the voltage half-cycle waveform in which the RMS current refreshed each half-cycle ex- ceeded (threshold - hysteresis) in the negative direction Voltage waveform Current waveform Event IN Event OUT HIOKI PQ3198A961-02...
- Page 275 Manual events are detected when the MANU EVENT (manual event) key is pressed. The voltage and cur- rent waveforms and measured values when the external event occurs can be recorded. See: For more information about how to record event waveforms: "Appendix 4 Recording TIME PLOT Data and Event Waveforms" (p.A12) HIOKI PQ3198A961-02...
-
Page 276: Appendix 4 Recording Time Plot Data And Event Waveforms
Negative peak value 3 Negative peak value N Example: MAX positive peak value AVG positive peak value MIN positive peak value when interval:1 min, MAX negative peak value AVG negative peak value MIN negative peak value N=300 Recording Recording Recording HIOKI PQ3198A961-02... - Page 277 Event waveform record- The result of adding the two waveforms prior to and the two waveforms after the ing period approx. 200 ms aggregation is displayed 50 Hz: 14 cycles as the event waveform. 60 Hz: 16 cycles HIOKI PQ3198A961-02...
- Page 278 150/180 cycle time intervals and between approx. 200 ms aggregations (10 or 12 cycles). The PQ3198 synchronizes the start of the set TIME PLOT interval every 10 minutes. For this reason, approx. 200 ms aggregations (10 or 12 cycles) are also resynchronized every 10 minutes.
- Page 279 ±20 ms for 50 Hz and ±16.7 ms for 60 Hz. By synchronizing the PQ3198 with the PW9005 GPS Box, the instrument time can be synchronized to UTC at a high degree of accuracy. In the event that accurate time synchronization using an external sig- nal, such as that provided by the GPS unit, is not possible, the instrument incorporates a clock capable of operating at a real-time accuracy of within ±1 second per day (within the specified operating temperature...
-
Page 280: Appendix 5 Detailed Explanation Of Iec Flicker And Δv10 Flicker
Block 4 Block 5 Average Online statistical analysis smoothing 1st order Square Class Smooth Pst cal- Plt cal- Long interval multi- cate- averaging cula- cula- flicker plier gory filter tion tion Instantaneous Short interval flicker value flicker Pinst HIOKI PQ3198A961-02... - Page 281 Flicker Value Indicates the degree of perceptibility (severity) of flicker determined from succes- sive Pst measurements over a 2-hour period. To calculate a moving average of Pst, the displayed value is updated every 10 minutes. Calculation: Σ(Psti) Plt = HIOKI PQ3198A961-02...
- Page 282 RMS value calculation 1-minute ΔV10 Squar 100 V voltage con- Storage Voltage ΔV10 calcula- e mul- conver- fluctuation ver- waveform tion tiplier sion data sion Waveform data ΔV10 Luminosity coefficient ΔV10 Perceived flicker coefficient Frequency [Hz] HIOKI PQ3198A961-02...
-
Page 283: Appendix 6 Making Effective Use Of Channel 4
AC power supply on channels 1 through 3 when DC power supply distur- bances occur. ±24 V, ±15 V, ±5 V, etc. Used for separate systems Example of DC power supply measure- ment ±24 V, ±15 V, ±5 V, etc. HIOKI PQ3198A961-02... - Page 284 Although it is necessary to measure a system synchronized to the reference channel in order to obtain accurate measurements, channel 4 can be used to measure a different system than channels 1 through 3 . Used for separate systems Example of 2-system measurement HIOKI PQ3198A961-02...
- Page 285 Example of 2-system measurement 2 EV quick-charge measurement example Solar power system measurement example HIOKI PQ3198A961-02...
-
Page 286: Appendix 7 3-Phase 3-Wire Measurement
(from – – · · · · · · – – · · · · · · · · · · (from as the precondition of a closed circuit) – – · · · · · · ...(2) HIOKI PQ3198A961-02... - Page 287 In 3P3W2M measurement, the instrument inputs the 3-phase line’s T-phase current as each current’s I2 parameter. For display purposes, a current value of Phase T in the 3-phase line is displayed as the cur- rent I2; and a calculated value of Phase S in the 3-phase line, as the current I3. HIOKI PQ3198A961-02...
-
Page 288: Appendix 8 Method For Calculating Active Power Accuracy
= ±0.5% rdg. ±0.22% f.s. ±1.05% rdg. = ±1.55% rdg.±0.22% f.s. Accuracy relative to measured values = active power 30 kW × ± 1.55% rdg. + 150 kW range × 0.22% f.s. = ±0.795 kW = ±0.795 kW/30 kW = ±2.65% rdg. HIOKI PQ3198A961-02... -
Page 289: Appendix 9 Terminology
A European power supply quality standard that defines limit values for supply voltage and EN50160 other characteristics. The PQ ONE application software can be used with data from the PQ3198 to perform standard-compliant evaluation and analysis. An international standard governing measurement of harmonic current and harmonic volt- IEC61000-4-7 age in power supply systems as well as harmonic current emitted by equipment. - Page 290 PQ3198. By inputting an operating signal from an external device, an operation start or stop trigger can be applied in order to record waveforms with the PQ3198. The official time used worldwide. Although UTC is almost identical to Greenwich Mean...
- Page 291 The noise component at and above several kHz. For the PQ3198, the term refers to RMS val- ues for the noise component at 2 kHz and above. By measuring the high-order harmonic com-...
- Page 292 Sense event Measurement value + Sense Event IN Sense event Measurement value Measurement value - Sense High threshold Sense event High hysteresis Event OUT Measurement value Low hysteresis Low threshold Event IN Sense event Sense event HIOKI PQ3198A961-02...
- Page 293 Σ (from 2nd order) × (for the PQ3198, calculated to the 50th order) 100 [%] fundamental wave This value can be monitored to assess waveform distortion for each item, providing a yard-...
- Page 294 When temporary dimming of lights due to voltage drops occurs frequently, it produces a flickering effect (caused by repeated dimming) that produces an extremely unpleasant visual sensation. Measurement methods can be broadly divided into IEC flicker and ΔV10 flicker. In Japan, the ΔV10 method is most frequently used. HIOKI PQ3198A961-02...
- Page 295 Use this function when you wish to observe a wave- form at the instant an event occurs as well as subsequent changes in the instantaneous waveform. For the PQ3198, a waveform of up to 1 s in duration will be recorded. HIOKI PQ3198A961-02...
- Page 296 HIOKI PQ3198A961-02...
-
Page 297: Index
EN50160 ............ 68, A25 Ethernet (LAN) connection ......177, 183 Event ..............A26 K factor ............. A25 Event icon ............67 Key lock .............. 24 EVENT indicator ..........29 Event list ............141 Event list notation ..........143 ..............84 Event waveform ..........227 HIOKI PQ3198A961-02... - Page 298 ..............47 Repair ............... 252 Repeat Record ........... 79 Replaceable parts and operating lifetimes ..253 Reverting the instrument to its factory settings .. 92 Warm-up ............48, 51 When the memory is full ........77 Wiring ..............71 HIOKI PQ3198A961-02...
- Page 299 Index Index Zero adjustment ..........51 Zero phase ............A28 HIOKI PQ3198A961-02...
- Page 300 Index Index HIOKI PQ3198A961-02...
- Page 301 HIOKI PQ3198A961-02...
- Page 302 HIOKI PQ3198A961-02...
- Page 303 HIOKI PQ3198A961-02...
- Page 304 HIOKI PQ3198A961-02...
Need help?
Do you have a question about the PQ3198 and is the answer not in the manual?
Questions and answers