Hioki PQ3100 Instruction Manual
Power quality analyzer
Hide thumbs
Also See for PQ3100:
- Measurement manual (4 pages) ,
- Instruction manual (278 pages) ,
- Selection manual (5 pages)
Table of Contents
Advertisement
Quick Links
Advertisement
Table of Contents

Related Manuals for Hioki PQ3100


Summary of Contents for Hioki PQ3100
-
Page 3: Table Of Contents
Contents Contents Introduction ..........1 Power Supply ......... 43 Verifying Package Contents ..... 2 Turning On/Off the Instrument ..44 Safety Information ........4 Warm-up .......... 44 Operating Precautions ......7 Quick Set Overview 3.1 Configurable Items ......45 Procedure for Investigating Adding Settings ...... - Page 4 Contents Contents Verifying the Harmonic Trend Verifying the Waveform, (Available after the firmware Measured Values update) .......... 103 (MONITOR Screen) 8.6 Verifying the Flicker (Available after the firmware update) ... 104 „ Fixing the waveform display and measured values ........81 Checking Events Verifying the Voltage Waveform (EVENT Screen) and Current Waveform ....82 „...
- Page 5 Contents Contents 15.2 Cleaning ........195 Communications (USB/ 15.3 Error Indication ......195 LAN/RS-232C) 15.4 Disposing the Instrument .... 199 12.1 Preparing for LAN Appendix Appx.1 Communications ......138 „ Settings (SET UP Screen) ......138 Appx. 1 Fundamental „ Example of establishing a network Measurement Items ..
- Page 6 Contents...
-
Page 7: Introduction
Introduction Introduction Thank you for purchasing the Hioki PQ3100 Power Quality Analyzer. To obtain maximum performance from the instrument, please read this manual first, and keep it handy for future reference. Registered trademarks • Microsoft and Windows are either registered trademarks or trademarks of Microsoft Corporation in the United States and other countries. -
Page 8: Verifying Package Contents
When you receive the instrument, inspect it carefully to ensure that no damage occurred during shipping. In particular, check the accessories, keys, switch, and connectors. If damage is evident, or if it fails to operate according to the specifications, contact your authorized Hioki distributor or reseller. - Page 9 Verifying Package Contents Options The following options are provided for the PQ3100. Contact your authorized Hioki distributor or reseller when ordering. For current measurement CT7126 AC Current Sensor (60 A, φ15 mm) CT7131 AC Current Sensor (100 A, φ15 mm) CT7136 AC Current Sensor (600 A, φ46 mm)
-
Page 10: Safety Information
Safety Information Safety Information This instrument is designed to conform to IEC 61010 Safety Standards, and has been thoroughly tested for safety prior to shipment. However, using the instrument in a way not described in this manual may negate the provided safety features. Before using the instrument, be certain to carefully read the following safety notes. - Page 11 Safety Information Symbols on the instrument Indicates cautions and hazards. When the symbol is printed on the instrument, refer to a corresponding topic in the Instruction Manual. Indicates DC (Direct Current). Indicates the ON side of the power switch. Indicates the OFF side of the power switch. Indicates a grounding terminal.
- Page 12 Safety Information Measurement categories To ensure safe operation of measuring instruments, IEC 61010 establishes safety standards for various electrical environments, categorized as CAT II to CAT IV, and called measurement categories. DANGER • Using a measuring instrument in an environment designated with a higher- numbered category than that for which the instrument is rated could result in a severe accident, and must be carefully avoided.
-
Page 13: Operating Precautions
Preliminary Checks Before using the instrument, verify that it operates normally to ensure that no damage occurred during storage or shipping. If you find any damage, contact your authorized Hioki distributor or reseller. DANGER To prevent an electric shock, confirm that the white portion (insulation layer) inside the cable is not exposed. - Page 14 Operating Precautions Handling Cords and Cables DANGER If the insulation on a cord or cable melts, the metal conductor may be exposed. Do not use any cord or cable whose metal conductor is exposed. Doing so could result in electric shock, or other hazard. CAUTION The cord and cable are hardened under the 0 degree or colder environment.
- Page 15 • When storing the instrument, make sure no objects that could short-circuit the connectors are placed near them. • For battery operation, use only the HIOKI Model Z1003 Battery Pack. We do not take any responsibility for accidents or damage related to the use of any other batteries.
- Page 16 Operating Precautions Attaching the Strap CAUTION Attach the strap securely at 2 locations of the instrument. If insecurely attached, the instrument may fall and be damaged when carrying. Using SD Memory Cards CAUTION • Do not remove a card while data is being written to it. Doing so may damage the card. See “10.10 Removing SD Memory Card during Recording”...
-
Page 17: Turning On The Instrument
• If the power does not turn on, the AC adapter or the instrument may be malfunctioning or the power cord may be disconnected. Contact your authorized Hioki distributor or reseller. • If an error during the self-test, the instrument is damaged. Contact your authorized Hioki distributor or reseller. Using Magnetic Adapter... - Page 18 • To ensure safe operation, use only the voltage cord and current sensor specified by Hioki. Displayed values can frequently fluctuate due to induction potential even when no voltage is applied. This, however, is not a malfunction.
- Page 19 • Keep discs inside a protective case and do not expose to direct sunlight, high temperature, or high humidity. • Hioki is not liable for any issues your computer system experiences in the course of using this disc.
- Page 20 Operating Precautions...
-
Page 21: Overview
Overview 1.1 Procedure for Investigating Power Quality By measuring power quality parameters, you can assess the power quality and identify the causes of various power supply malfunctions. The ability of the instrument to measure all power quality parameters simultaneously makes this process a quick and simple one. The following is the description of the investigation process for the power quality. -
Page 22: X84; Step 3: Checking Investigation (Measurement) Locations (Collecting Site Data)
Procedure for Investigating Power Quality (4) What is the expected cause? • Abnormal voltage RMS value trends, waveform distortion, transient overvoltage • Abnormal current Leakage current, inrush current Step 3: Checking investigation (measurement) locations (collecting site data) Collect information (site data) from as many locations as possible to prepare for the investigation. Check the following: (1) Wiring (2) Declared input voltage... - Page 23 Procedure for Investigating Power Quality Configure the conditions and events required for recording. If the EVENT indicator on the screen (p. 32) frequently changes to red, too many events have occurred. When the number of events reaches 9999 during recording/measurement, subsequent events will not be recorded (trend recording continues).
-
Page 24: X84; Advice For Identifying The Cause Of Abnormalities
Procedure for Investigating Power Quality Advice for identifying the cause of abnormalities Record voltage and current trends at the power circuit inlet. If the voltage drops while the building’s current consumption rises, the likely cause for power abnormality lies inside the building. If the voltage and current are both low, the cause is likely to lie outside the building. -
Page 25: Product Overview
Product Overview 1.2 Product Overview The PQ3100 Power Quality Analyzer is a measuring instrument used to manage power quality and identify abnormalities of the power line to analyze the cause of the trouble. All parameters can be recorded simultaneously. Trends and power abnormalities (events) of all parameters can be recorded simultaneously. -
Page 26: Features
Features 1.3 Features Long-term event waveform Waveforms for up to 11.2 s when event occurs (1 s before event, 0.2 s on recording event, 10 s after event) can be saved for power abnormality analysis. DC (Direct Current) DC voltages can be measured. AC/DC Auto Zero Sensor allows DC current measurements measurements. -
Page 27: Names And Functions Of Parts
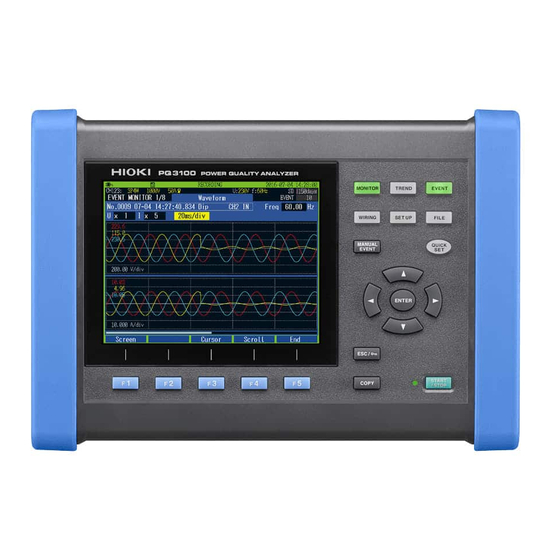
Names and Functions of Parts 1.4 Names and Functions of Parts Operation keys Front Screen switching START/STOP LED Flashing green: When in the recording standby state Solid green: When recording Name and description Reference Display p. 24 6.5″ TFT color LCD Function key ([F1] [F5]... - Page 28 Names and Functions of Parts Upper “4.3 Connecting Voltage “4.4 Connecting Current Cords to Instrument” Sensors and Configuring (p. 51) Current Sensor Settings” (p. 52) Name Description Reference Connects supplied L1000-05 voltage cord to one of Voltage input terminal p. 51 the jacks.
- Page 29 Names and Functions of Parts Right Name Description Reference Uses commercially available wires to connect with External I/O terminals p. 147 external devices. Connects to a computer using the optional RS-232C RS-232C interface p. 145 cable. LAN interface Connects to a computer using the LAN cable. p.
-
Page 30: Screen Configuration
Screen Configuration 1.5 Screen Configuration Displaying and switching screens Use operation keys (screen switching key) [F1] (SCREEN) key to switch screens Screen example: MONITOR screen The screens consist of seven screens each of which corresponds to the operation keys. The screen corresponding to the key pressed is displayed. The screen can be switched by pressing the key repeatedly. -
Page 31: X84; Monitor Screen
Screen Configuration MONITOR screen A screen that is used to monitor instantaneous values. This screen is used to view voltage and current instantaneous waveforms, and the measured values. Display/switch screen: [MONITOR] See “6 Verifying the Waveform, Measured Values (MONITOR Screen)” (p. 81). Waveform screen Electric power... -
Page 32: X84; Trend Screen
Screen Configuration TREND screen A screen used to check the trend (fluctuations) of the measured values. Display/switch screen: [TREND] See “8 Verifying the Trends (Fluctuations) in Measured Values (TREND Screen)” (p. 95). Basic trend screen Detail trend screen This screen is used to check fluctuation width of maximum and minimum values between recording intervals for the following parameters. -
Page 33: X84; Event Screen
Screen Configuration EVENT screen A screen used to check the event status. Display/switch screen: [EVENT] See “9 Checking Events (EVENT Screen)” (p. 105). Event list screen Event statistics screen (available after the firmware update) This screen is used to check the statistical results for each event type. -
Page 34: X84; Set Up Screen
Screen Configuration SET UP screen A screen used to configure settings. Display/switch screen: [SET UP] See “5 Setting Change (SET UP Screen)” (p. 63). Measurement settings 1 screen Measurement settings 2 screen This screen is used to configure settings for calculation method, energy cost, and flicker (available after the firmware update). -
Page 35: X84; File Screen
Screen Configuration FILE screen A screen used for file operations. This screen allows listing and operations for files of the SD memory card and internal memory. [FILE] Display/switch screen: See “10 File Saving and Operations (FILE Screen)” (p. 115). SD card screen Internal memory screen... -
Page 36: Basic Key Operations
Basic Key Operations 1.6 Basic Key Operations See “1 Displaying and switching screens” (p. 24). Changing the required items Move the cursor to the item. The drop down list will be displayed. Select an item. Accept the setting. On the MONITOR screen and the TREND... -
Page 37: X84; Entering Characters
Basic Key Operations Entering characters Move the cursor to the item. A dialog box will be displayed. Character selection Input Delete a character The setting will be accepted. Cancel The entry will be canceled. -
Page 38: Screen Display
Screen Display 1.7 Screen Display 5 6 7 8 Actual time Display Description Gray (no character): (START/STOP LED: Off) • Recording is stopped. • The setting can be changed. Yellow (WAITING): (START/STOP LED: Blinking) • Recording is in standby. • This screen is shown from the time the Operation [START/STOP] key is pressed until the... - Page 39 Screen Display Display Description Reference The instrument is operating with the AC adapter. p. 43 The instrument is running on the battery. p. 38 The instrument is running on the battery, which is almost out of charge. p. 38 Connect the AC adapter and charge the battery. (Blinking) The LAN is connected.
-
Page 40: Error Screen Display
Error Screen Display Display Description Reference No event has been detected. (Black background) Event IN (detection) state. (Red background) Number of events recorded. Up to 9999 events. The event detection status is indicated with a level meter. This is the screen name. Select with the key. Screen name [(Present screen number) / (number of screens)] is displayed within the screen. -
Page 41: Preparing For Measurement
Preparing for Measurement Before starting measurement, connect accessories and options to this instrument. Before performing measurement, be sure to read “Operating Precautions” (p. 7) and to inspect the instrument, accessories, and options to ensure that there is no damage. 2.1 Preparation Flowchart Follow the procedure for preparation described below. -
Page 42: Initial Measurement Preparations
Initial Measurement Preparations 2.2 Initial Measurement Preparations Color coding of current sensor (for channel identification) Be sure to read “Handling Cords and Cables” (p. 8). At both the ends of the current sensor cable, connect the spiral tube of the same color as the channel which is to be connected to the current sensor, to avoid wiring mistakes. -
Page 43: X84; Bundling The Voltage Cords And Current Sensors (If Required)
Initial Measurement Preparations Bundling the voltage cords and current sensors (If required) Be sure to read “Handling Cords and Cables” (p. 8), “Using Voltage Cords” (p. 8). If required, group the cables together by using the spiral tubes (black). Example: In the case of using 3 voltage cords and 2 current sensors Required items ... -
Page 44: X84; Installing The Battery Pack
Initial Measurement Preparations Installing the battery pack Be sure to read “Using Battery Pack” (p. 9). The battery pack is subject to self-discharge. Be sure to charge the battery pack before initial use (See Step 7). If the battery can only be used for a considerably short time even after correct charging, replace it with a new battery pack. -
Page 45: X84; Attaching The Strap (If Required)
Initial Measurement Preparations Attaching the strap (if required) Be sure to read “Attaching the Strap” (p. 10). If required, attach the strap when carrying the instrument or hanging it on a hook at the installed location. Pass through the strap eyelet. Pass through the loop. -
Page 46: X84; Setting The Language, Clock, And Measurement Frequency
Initial Measurement Preparations Setting the language, clock, and measurement frequency When you turn on the instrument for the first time after purchase, the language setting screen, clock setting screen, and frequency setting screen will be displayed. Configure these settings. Similarly, these settings must be configured if a factory reset (p. 77) is performed to reset the instrument to its default settings. -
Page 47: Pre-Measurement Inspection
Pre-measurement Inspection 2.3 Pre-measurement Inspection Before using the instrument, verify that it operates normally to ensure that no damage occurred during storage or shipping. If you find any damage, contact your authorized Hioki distributor or reseller. (1) Inspect the voltage cords... -
Page 48: Inserting The Sd Memory Card
Inserting the SD Memory Card 2.4 Inserting the SD Memory Card Be sure to read “Using SD Memory Cards” (p. 10). Turn off the instrument. (p. 44) Open the cover. Disengage the lock. Insert the SD memory card inside. Lock key Arrow Insert the card horizontally. -
Page 49: Power Supply
Power Supply 2.5 Power Supply Be sure to read “Using AC Adapter” (p. 11). Required items Model Z1002 AC adapter (AC adapter + power cord) Power OFF Connect Hook AC adapter Connect Connect Power cord... -
Page 50: Turning On/Off The Instrument
Turning On/Off the Instrument 2.6 Turning On/Off the Instrument Be sure to read “Turning On the Instrument” (p. 11). Turn on the instrument. After the measurement is complete, always turn off the power. How to turn on the instrument Slide the knob of the POWER switch When the instrument is turned on, the Self-test screen will be displayed. -
Page 51: Quick Set
Quick Set The Quick Set function allows easy settings for minimum recording/measurement requirements by following the guidance. The setting proceeds in the following order: “1. Basic Settings,” “2. Device Connections,” “3. Voltage Wiring,” “4. Current Wiring,” “5. Wiring Check,” “6. Event Settings,” “7. Recording Settings,” and “8. Recording Start.”... -
Page 52: Adding Settings
Adding Settings 3.2 Adding Settings Using the following procedure, normal settings can be applied in combination with the Quick Set to perform recording as desired: Press the [QUICK SET] key to start the Follow the Quick Set to proceed with Quick Set. -
Page 53: Wiring (Wiring Screen)
Wiring (WIRING Screen) 4.1 Wiring Procedure Connect the voltage codes and the current sensors to the instrument according to the following procedure. This chapter explains the procedure for wiring without using the Quick Set. Setting the wiring method and the declared input voltage “4.2 Wiring Method and Declared Input Voltage Settings”... -
Page 54: Wiring Method And Declared Input Voltage Settings
Wiring Method and Declared Input Voltage Settings 4.2 Wiring Method and Declared Input Voltage Settings Press the [WIRING] key to display the WIRING, wiring settings screen. Sets the wiring method and declared input voltage. The wiring diagram (p. 50) of the specified wiring mode is displayed. Voltage value (RMS value) Current value (RMS value) Active power... - Page 55 Wiring Method and Declared Input Voltage Settings Enables you to select the wiring method for CH1 to CH3, and select ON/OFF of the input to CH4. 1P2W Single-phase 2-wire line 1P3W Single-phase 3-wire line Single-phase 3-wire line (1-voltage measurement) Although voltages should be usually input to 2 channels for the single- 1P3W1U phase 3-wire line, a voltage is input to only CH1 in a simplistic way.
-
Page 56: X84; Wiring Diagram
Wiring Method and Declared Input Voltage Settings Wiring diagram The vector diagram in the following screen example shows the measurement line in its ideal (balanced, power factor 1) state. Wiring Wiring selection selection Screens Screens vector vector diagram diagram 1P2W 1P3W 1P3W1U 3P3W2M... -
Page 57: Connecting Voltage Cords To Instrument
Connecting Voltage Cords to Instrument 4.3 Connecting Voltage Cords to Instrument Be sure to read “Handling Cords and Cables” (p. 8), “Using Voltage Cords” (p. 8). Connect a Model L1000-05 voltage cord to the voltage input terminal of this instrument. Secure the cords together with a spiral tube if necessary. -
Page 58: Connecting Current Sensors And Configuring Current Sensor Settings
Connecting Current Sensors and Configuring Current Sensor Settings 4.4 Connecting Current Sensors and Configuring Current Sensor Settings Be sure to read “Handling Cords and Cables” (p. 8). Connect the optional current sensor to the current input terminal of this instrument. •... -
Page 59: X84; Connecting Current Sensors Other Than The Optional Sensors
Connecting Current Sensors and Configuring Current Sensor Settings Connecting current sensors other than the optional sensors Press the [WIRING] key to display the Insert the connector of the current WIRING, wiring settings screen. sensor while checking the channel on the screen. Example: Model 9661 clamp on sensor 9661... -
Page 60: Zero Adjustment
Zero Adjustment 4.5 Zero Adjustment This function adjusts the DC components superimposing on voltage and current to zero. In order to obtain precise measurements, it is recommended to perform the zero adjustment in advance of the measurements after allowing the instrument to warm-up for more than 30 min. Press the [WIRING] key to display the... -
Page 61: Connecting Voltage Cords To Objects
Connecting Voltage Cords to Objects 4.6 Connecting Voltage Cords to Objects Be sure to read “Wiring” (p. 12). Connect the voltage cords to the measuring objects while checking the WIRING, wiring settings screen. Use alligator clips or Model 9243 Grabber Clip. Secondary side of breaker Securely clip the cords to metal parts such as bus bars and screws on the secondary side of the breaker. -
Page 62: Attaching Current Sensors To Objects
Attaching Current Sensors to Objects 4.7 Attaching Current Sensors to Objects Be sure to read “Wiring” (p. 12). Connect the current sensors to the measuring objects while checking the WIRING, wiring settings screen. Load current measurement Make sure that the current flow direction arrow points toward the load side, then clamp the conductor. -
Page 63: X84; Leakage Current Measurement
Attaching Current Sensors to Objects Leakage current measurement Clamp 1 line only. (Diagram A) Grounding wire measurement Clamp the electrical circuits together. (Diagram B) Batch Clamp 2 wires together in the single phase 2-wire system circuit, and 4 wires measurement in the 3-phase 4-wire system circuit. -
Page 64: Configuring Current Range Setting
Configuring Current Range Setting 4.8 Configuring Current Range Setting Check the current value in the WIRING, wiring settings screen and select an appropriate current range. Press the [WIRING] key to display the Check the current value (RMS value) WIRING, wiring settings screen. -
Page 65: Checking Wiring
Checking Wiring 4.9 Checking Wiring Press the [WIRING] key to display the WIRING, wiring check screen. This screen is used to check whether the instrument has been connected properly. Wiring judgment* Voltage level, Voltage value phase PASS range* (RMS value) Voltage phase vector* Voltage phase angle... - Page 66 Checking Wiring If the wiring judgment result is red (FAIL) or yellow (CHECK) Select an item to be checked. Review its contents. Move the cursor A dialog box with helpful information for fixing (Press the [ESC] key to close the dialog box) the wiring will be displayed.
- Page 67 Checking Wiring Wiring Judgment conditions Confirmation steps judgment items Voltage input To determine the voltage value based on • Has the declared input voltage been set the declared input voltage. correctly? 110% < CHECK • Are the voltage cords completely inserted 90% ≤...
- Page 68 Checking Wiring Wiring Judgment conditions Confirmation steps judgment items Voltage and FAIL will be displayed when each current • Are the voltage cords and current sensors current phase phase is not within 90° with respect to the connected in the right places? (On both difference voltage of each phase.
-
Page 69: Setting Change (Set Up Screen)
Setting Change (SET UP Screen) All settings can be changed on the SET UP screen. Press the [SET UP] key to display the SET UP screen. In addition to the [SET UP] key, you can switch to the SET UP screen from here also. -
Page 70: Measurement Settings
Measurement Settings 5.1 Measurement Settings SET UP, Measurement Settings 1 screen Press the [SET UP] key to display the SET UP, measurement settings 1 screen. Move the cursor Select See “4.5 Zero Adjustment” (p. 54). The wiring method, declared input voltage, current sensor and current range can be set on the “WIRING, Wiring Settings Screen”... - Page 71 Measurement Settings Enables you to set if an external VT is being used. Variable (0.01 to 9999.99), 1, 60, 100, 200, 300, 600, 700, 1000, 2000, 2500, 5000 While taking measurements on the secondary side of a voltage transformer (VT), if you set the VT ratio, you can display the voltage value by converting it to primary-side voltage values.
-
Page 72: Set Up, Measurement Settings 2 Screen
Measurement Settings Enables you to set if using an external CT. Variable (0.01 to 9999.99), 1, 40, 60, 80, 120, 160, 200, 240, 300, 400, 600, 800, 1200 While taking measurements on the secondary side of a current transformer (CT), if you set the CT ratio, you can display the current value by converting it to primary-side current values. - Page 73 Measurement Settings TREND Enables you to select whether to display the RMS voltage of screen in the form of line voltage or in phase voltage. Phase voltage (Line-N), Line voltage (Line-Line) For 1P2W, 1P3W Phase voltage For 3P3W2M Line voltage For 3P3W3M, 3P4W, phase voltage line voltage...
- Page 74 Measurement Settings Unit cost input method Select the unit cost. Change the value. When moving the decimal point : Move the cursor to the position of decimal point. Move the cursor : Change the location of the decimal point. When changing the value : Move the cursor to the digit that you wish to change.
-
Page 75: Recording Settings
Recording Settings 5.2 Recording Settings Press the [SET UP] key to display the SET UP, recording settings screen. Perform the settings regarding recording (storage). The maximum recording period is up to 1 year and then the recording stops automatically. Move the cursor Select •... - Page 76 Recording Settings Enables you to set the method used to start recording. Manual Recording starts immediately after the [START/STOP] key is pressed. After the [START/STOP] key is pressed, recording starts at the set time. (If the set time has already passed when the key is pressed, “Interval” starting Specified time method will be used.) YYYY-MM-DD hh:mm...
- Page 77 Recording Settings Enables you to set the folder name and file name used to save the data. See “10.2 Folder and File Structure” (p. 118) Sets variable folder name in the dialog. (maximum 5 half-width characters) If recording and measurement are performed again without changing [Folder/file name], sequentially numbered (00 to 99) folders will be automatically created, and the data will be saved there.
-
Page 78: Event Settings
Event Settings 5.3 Event Settings An event will occur using the set threshold value on this screen as the basis. For more information about events, see “Appx. 3 Explanation of Power Quality Parameters and Events” (p. Appx.4), “Appx. 4 Event Detection Methods” (p. Appx.8). SET UP, Event Settings 1 screen Press the... - Page 79 Event Settings Enables you to set the threshold value of the frequency (200 ms). (Only U1) OFF, 0.1Hz 9.9Hz Enables you to set the threshold value of the frequency (1 wave). (Only U1) OFF, 0.1Hz 9.9Hz Enables you to set the threshold value of the voltage total harmonic distortion. OFF, 0.0% 100.0%...
-
Page 80: Set Up, Event Settings 2 Screen
Event Settings SET UP, Event Settings 2 screen Move the cursor Switch between Change the value ON and OFF Enables you to select the timer event. The timer events are recorded at the set intervals. OFF, 1min, 2min, 5min, 10min, 15min, 30min, 1hour, 2hour Select for using an external event. -
Page 81: System Settings
System Settings 5.4 System Settings Press the [SET UP] key to display the SET UP, System settings screen. Serial number of this instrument Software version of this instrument FPGA version of this instrument Move the cursor Select Enables you to set the date and time. (The seconds cannot be set. -
Page 82: X84; System Reset (Default)
System Settings System reset (Default) Move the cursor to the system reset and press [ENTER] key to reset the system settings of this instrument. (Factory settings: p. 78) Perform if the instrument is operating in an odd or unexpected manner with no clear cause. Move the cursor All settings other than the measurement frequency, clock, language, and communication settings (LAN and RS-232C) are initialized to their factory settings. -
Page 83: X84; Factory Reset (Default)
System Settings Factory reset (Default) If you perform the factory reset, all settings, including frequency, language, and communications settings will revert to their factory settings (p. 78). The internal memory will be erased. Turn off the instrument. (p. 44) Turn on the instrument while holding down the [ENTER] [ESC]... -
Page 84: X84; Factory Settings
System Settings Factory settings All the default settings are as follows: *1: Checked parameters () are the parameters that are not initialized in quick set. *2: Checked parameters () are the parameters that are not initialized during the system reset. These are initialized in the factory reset only. - Page 85 System Settings Screens items Default values Event settings 1 Transient CH123: CH4: Swell Interruption Frequency (200 ms) Frequency (1 wave) Voltage total harmonic distortion Inrush current CH123: CH4: Current total harmonic CH123: distortion CH4: Hysteresis Event settings 2 Timer event External event Event waveform recording time...
- Page 86 System Settings...
-
Page 87: Verifying The Waveform
Verifying the Waveform, Measured Values (MONITOR Screen) You can view the measured waveforms and measured values on the MONITOR screen. Press the [MONITOR] key to display the MONITOR screen. Elapsed time Recording start time and date In addition to the [MONITOR] key, you can also switch to the MONITOR... -
Page 88: Verifying The Voltage Waveform And Current Waveform
Verifying the Voltage Waveform and Current Waveform 6.1 Verifying the Voltage Waveform and Current Waveform Press the [MONITOR] key to display the MONITOR, Waveform screen. The voltage waveforms and current waveforms of up to 4 channels are overlapped and displayed. The color of waveform is same as the phase color. -
Page 89: Y Axis) Of The Waveform
Verifying the Voltage Waveform and Current Waveform Changing the zoom factor for the vertical axis and horizontal axis (X and Y axis) of the waveform Move the cursor Select Enables you to set the zoom factor for the vertical axis (Y axis) of the waveform (U: voltage, I: current). -
Page 90: Verifying The Electric Power (List Of Numerical Values)
Verifying the Electric Power (List of Numerical Values) 6.2 Verifying the Electric Power (List of Numerical Values) Press the [MONITOR] key to display the MONITOR, Electric power screen. RMS current Frequency (average value RMS voltage for a period of 200 ms) Apparent Reactive power power... -
Page 91: Verifying The Electric Energy
Verifying the Electric Energy 6.3 Verifying the Electric Energy Press the [MONITOR] key to display the MONITOR, Electric energy screen. Active power Apparent power Reactive power PF: Power factor DPF: Displacement power factor (Not displayed for 3-phase 3-wire line) See Calculation method (p. 66). Active energy (WP+: consumption, WP-: regeneration) Reactive energy (WQ_LAG: lag, WQ_LEAD: lead) Energy cost... -
Page 92: Verifying The Voltage Details
Verifying the Voltage Details 6.4 Verifying the Voltage Details Press the [MONITOR] key to display the MONITOR, Voltage screen. Average value of the channels Voltage total harmonic distortion (calculation method THD-F / THD-R) Voltage waveform peak (-) See Calculation method (p. 66). Voltage waveform peak (+) RMS voltage Voltage crest factor... -
Page 93: Verifying The Current Details
Verifying the Current Details 6.5 Verifying the Current Details Press the [MONITOR] key to display the MONITOR, Current screen. Current total harmonic distortion (calculation method THD-F / THD-R) See Calculation method (p. 66). Current waveform peak (-) Current crest factor Current waveform peak (+) ([absolute value of current waveform peak]/[RMS current]) -
Page 94: Verifying The Vector
Verifying the Vector 6.6 Verifying the Vector Press the [MONITOR] key to display the MONITOR, Vector screen. The voltage and current phase relationships for each harmonic order of the CH1 to CH4 are displayed in the vector diagram. Measured value of frequency Move the cursor Select... -
Page 95: Verifying The Harmonics Graph And Harmonics Numerical Values
Verifying the Harmonics Graph and Harmonics Numerical Values 6.7 Verifying the Harmonics Graph and Harmonics Numerical Values Press the [MONITOR] key to display the MONITOR, Harmonics: graph screen or MONITOR, Harmonics: list screen. You can switch between the harmonics graph and harmonics numerical values by using the [F2] key. - Page 96 Verifying the Harmonics Graph and Harmonics Numerical Values Set the number of harmonic order to be displayed. The Cursor moves to the selected order. MONITOR, Harmonics: list screen Measured value of frequency Move the cursor Select Total harmonic distortion Example: 41.5th order Interharmonics *: See calculation method (p.
-
Page 97: Recording (Save) (Set Up Screen)
Recording (Save) (SET UP Screen) 7.1 Start and Stop of the Recording [START/STOP] Press the key to start or stop the recording by the method which is described on SET UP, Recording settings screen (p. 69). The measurement data is stored to SD memory card. (If no SD memory card is inserted, data will be saved in the instrument’s internal memory.) See “File Saving and Operations (FILE Screen)”... - Page 98 Start and Stop of the Recording Start recording at an appropriate time punctuation Recording start: interval, recording stop: manual set time Example: Recording interval is set to 10 min WAITING RECORDING Present time Recording start 10:41:22 10:50:00 If the recording interval is 30 sec or below, the recording will start at “10:42:00.” Repeat recording Recording start: repeat,...
- Page 99 Start and Stop of the Recording Status of the recording operation It can be determined from the background color of the screen and lighting state of the START/ STOP LED. Screen background Operation status Gray (no character): (START/STOP LED: Off) •...
-
Page 100: Using The Instrument During An Interruption
Using the Instrument During an Interruption 7.2 Using the Instrument During an Interruption If the supply of power to the instrument is cut off while recording is in progress, measurement operation will stop during the interruption. The setting conditions will be backed up. When the power supply is restored, the recording will reset once and it will be resumed as a new recording. -
Page 101: Verifying The Trends
Verifying the Trends (Fluctuations) in Measured Values (TREND Screen) You can view the measured value fluctuations as a time series graph on the TREND screen. Press the [TREND] key to display the TREND screen. Elapsed time Recording start time and date In addition to the [TREND] key, you can also switch to the... -
Page 102: Measurement)
Verifying the measured value and time at the cursor position (cursor measurement) If you press the [F3] (Cursor) key, the measured value and time at the position of cursor will also be displayed along with the cursor. You can move the position of the cursor by using the keys. -
Page 103: X84; Event Search
Event search Select an event mark to be checked. Move the cursor For switching the screen display of the EVENT MONITOR screen [MONITOR] Press the key. For closing the EVENT MONITOR screen Press the [F5] (End) key. EVENT MONITOR The screen switches to the screen (p. -
Page 104: Verifying The Basic Trend
Verifying the Basic Trend 8.1 Verifying the Basic Trend Press the [TREND] key to display the TREND, Basic trend screen. This screen is used to check fluctuation width of maximum, minimum and average values between recording intervals. (The maximum, minimum, and average values are calculated incessantly after every 200 ms.) MAX: Maximum value AVG: Average value MIN: Minimum value... - Page 105 Verifying the Basic Trend Enables you to set the display parameters. Freq Frequency (200 ms) Freq10s Frequency (10 sec) Urms RMS voltage (200 ms) Upk+ Voltage waveform peak (+) Upk- Voltage waveform peak (-) Voltage DC value Voltage crest factor Uthd Voltage total harmonic distortion (calculation method THD-F / THD-R) Uunb...
-
Page 106: Verifying The Detail Trend
Verifying the Detail Trend 8.2 Verifying the Detail Trend Press the [TREND] key to display the TREND, Detail Trend screen. You can check the fluctuation range of the maximum value and minimum value during the recording intervals. (The fluctuation range of the maximum and minimum value is calculated per wave or per half wave.) MAX: Maximum value MIN: Minimum value... -
Page 107: Verifying The Electric Energy
Verifying the Electric Energy 8.3 Verifying the Electric Energy Press the [TREND] key to display the TREND, Electric energy screen. This screen is used to check electric energy trends for each recording interval. Since all the items are updated after every 1 s, the data is updated after every 1 s, when the recording interval is below 1 s. -
Page 108: Verifying The Demand (Available After The Firmware Update)
Verifying the Demand (Available after the firmware update) 8.4 Verifying the Demand (Available after the firmware update) Press the [TREND] key to display the TREND, Demand screen. -
Page 109: Verifying The Harmonic Trend (Available After The Firmware Update)
Verifying the Harmonic Trend (Available after the firmware update) 8.5 Verifying the Harmonic Trend (Available after the firmware update) Press the [TREND] key to display the TREND, Harmonic trend screen. -
Page 110: Verifying The Flicker (Available After The Firmware Update)
Verifying the Flicker (Available after the firmware update) 8.6 Verifying the Flicker (Available after the firmware update) Press the [TREND] key to display the TREND, Flicker screen. -
Page 111: Checking Events (Event Screen)
Checking Events (EVENT Screen) EVENT screen is used to view the list of events that have occurred and trend data of the events. (Event statistics process: Version upgrade supported) For more information on events, see “Appx. 3 Explanation of Power Quality Parameters and Events”... - Page 112 Save items (event waveform, event trend data) change depending on the event items. Event waveform Approx. 200 ms waveform data (Data sampled at 200 kS/s reduced to 12.5 kS/s) Transient Approx. 3 ms waveform data waveform (Data sampled at 200 kS/s) (available after the firmware update) Event trend data...
- Page 113 Saved data Screen Event parameter IN/OUT Measurement Items Event display Event trend data waveform Current total Ithd IN/OUT All instantaneous — harmonic values distortion • Frequency • Voltage Timer event Timer — — • Current • Power External event —...
-
Page 114: Checking Event List
Checking Event List 9.1 Checking Event List Press the [EVENT] key to display EVENT, Event list screen. Events can be checked on the list. The events are sorted in the order of occurrence. Date of event Time of event Number of events Event No. -
Page 115: X84; Checking Event Details
Checking Event List Time Time of event Threshold Threshold value with event (measured value) Measured Measured value when an event was detected value If a transient overvoltage event occurred, the transient width is also displayed. Duration Indicates the period after which the reading returned after the threshold value was exceeded, or the period from IN to OUT. -
Page 116: Checking Event Status
Checking Event Status 9.2 Checking Event Status Use the following procedure to display the EVENT MONITOR screen. Waveforms and measured values of the event can be checked. Press the [EVENT] key to display Select an event No. to be analyzed. EVENT, Event list screen. -
Page 117: X84; Switching Event Monitor Screen
Checking Event Status Switching event monitor screen [EVENT] [MONITOR] When event monitor is displayed, keys are lit. Display/switch screen: [MONITOR] Event trend data screen (p. 112) Waveform screen (p. 82)* Voltage and current waveforms of CH1 through CH4 are displayed. Electric power screen (p. -
Page 118: X84; Checking Trend Data On Event
Checking Event Status Checking trend data on event Event trend data of swell, dip, interruption, and inrush current event for 30 s (0.5 s before Event IN, 29.5 s after Event IN) is displayed in a time series graph. How to display the EVENT MONITOR screen: p. 110 Voltage trend data on a swell, dip, or interruption event (Urms1/2) •... -
Page 119: X84; Checking Transient Waveforms During An Event (Available After The Firmware Update)
Checking Event Status Checking transient waveforms during an event (Available after the firmware update) - Page 120 Checking Event Status...
-
Page 121: File Saving And Operations (File Screen)
File Saving and Operations (FILE Screen) The instrument can save the following data on an SD memory card or in its internal memory. SD memory Internal File contents Extension Format card memory Screen copy data Binary — Setting data Binary ... -
Page 122: Viewing And Using File Mode Screen
Viewing and Using FILE Mode Screen 10.1 Viewing and Using FILE Mode Screen Press the [FILE] key to display the FILE screen. FILE, SD card screen Folder hierarchy Occupied memory size SD memory card size FILE, Internal memory screen Occupied memory size Internal memory size... - Page 123 Viewing and Using FILE Mode Screen Keys Description Navigates within the folder hierarchy. Selects folders and files. Navigates to lower hierarchy when a folder is selected. Loads setting data (p. 123). Loads measured data (p. 124). (Load) Enables the state which allows the removal of the SD memory card during recording (p.
-
Page 124: Folder And File Structure
Folder and File Structure 10.2 Folder and File Structure SD memory card PQ3100 base folder is required for the instrument to save data on the SD memory card. If the PQ3100 base folder does not exist on the SD memory card, it will be created automatically when a file is created. - Page 125 Folder and File Structure Folder for saving screen copies File name: Time saved manually Folder name: Date saved hhmmss.BMP hhmmss.BMP YYMMDD PQ3100 HARDCOPY … YYMMDD Up to 32 GB File name: Snnnn.SET S0001.SET Folder for saving setting data files “nnnn” shows sequential number SETTING S0002.SET...
-
Page 126: X84; Internal Memory
Folder and File Structure Internal memory If no SD memory card is inserted or if there is no free space in the SD memory card, data will be stored in the instrument’s internal memory. Only the setting data and the trend record data are stored in the internal memory. -
Page 127: Screen Hard Copy
Press the [COPY] key. Screen copy data is saved in the /PQ3100/ HARDCOPY folder of the SD memory card. If no SD memory card has been inserted, screen copy data cannot be saved. Checking images (Available after the firmware update) -
Page 128: Saving Setting Files
FILE, Internal memory screen. appears on the screen) Save the setting file. The setting file will be saved. Save to folder On the FILE, SD card screen: /PQ3100/SETTING FILE, Internal memory On the screen: /SETTING Save Sample screen: FILE, SD card screen... -
Page 129: Loading Setting Files
Select a settings file (.SET) to load. Navigate within Load Select hierarchy SD memory card: The setting file will be loaded to the instrument. /PQ3100/SETTING Internal memory: /SETTING The measured data save folder also has the setting file used during the measurement. -
Page 130: Loading Measured Data
Navigate within Select hierarchy Load (as necessary) Folder for the measured data SD memory card: /PQ3100/YYMMDDXX /PQ3100/HIOKI (desired folder name)XX Internal memory: /YYMMDDXX /HIOKI (desired folder name)XX Screen sample:... -
Page 131: Copy From The Internal Memory To Sd Memory Card
Copy from the Internal Memory to SD Memory Card 10.7 Copy from the Internal Memory to SD Memory Card This section describes how to copy folders and files of the internal memory to the SD memory card. Verify that an SD memory card has been Press the [FILE] key to display the... -
Page 132: Formatting Sd Memory Card (Deleting All Files)
• Be sure to use the instrument to format SD memory cards. The instrument can only save data to SD memory cards that have been initialized with the dedicated SD format (The format of Hioki’s optional SD memory cards is dedicated SD format). -
Page 133: Removing Sd Memory Card During Recording
Removing SD Memory Card during Recording 10.10 Removing SD Memory Card during Recording Removing an SD memory card while recording data to the card may damage the data. To remove the SD memory card safely during recording, saving data to the SD memory card can be stopped. Only when the recording interval is set to 2 s or more, the SD memory card can be removed. - Page 134 Formatting SD Memory Card (Deleting All Files)
-
Page 135: Analysis (With Computer)
Analysis (with Computer) This section describes how to load data recorded with the instrument onto a computer and analyze the data using the supplied application software, PQ One. Refer to Application Software Instruction Manual (CD). Included application software Recording data Supported software File contents Extension... -
Page 136: X84; Use Of Sd Memory Cards
Copying Files Use of SD Memory Cards Be sure to read “Using SD Memory Cards” (p. 10) before use. Screen sample: Windows 10 Verify that recording has stopped. Eject the SD memory card from the instrument. Insert the SD memory card into the SD Click the Start button, and then, click memory card slot on the computer. -
Page 137: X84; Use Of Usb Cable
Copying Files Use of USB Cable Be sure to read “Using USB Connector (USB Cable)” (p. 12) before use. The USB cable included is used to connect the instrument with a computer and copy data from the SD memory card to the computer. Turn on the computer. - Page 138 Copying Files Disconnecting the USB cable from the computer To disconnect a USB cable connected to the instrument from a computer which is ON: Press the [ESC] key to terminate the Disconnect the USB cable from the USB connection. computer. Alternately, eject the disk by using the [Safely Remove Hardware and Eject Media]...
-
Page 139: Use Of Application Software Pq One (Included)
Use of Application Software PQ One (Included) 11.2 Use of Application Software PQ One (Included) What can be done with the application software The application software PQ One (included) is used for analyzing the data from the instrument (binary-format) on a computer. Displays and analyzes measurement data Event statistics function allows analyzing measured data in detail. -
Page 140: X84; Installation
The Adobe Reader must be installed on your computer to view the Instruction Manual. (Adobe Reader can be downloaded from the Adobe website.) To request a paper copy of the user manual, contact an authorized Hioki distributor or reseller. You can purchase the manuals. -
Page 141: Installation Procedure
Use of Application Software PQ One (Included) Installation procedure Screen sample: Windows 10 Start the computer. Set the included CD to the CD-ROM Administrator authority may be required for the drive. installation. Click the Start button, and then, click Click This PC, and then, double-click File Explorer to start Explorer CD-ROM drive. - Page 142 Use of Application Software PQ One (Included)
-
Page 143: Communications (Usb/ Lan/Rs-232C)
142 through an internet browser Configuration of the settings, acquiring the measurement data, and downloading the data from the — Contact Hioki. computer voluntarily, can be done by using communication command. : Supported, —: Not supported... -
Page 144: Preparing For Lan Communications
Preparing for LAN Communications 12.1 Preparing for LAN Communications To use LAN communications, you must perform the following tasks: • Configure LAN settings in the instrument. (See the following “Settings”) • Build a network environment. (p. 139) • Connect the instrument and a computer with a LAN cable. (p. 140) Settings (SET UP Screen) -
Page 145: X84; Example Of Establishing A Network Environment
Preparing for LAN Communications Example of establishing a network environment (1) Connecting the instrument to an existing network To connect to an existing network, the network system administrator (IT department) has to assign the settings beforehand. The settings must not overlap with another device. Obtain assignments from the administrator (IT department) for the following items, and write them down. -
Page 146: X84; Connection
Preparing for LAN Communications Connection Be sure to read “Connecting the Instrument to an External Device” (p. 13). (1) When connecting the instrument to an existing network, or when connecting the multiple instruments to a single computer using a hub Required items ... - Page 147 Preparing for LAN Communications Example of Remote Control Using Wireless LAN Computer Wireless LAN router Tablet computer...
-
Page 148: Remote Control Of The Instrument Through The Internet Browser (Lan Communications Only)
Remote Control of the Instrument through the Internet Browser (LAN Communications Only) 12.2 Remote Control of the Instrument through the Internet Browser (LAN Communications Only) This instrument includes a standard HTTP server function that supports the remote control through the Internet browser on a computer. The instrument’s display screen and control panel are emulated in the browser. -
Page 149: X84; Remote Operation
Remote Control of the Instrument through the Internet Browser (LAN Communications Only) If no HTTP screen is displayed (1) Verify the settings of the Internet browser. On the Internet Explorer settings, click On the Advanced tab, enable the “Use Tools-Internet Options. -
Page 150: X84; Restrict The Access (Password Settings)
Remote Control of the Instrument through the Internet Browser (LAN Communications Only) Restrict the access (password settings) (In the case of setting a password) 1. Enter all the passwords 2. Click Enter up to four alphanumeric characters. When setting a password for the first time, enter “0000”... -
Page 151: Rs-232C Communication Preparations
RS-232C Communication Preparations 12.3 RS-232C Communication Preparations To use RS-232C communications, you must perform the following tasks. • Configure the settings of RS-232C on the instrument. • Connect the instrument and a computer with a RS-232C cable (p. 174). Settings (SET UP screen) Be sure to read “Connecting the Instrument to an External Device”... - Page 152 Remote Control of the Instrument through the Internet Browser (LAN Communications Only)
-
Page 153: External I/O
When you connect the event output terminal there is an anomaly operation. to a trigger input terminal on a waveform recording device such as the Hioki Memory See “13.1 Event Input” (p. 148). HiCorder, you can record waveforms on the Memory HiCorder when an event occurs. -
Page 154: Event Input
Event Input 13.1 Event Input Event input function is used to enable recording of the voltage and current waveforms and measured values of an external event. This function is useful to analyze power anomalies that may occur when other electronic/electrical devices are started. -
Page 155: Event Output
)” and “Ground terminal 1 2 3 4 for event output (non-isolated) (GND2)” are connected to an external device. Hioki are isolated from the internal circuit of the instrument. Memory HiCorder Connect terminal to an external power supply through a pull-up See “13.4 Connection”... -
Page 156: External Event Output Settings (Set Up Screen)
External Event Output Settings (SET UP Screen) Timing chart ― ― ― ― ―― ― ― EVENT OUT High Short pulse setting: Approx. 10 ms Long pulse setting: Approx. 2.5 s 13.3 External Event Output Settings (SET UP Screen) Set when using the external I/O terminal to connect the instrument to an external device. Press the [SET UP] key to display the... -
Page 157: Connection
Connection 13.4 Connection Be sure to read “Using External I/O Terminals” (p. 13) before start. Required items Wires Slotted screwdriver • Shaft diameter φ3 mm • Blade width: 2.6 mm Recommended wire Single wire: φ0.65 mm (AWG22) Stranded wire: 0.32 mm (AWG22) Strand diameter:... - Page 158 Connection...
-
Page 159: Specifications
Specifications 14.1 General Specifications Operating environment Indoor use, pollution degree 2, altitude up to 3000 m (9843 ft.) At an altitude of above 2000 m (6562 ft.), the measurement categories are lowered to 1000 V CAT II, 600 V CAT III. Operating temperature Temperature: −20°C to 50°C (−4°F to 122°F) and humidity... - Page 160 General Specifications Accessories See “Accessories” (p. 2). Options See “Options” (p. 3).
-
Page 161: Input Specifications/Output Specifications/Measurement Specifications
Current: 4 channels Input Terminal Voltage: Plug-in terminal (Safety terminal) Specifications Current: Special connector (Hioki PL14) Current sensor power For AC/DC Auto-Zero Current Sensor, AC Flexible Current Sensor supply +5 V±0.25 V, −5 V±0.25 V, supply current up to 30 mA per channel... - Page 162 Input Specifications/Output Specifications/Measurement Specifications Measurement items (1) Item detected at a sampling frequency of 200 kHz with no gaps Notation 1P2W 1P3W 1P3W1U 3P3W2M 3P3W3M 3P4W Transient overvoltage Tran 1, 4 1, 2, 4 1, 4 1, 2, 4 1, 2, 3 1, 2, 3, 4 (2) Items measured each 1 cycle with no gaps Notation...
- Page 163 Input Specifications/Output Specifications/Measurement Specifications Notation 1P2W 1P3W 1P3W1U 3P3W2M 3P3W3M 3P4W Energy cost Ecost Reactive power 1, 2, SUM 1, 2, 3, SUM Reactive energy WQ_LAG, WQ_LEAD Apparent power 1, 2, SUM 1, 2, 3, SUM Apparent energy Power factor / displacement power PF/DPF 1, 2, SUM...
- Page 164 Accuracy specifications Conditions of Guaranteed accuracy period: 1 year guaranteed accuracy Guaranteed accuracy period from adjustment made by Hioki: 1 year Temperature and humidity for guaranteed accuracy: 23°C±5°C (73°F±5°F), 80% RH or less Warm-up time: at least 30 min Power supply frequency range: 50 Hz/60 Hz ± 2 Hz...
- Page 165 Input Specifications/Output Specifications/Measurement Specifications Frequency cycle measurement specifications Freq_wav Measurement method Reciprocal method Frequency calculated from the reciprocal of the accumulated time over a 1-cycle time on U1 (reference channel) Displayed items Frequency obtained over a 1-cycle time, maximum deviation between event IN and event OUT Measurement range 70.000 Hz...
- Page 166 Input Specifications/Output Specifications/Measurement Specifications Swell measurement specifications Swell Measurement method Detected when the RMS voltage refreshed each half-cycle exceeds the threshold value. Displayed items Swell height: Maximum value for RMS voltage refreshed each half-cycle [V] Swell duration: Period from when a swell is detected on any one of U1, U2, or U3 to when a measured value fall below the value obtained by subtracting the hysteresis from the threshold value Measurement range...
- Page 167 Input Specifications/Output Specifications/Measurement Specifications 10. Interruption measurement specifications Intrpt Measurement method Detected when the RMS voltage refreshed each half-cycle falls below the threshold value. Displayed items Interruption depth: Worst value for RMS voltage refreshed each half-cycle [V] Interruption duration: Period from the time a U1 to U3 interruption is detected until the reading exceeds the value obtained by adding the hysteresis to the threshold value.
- Page 168 Input Specifications/Output Specifications/Measurement Specifications 12. Frequency 10 s measurement specifications Freq10s Measurement method Reciprocal method Frequency calculated from the reciprocal of the accumulated time for 10 s on U1 (reference channel) Displayed items Frequency Measurement range 70.000 Hz Measurement accuracy ±0.010 Hz or less 13.
- Page 169 Input Specifications/Output Specifications/Measurement Specifications 16. RMS voltage measurement specifications Urms Measurement method Measured during the 200-ms aggregation period in accordance with IEC61000-4-30 When set to 3P3W3M or 3P4W (or 3P4W2.5E [available after the firmware update]), the phase voltage and line voltage setting is applied to the RMS voltage, Urms Displayed items RMS voltage on each channel AVG (average) RMS voltage on multiple channels...
- Page 170 Input Specifications/Output Specifications/Measurement Specifications 21. Current CF value measurement specifications Measurement method Calculated from the RMS current and the peak value of the current waveform. Displayed items Current CF Value Measurement range 408.00 Measurement accuracy Accuracy not defined 22. Active power measurement specifications Measurement method Measured every 200 ms.
- Page 171 Input Specifications/Output Specifications/Measurement Specifications 24. Reactive power measurement specifications Measurement method RMS value calculation: Calculated from apparent power S and active power P Fundamental wave calculation: Calculated from fundamental wave voltage and current. Lag phase (LAG: current lags the voltage): Unsigned Lead phase (LEAD: current leads the voltage): Negative Displayed items Reactive power on each channel...
- Page 172 Input Specifications/Output Specifications/Measurement Specifications 27. Power factor and displacement power factor measurement specifications PF, DPF Measurement method Power Factor: Calculated from apparent power S and active power P Displacement Power Factor: Calculated according to fundamental wave active power and reactive power (Data update: Every 1 s) Lag phase (LAG: current lags more than the voltage): Positive Lead phase (LEAD: current leads more than the voltage): Negative Displayed items...
- Page 173 Input Specifications/Output Specifications/Measurement Specifications 29. Harmonic power measurement specifications Pharm Measurement method Indicates harmonic power for each channel and the sum for multiple channels (For details, see Calculation Formula.) Analysis window width 10 cycles/12 cycles Window point count Rectangular 2,048 points Displayed items From 0th to 50th order Options for RMS and content percentage...
- Page 174 Input Specifications/Output Specifications/Measurement Specifications 32. Harmonic voltage and current phase difference measurement specifications Pphase Measurement method Uses IEC61000-4-7 Ed2.1: 2009 Analysis window width 10 cycles/12 cycles Window point count Rectangular 2,048 points Displayed items Indicates the difference between the harmonic voltage phase angle and the harmonic current phase angle (including fundamental wave component).
-
Page 175: Flagging Concept
Flagging Concept 35. Current unbalance factor (negative-phase unbalance factor, zero-phase unbalance factor) measurement specifications Iunb, Iunb0 Measurement method Calculated using the fundamental current component of each 3-phase in the 3-phase 3-wire (3P3W2M, 3P3W3M) and 3-phase 4-wire wiring (For details, see Calculation Formula.). -
Page 176: Quick Set Specifications
QUICK SET Specifications 14.4 QUICK SET Specifications QUICK SET screen Start confirmation Confirmation of whether to launch the settings after initialization of the concerned measurement settings and recording settings Basic settings CH123: 1P2W/1P3W/1P3W1U/3P3W2M/3P3W3M/3P4W 3P4W2.5E (available after the firmware update) CH4: OFF/ON Connected devices Diagrams for connecting voltage codes and current sensors as well as inserting SD memory card... - Page 177 QUICK SET Specifications Easy settings course Course Voltage events Inrush current Trend record only EN50160 Setting items Wiring Set in advance Current sensor Set in advance Current range Switches to an upper range when Set in advance the reference value Set in advance is 1/5th or more of the rated range...
-
Page 178: Event Specifications
Event Specifications 14.5 Event Specifications Event detection method It can be detected in the recording interval of 1 s or more. The detection method relative to measured values for each event target is listed in the measurement specifications. External events: Event is detected by detecting the signal towards the EVENT IN terminal. -
Page 179: Interface Specifications
Interface Specifications 14.6 Interface Specifications SD memory card Slot SD standard compliant × 1 Compatible card SD memory card/ SDHC memory card (Use only Hioki-approved card) Format SD memory card format Supported memory SD memory card: up to 2 GB capacity... - Page 180 Interface Specifications RS-232C interface Connector D-sub 9-pin × 1 Method Compliance with RS-232C “EIA RS-232D,” “CCITT V.24,” and “JIS X 5101.” Transmission mode Full-duplex, start-stop synchronization method Communication speed 19 200 bps / 38 400 bps Data length 8 bits Parity check None Stop bit...
-
Page 181: Calculation Formula
Calculation Formula 14.7 Calculation Formula The 3P4W2.5E wiring will be available after the firmware update. RMS voltage refreshed each half-cycle (Urms1/2), Dip, Swell, Interruption (Intrpt), RMS current refreshed each half-cycle (Irms1/2), Inrush current (Inrush) Wiring Single phase Single phase 3-phase 3-wire 3-phase 3-wire 3-phase 4-wire 2-wire... - Page 182 Calculation Formula Voltage waveform peak (Upk), Voltage crest factor (Ucf), Current waveform peak (Ipk), Current crest factor (Icf) Wiring Single phase Single phase 3-phase 3-wire 3-phase 3-wire 3-phase 4-wire 2-wire 3-wire 3P3W2M 3P3W3M 3P4W 1P2W 1P3W Item Upk+ Upk− [V]=Up During 1P3W1U Without Up •...
- Page 183 Calculation Formula RMS voltage (Urms), RMS current (Irms) Wiring Single phase Single phase 3-phase 3-wire 3-phase 3-wire 3-phase 4-wire 2-wire 3-wire 3P3W2M 3P3W3M 3P4W 1P2W 1P3W Item Urms Line voltage Phase voltage [Vrms]=U − ∑ − −U − ∑ − −...
- Page 184 Calculation Formula Active power (P) Wiring Single phase Single phase 3-phase 3-wire 3-phase 3-wire 3-phase 4-wire 2-wire 3-wire 3P3W2M 3P3W3M 3P4W 1P2W 1P3W Item P [W] − ∑ During 1P3W1U × =−U • The polarity symbols of active power P, indicate the current flow direction of the power during consumption (+P), and during regeneration (−P).
- Page 185 Calculation Formula Apparent power (S) Wiring Single phase Single phase 3-phase 3-wire 3-phase 3-wire 3-phase 4-wire 2-wire 3-wire 3P3W2M 3P3W3M 3P4W 1P2W 1P3W Item S [VA] PF/Q/S calculation selection: RMS value calculation • S and S of 3P3W3M uses phase voltage, while S uses line voltage.
- Page 186 Calculation Formula Power factor (PF), Displacement power factor (DPF) Single phase Single phase Wiring 3-phase 3-wire 3-phase 3-wire 3-phase 4-wire 2-wire 3-wire 3P3W2M 3P3W3M 3P4W Item 1P2W 1P3W PF [ ] PF/Q/S Calculation Selection: RMS value calculation • Si: indicates lag and lead. The sign of reactive power Q (fundamental wave reactive power) is used. Sign +: lag Sign −: lead •...
- Page 187 Calculation Formula 10. Voltage negative-phase unbalance factor (Uunb), Voltage zero-phase unbalance factor (Uunb0), Current negative-phase unbalance factor (Iunb), Current zero-phase unbalance factor (Iunb0) Single phase Single phase Wiring 3-phase 3-wire 3-phase 3-wire 3-phase 4-wire 2-wire 3-wire 3P3W2M 3P3W3M 3P4W Item 1P2W 1P3W Uunb[%]...
- Page 188 Calculation Formula 11. Harmonic voltage (Uharm), Harmonic current (Iharm), Interharmonic voltage (Uiharm), Interharmonic current (Iiharm) Single phase Single phase Wiring 3-phase 3-wire 3-phase 3-wire 3-phase 4-wire 2-wire 3-wire 3P3W2M 3P3W3M 3P4W Item 1P2W 1P3W Uharm [Vrms]=U (including adjacent interharmonic components) U’...
- Page 189 Calculation Formula 12. Harmonic power (Pharm), Harmonic reactive power (Qharm), K factor (KF) Wiring Single phase Single phase 3-phase 3-wire 3-phase 3-wire 3-phase 4-wire 2-wire 3-wire 3P3W2M 3P3W3M 3P4W Item 1P2W 1P3W Pharm [W]=P × × During 1P3W1U =−U sumk sumk •...
- Page 190 Calculation Formula 13. Harmonic voltage phase angle (Uphase), Harmonic current phase angle (Iphase), Harmonic power phase angle (Pphase) Single phase Single phase Wiring 3-phase 3-wire 3-phase 3-wire 3-phase 4-wire 2-wire 3-wire 3P3W2M 3P3W3M 3P4W Item 1P2W 1P3W φ U φ U φ...
- Page 191 Calculation Formula 14. Voltage THD (Uthd-F/Uthd-R), Current THD (Ithd-F/Ithd-R) Wiring Single phase Single phase 2-wire 3-phase 3-wire 3-phase 3-wire 3-phase 4-wire 3-wire 1P2W 3P3W2M 3P3W3M 3P4W Item 1P3W THD-F_U THD-F_U THD-F_U THD-F_U THD-F_U Uthd-F ∑ [%]=THD-F_ THD-F_U THD-F_U THD-F_U THD-F_U THD-F_U THD-F_U ×...
- Page 192 Calculation Formula 15. Averaging method CH 1 to 4 sum/AVG Comment Freq Signed average Freq10s is similar as well Upk (+/−) Signed average Ipk (+/−) Signed average Calculated from the average of Upk (absolute values of the positive one or the negative one, whichever is larger) and the average of Urms.
- Page 193 Calculation Formula CH 1 to 4 sum/AVG Comment Pharm (Content {(N-th order harmonic average value) percentage) / (Fundamental average value)} × 100% Uphase Vector average Iphase Vector average Pphase Vector average Uthd-F/Uthd-R Calculated from mean squared RMS values Ithd-F/Ithd-R Calculated from mean squared RMS values Calculated from mean squared RMS values...
-
Page 194: Range Configuration And Combination Accuracy
Range Configuration and Combination Accuracy 14.8 Range Configuration and Combination Accuracy The 3P4W2.5E wiring is available after the firmware update. While using the Model CT7131 AC Current Sensor Power range configuration Current range Wiring 5.0000 A 50.000 A 100.00 A 1P2W 5.0000 kW 50.000 kW... - Page 195 Range Configuration and Combination Accuracy While using the Model CT7126 AC Current Sensor Power range configuration Current range Wiring 500.00 mA 5.0000 A 50.000 A 1P2W 500.00 W 5.0000 kW 50.000 kW 1P3W 1.0000 kW 10.000 kW 100.00 kW 1P3W1U 3P3W2M 3P3W3M 3P4W...
- Page 196 Range Configuration and Combination Accuracy While using Model CT7736 AC/DC Auto-Zero Current Sensor Power range configuration Current range Wiring 50.000 A 500.00 A 1P2W 50.000 kW 500.00 kW 1P3W 100.00 kW 1.0000 MW 1P3W1U 3P3W2M 3P3W3M 3P4W 150.00 kW 1.5000 MW 3P4W2.5E Display format varies according to the declared voltage settings.
- Page 197 Range Configuration and Combination Accuracy While using the Model CT7044, CT7045, CT7046 AC Flexible Current Sensor Power range configuration Current range Sensor range within ( ) Wiring 50.000 A (600A) 500.00 A (600A) 5000.0 A (6000A) 1P2W 50.000 kW 500.00 kW 5.0000 MW 1P3W 100.00 kW...
- Page 198 Range Configuration and Combination Accuracy...
-
Page 199: Maintenance And Service
The calibration frequency varies depending on the status of the instrument or installation environment. We recommend that the calibration period be determined in accordance with the status of the instrument or installation environment. Please contact your Hioki distributor to have your instrument periodically calibrated. -
Page 200: X84; Replaceable Parts And Operating Lifetimes
When replacing parts, please contact your authorized Hioki distributor or reseller. The service life of parts varies with the operating environment and frequency of use. Parts are not guaranteed to operate throughout the recommended replacement cycle. -
Page 201: Cleaning
SY01 The internal The internal programming The instrument must be repaired. programming of the of the instrument is corrupt. Contact your authorized Hioki distributor or PQ3100 is corrupted and reseller. the instrument must be repaired. SY02 The SDRAM of the... - Page 202 An internal memory error The instrument must be repaired. Contact occurred. your authorized Hioki distributor or reseller. FL06 Maximum files reached. The maximum number of Execute any of the following.
- Page 203 Error Indication <SD Card Error> Code Error indication Cause Corrective action/more information SD01 SD card not found. Data cannot be saved Insert an SD memory card (p. 42). Insert an SD card. to the SD memory card because no SD memory card has been inserted into the instrument.
- Page 204 Error indication Cause Corrective action/more information OP01 This folder cannot be You attempted to delete The [PQ3100] base folder cannot be deleted. deleted. the [PQ3100] base folder. If you wish to delete it, you must do so on a computer. <Error>...
-
Page 205: Disposing The Instrument
Disposing the Instrument 15.4 Disposing the Instrument When disposing of this instrument, remove the lithium battery and dispose of battery and instrument in accordance with local regulations. WARNING To avoid electric shock, turn off the power switch, disconnect all the cords and cables from the device to be measured, and remove the lithium battery. - Page 206 Disposing the Instrument Remove the rear cover and remove one Remove the 2 screws on the front cover screw of the metal plate. and then remove the front cover and rubber key. Remove the 17 screws shown in the Insert the tweezers between the battery following diagram and then remove holder and the battery the key printed circuit board and upper...
-
Page 207: Appx. 1 Fundamental Measurement Items
Appendix Appx. 1 Fundamental Measurement Items Item Display Item Display Transient overvoltage Tran Power factor Frequency (1 wave) Freq_wav Displacement power factor RMS voltage refreshed each Urms1/2 Active power demand quantity Dem_WP+ half-cycle (Consumption)* RMS current refreshed each Irms1/2 Active power demand quantity Dem_WP- half-cycle (Regeneration)*... - Page 208 Fundamental Measurement Items Item Display Item Display Active power Voltage zero-phase unbalance Uunb0 factor Apparent power Current negative-phase Iunb unbalance factor Reactive power Current zero-phase unbalance Iunb0 factor Active energy K factor (Consumption) Active energy (Regeneration) Reactive energy (Lag) WQ_LAG Reactive energy (Lead) WQ_LEAD Apparent energy...
- Page 209 Event Item Appx. 2 Event Item Category Sub-category Display Transient overvoltage Tran Swell Swell Interruption Intrpt RVC (IN) (Available after the firmware update) RVC (Fixed) (Available after the firmware update) Inrush current Inrush Frequency (200 ms) Upper frequency limit exceeded Freq Up Lower frequency limit exceeded Freq Low...
-
Page 210: Quality Parameters And Events
Explanation of Power Quality Parameters and Events Appx. 3 Explanation of Power Quality Parameters and Events Power quality parameters are necessary to investigate and analyze power supply issues* By measuring these parameters, it is possible to assess power quality. To allow instrument to detect abnormal values and abnormal waveforms, you set the threshold values. - Page 211 Explanation of Power Quality Parameters and Events Voltage dip (Sag) Waveform and event Most dips are caused by natural phenomena such as lighting. Short-term voltage drops occur under the following conditions: • An equipment fault is detected and the power supply is switched off, due to the occurrence of a power system ground fault or short-circuit •...
- Page 212 Explanation of Power Quality Parameters and Events Interharmonics Waveform and event Frequency components that are not a whole multiple of the fundamental wave caused by distortions of the voltage and current waveforms due to any of the following: • Static frequency conversion equipment •...
- Page 213 Explanation of Power Quality Parameters and Events Unbalance Waveform and event Unbalance is caused by increase or decrease in the load connected to each phase of a power line, or by distortions in voltage and current waveforms, voltage drops, or negative-phase voltage caused by the operation of unbalanced equipment or devices.
-
Page 214: Appx. 4 Event Detection Methods
Event Detection Methods Appx. 4 Event Detection Methods Transient overvoltage Measurement method Transient overvoltage event is detected when the waveform obtained by eliminating the fundamental component (50 Hz/60 Hz) from a waveform sampled at 200 kHz exceeds a threshold value specified as an absolute value. Detection occurs once for each the fundamental voltage waveform, and voltages of up to ±2,200 V can be measured. - Page 215 Event Detection Methods Event IN and OUT Event IN Time when the first transient overvoltage is detected (the waveform exceeded the threshold value) in an approx. 200 ms aggregation interval. Event OUT Start time of approx. 200 ms aggregation in which no transient overvoltage was detected for any channel within the first approx.
- Page 216 Event Detection Methods Voltage swells, Voltage dips, Interruptions Measurement method • Voltage swell, voltage dip, and interruption events are detected using the RMS voltage refreshed each half-cycle that is calculated from the voltage waveform obtained over a 1-cycle time, refreshed each half-cycle. •...
- Page 217 Event Detection Methods RMS voltage refreshed each half-cycle RMS voltage refreshed each half-cycle Frequency (200 ms) Measurement method (Reciprocal method) Values of Frequency (200 ms) are calculated from the reciprocal of the accumulated time over the approximately 200-ms (10/12-cycle for 50 Hz / 60 Hz, respectively) aggregation period on U1 (reference channel).
- Page 218 Event Detection Methods Frequency (1 wave) Measurement method (Reciprocal method) Frequency for every U1 (reference channel) waveform. Approx. 200 ms aggregation Frequency Frequency (1 wave) (1 wave) Event IN and OUT Event IN Time when a frequency exceeds the positive threshold value or falls below the negative threshold value Event OUT Time when a frequency falls below the value calculated by subtracting 0.1 Hz...
- Page 219 Event Detection Methods Inrush current Measurement method Inrush current events are detected when the RMS current (inrush current) calculated for every half cycle exceeds the threshold value. Threshold Hysteresis Inrush Event IN Event 0.5 s 29.5 s Inrush current, Inrush is saved from 0.5 s before the event to 29.5 s after the event as event trend data.
- Page 220 Event Detection Methods Timer event • Events are generated at the set interval. • Once recording is started, timer events will be recorded at a fixed interval (the set time) from the start time. Interval Interval Interval Interval Recording start Event recorded Event recorded Event recorded...
- Page 221 Recording Trends and Event Waveforms Appx. 5 Recording Trends and Event Waveforms Trend screen recording method Basic trend and harmonics trend (available after the firmware update) SET UP, Record Settings screen: Recording Interval Settings Approx. 200 ms aggregation (50 Hz: 10 waveforms, 60 Hz: 12 waveforms) RMS value 1 RMS value 2 RMS value 3...
- Page 222 Recording Trends and Event Waveforms Recording event waveforms Waveforms observed in the approximately 200-ms aggregation period are recorded as event waveforms. Event waveform recording period 50 Hz: Waveform observed for a 10-cycle period 60 Hz: Waveform observed for a 12-cycle period When an event occurs on a measured value obtained over an approximately 200- ms aggregation period SET UP, Record Settings...
-
Page 223: Flicker (Available After The Firmware Update)
Recording Trends and Event Waveforms Method for verifying aggregation values required by IEC61000-4-30 3-s aggregated values 10-min aggregated 2-h aggregated values (= 150/180-cycle data) values Magnitude of the supply Applies to the average value of Urms values obtained on each channel over voltage the recording interval. - Page 224 Detailed Explanation of IEC Flicker and ∆V10 Flicker (available after the firmware update) Appx. 6 Detailed Explanation of IEC Flicker and ∆ V10 Flicker (available after the firmware update) IEC flicker meter The IEC flicker function is based on the international standard IEC61000-4-15, “Flickermeter - Functional and design specifications.”...
- Page 225 Detailed Explanation of IEC Flicker and ∆V10 Flicker (available after the firmware update) Short interval flicker ( Pst ) This indicates degree of perceptibility (severity) of flicker measured over a 10-min period. Short interval flicker value is defined with the following expression. Pst = 0.0314P0.1+0.0525P1s+0.0657P3s+0.28P10s+0.08P50s P50s = (P30+P50+P80)/3...
- Page 226 Detailed Explanation of IEC Flicker and ∆V10 Flicker (available after the firmware update) ∆ V10 flicker meter ∆V10 flicker The ∆V10 flicker function is calculated using the “perceived flicker curve” calculation method, which is based on the digital Fourier transformation. The ∆V10 flicker is defined with the following expression.
-
Page 227: Appx. 7 3-Phase 3-Wire 7
3-phase 3-wire Measurement Appx. 7 3-phase 3-wire Measurement 3-phase 3-wire 3-phase 3-wire Source Load Neutral point Similar circuit of 3-phase 3-wire line : The vectors of line-to-line voltage : The vectors of phase to neutral voltage : The vectors of line (phase) current 3-phase/3-wire/3-wattmeter measurement (3P3W3M) In 3-wattmeter measurement, 3 phase voltages u and three line (phase) currents I... - Page 228 3-phase 3-wire Measurement Since the values calculated internally U and I are also applied to the 3-phase total reactive power Q, apparent power S, and power factor PF values, these values can also be calculated accurately in the event of an unbalanced state. [When PF/Q/S setting (p.
-
Page 229: Accuracy
Method for Calculating Active Power Accuracy Appx. 8 Method for Calculating Active Power Accuracy The accuracy of active power calculations can be calculated as follows, taking into account the phase accuracy: Example measurement conditions Wiring: 3-phase/4-wire (3P4W) Current sensor: Model CT7136 Current range: 50 A (power range: 150 kW) “14.8 Range Configuration and Combination Accuracy”... -
Page 230: Appx. 9 Terminology
Terminology Appx. 9 Terminology Active power Power that is consumed doing work. Active power The average active power used during a set period of time (usually 30 min). demand Apparent power The (vector) power obtained by combining active power and reactive power. As its name suggests, apparent power expresses the “visible”... - Page 231 Terminology Frequency 10 s The frequency measured value as calculated according to IEC61000-4-30. This value is an average of the frequencies measured for 10 s. It is recommended to measure this (Freq10s) characteristic for at least one week. Harmonics A phenomenon caused by distortions in the voltage and current waveforms that affect many devices with power supplies using semiconductor control devices.
- Page 232 Terminology IEC61000-4-30 A standard governing testing involving power quality measurement in AC power supply systems and associated measurement technologies. Target parameters are restricted to phenomena that are propagated in power systems. The target parameters consist of frequency, supply voltage amplitude (RMS), flicker, supply voltage dips, swells, (momentary) interruptions, transient overvoltage, supply voltage unbalance, harmonics, interharmonics, supply voltage carrier signals, and high-speed voltage variations.
- Page 233 Terminology K factor Shows the power loss caused by the harmonic current in transformers. Also referred to as the “multiplication factor.” The K factor (KF) is formulated as shown below: ∑ × ∑ where k: Order of harmonics : Harmonic current value [A] Higher-order harmonic currents have a greater influence on the K factor than lower-order harmonic currents.
- Page 234 Terminology Power factor demand The power factor calculated using the active power demand value (consumption) and the value reactive power demand value (lag) for the set interval time (usually 30 min). Pdem PFdem Pdem Qdem LAG Power factor (PF/ Power factor is the ratio of active power to apparent power. DPF) The larger the absolute value of the power factor, the greater the proportion of active power to the apparent power, and greater the efficiency.
- Page 235 Terminology Timer event function Functionality for generating events at a set time interval and recording the measured value and event waveform at that time. This function allows you to capture instantaneous waveforms and other data regularly, even if no abnormalities have occurred. Use this functionality when you wish to record a waveform at a fixed time interval.
- Page 236 Terminology If Va, Vb, and Vc are applied as the three-phase alternating voltage, the zero-phase voltage, positive-phase voltage, and negative-phase voltage are formulated as shown below. ⋅ ⋅ ⋅ V a V b V c ⋅ Zero-phase Voltage = ⋅ ⋅...
- Page 237 Index Symbols Flag.............. Appx.24 Flicker ...... 104, Appx.6, Appx.18, Appx.24 ∆V10 ............... 150 Folder/file name ............ 71 Formating ............... 126 Frequency............ 40, 66 Frequency (1 wave) ......... Appx.12 Frequency (200 ms) ......... Appx.11 AC adapter ............... 43 Frequency fluctuations ........ Appx.5 Alligator clips ............ 51, 55 Fundamental wave ........... 67 Backlight .............. 75 Grabber clip ............
- Page 238 Index MONITOR .............. 81 Unbalance factor .......... Appx.29 Negative phase.......... Appx.30 Vector ............... 88 Voltage..............86 Voltage cord............ 51, 55 Voltage dip .......... Appx.5, Appx.10 Voltage phase ............ 59 Overrange..............34 Voltage range ............64 Voltage swell........ Appx.4, Appx.10 VT ................ 65 Phase difference ............ 62 Phase name ............. 75 Phase voltage .............
- Page 239 16-01 EN...
Need help?
Do you have a question about the PQ3100 and is the answer not in the manual?
Questions and answers