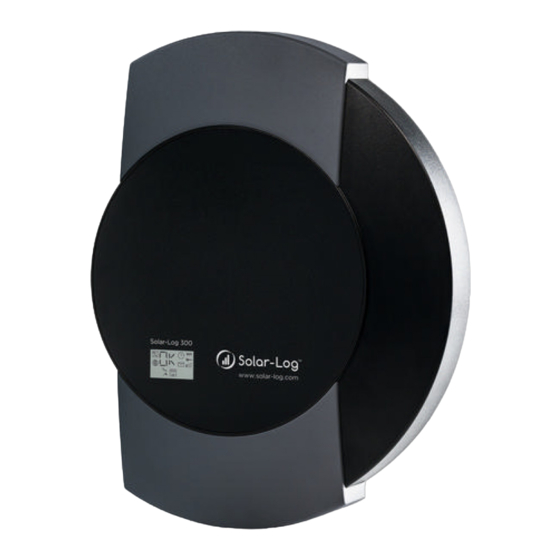
Solar-Log 300 User Manual
Hide thumbs
Also See for 300:
- Connection manual (24 pages) ,
- Manual (319 pages) ,
- Installation manual (224 pages)
Table of Contents
Advertisement
Quick Links
Advertisement
Chapters
Table of Contents

Related Manuals for Solar-Log 300


Summary of Contents for Solar-Log 300
- Page 1 User Manual Solar-Log™...
- Page 2 Solare Datensysteme GmbH Fuhrmannstr. 9 72351 Geislingen-Binsdorf Germany International support Tel.:+49 7428 9418 -640 Fax:+49 7428 9418 -280 e-mail: support@solar-log.com Italy Technical support: +39 0471 631032 e-mail: italy-support@solar-log.com France Technical support: +33 97 7909708 e-mail: france-support@solar-log.com Switzerland Technical support: +41 565 355346 e-mail: switzerland-fl-support@solar-log.com...
-
Page 3: Table Of Contents
Table of Contents General Information ..................... 7 The necessary steps for precision monitoring of your PV plant with the Solar-Log™ ...... 7 Operating via a web browser within your own network ....... 8 Requirements ................................. 8 Overview ..................................9 2.2.1 General Navigation ...............................9... - Page 4 Operating the Solar-Log 1200 and 2000 via Touch Display ....60 Navigating from the touch screen ........................60 Accessing the Dashboard ............................62 Accessing the Energy Balance ..........................63 Accessing Forecast..............................64 Accessing Yield history ............................65 Accessing Environmental performance ......................65 Accessing the USB menu ............................
- Page 5 Viewing Plant data ..............................131 The Yield Data as a Slide Show .......................... 133 9.8.1 Start the Slide Show ..............................134 Cleaning and care..................... 135 10.1 Cleaning tips ................................135 10.2 Care tips ..................................135 Notifications on the LCD Status Display (Solar-Log 300, 1200 and...
- Page 6 11.1 Meaning of the symbols on the LCD display ....................136 Faults (Solar-Log 200, 500 and 1000) ............139 12.1 LED status display (Solar-Log 200, 500 and 1000) .................. 139 12.2 Troubleshooting faults oneself ........................... 140 12.3 Obtaining information from the Internet ......................141 12.4...
-
Page 7: General Information
General Information General Information This user manual is intended to assist you in the operation of the Solar-Log™. The yield data from the Solar- Log™ can be displayed in several ways: • via a web browser in a local network (LAN) (Chapter 2) •... -
Page 9: Operating Via A Web Browser Within Your Own Network
In a local network (LAN) To operate the Solar-Log™ via a web browser, you will need to be on a computer that is connected to the same local network (LAN). This computer will also need to have a modern web browser installed on it. -
Page 10: Overview
Operating via a web browser within your own network Overview 2.2.1 General Navigation Fig.: Navigation designations The start page contains the following sections: • Header bar (A) • Left navigation (B) • Tabs (C) • Configuration page (D) Header bar The header contains three major sections: •... -
Page 11: Fig.: Log In Button With Selection Box
Displaying advanced configuration Access protection for the display (only Solar-Log 1000, 1200 and 2000) A pin code can be activated to restrict access to the Solar-Log™’s display. The pin code may contain a maximum of 8 numerical digits. Access at the display can be restricted for the entire display or just the settings section. - Page 12 Operating via a web browser within your own network Access protection for the browser menu In this section, the following parts of the Solar-Log™’s browser menu can be restricted with a password: • User General access to the Browser menu •...
-
Page 13: Accessing The Start Page
Operating via a web browser within your own network Accessing the Start page Start your web browser and enter "solar-log" in the address bar of the web browser or select the book- mark in the browser's navigation bar. If there are several Solar-Log™ devices connected to the network, enter http://solar-log-wxyz in the address bar. -
Page 14: Accessing Yield Data
Operating via a web browser within your own network Accessing Yield Data Access the yield data from the header bar The following options can be selected from the left-side navigation menu. • Current values • Production • Consumption (only appears when a consumption meter is connected) •... -
Page 15: Production
Operating via a web browser within your own network • The current day curve (graph on the left). There is also the option to display the previous five days as a curve in this graph. Therefore just click on the day value in the graph on the right. •... -
Page 16: Day View
Operating via a web browser within your own network Graph Table You can select to display the view as a . The values displayed in the graph or table depend on the view selected. Note The auto scaling option always scales the graphics up as much as possible in the yield data section. -
Page 17: Fig.: Day View Of The Production Table
Operating via a web browser within your own network Fig.: Daily View of the Production Graph with the Auto Scaling deactivated Different values with different units are displayed in the graph. The units used and their colors are defined in the key at the top. Fig.: Day view of the production table When you click on Table... -
Page 18: Month View
Operating via a web browser within your own network 2.5.2 Month view Month tab displays the daily yields from the month as a total in a bar graph. • The daily yield can be displayed by moving the mouse above one of the bars. •... -
Page 19: Fig.: Month View Of The Production Table
Operating via a web browser within your own network Fig.: Month view of the production table When you click on Table , the date and daily output will be listed for the entire month. -
Page 20: Year View
Operating via a web browser within your own network 2.5.3 Year view Year tab displays the monthly yields from the year as a total in a bar graph. • Move the mouse above one of the bars to display the monthly yield with a comparison of the cur- rent and target values in regard to the annual forecast. -
Page 21: Total View
Operating via a web browser within your own network 2.5.4 Total view Total tab displays the annual yields as a total in a bar graph. The red line displays the target balance that is calculated according to the annual forecast. •... -
Page 22: Consumption
From the Consumption menu, you can view the exact consumption from appliances that are connected via networked “smart plugs” with the Solar-Log 1200 and 2000, relays or the Solar-Log™ Meter. Note Consumption is only displayed once a meter is connected. - Page 23 Operating via a web browser within your own network Fig.: Graph of daily consumption with two meters connected...
-
Page 24: Fig.: Graph Of Daily Consumption With Connected Appliances In The Sub-Consumer View
Operating via a web browser within your own network Fig.: Graph of daily consumption with connected appliances in the sub-consumer view You have the option to select additional menu items in the consumption view. • Month displays the Month Graph View as a bar graph. There are two tabs in the Month View, the same as in the Day View. - Page 25 Operating via a web browser within your own network • Year displays the Year Graph View as a bar graph. There are two tabs in the Year View, the same as in the Month View. Consumption Overview Sub-consumer Overview and the The total consumption values are displayed in the Consumption Overview as a bar graph.
-
Page 26: Fig.: Daily Balance Graph With The Auto Scaling Activated
Operating via a web browser within your own network Balances You can see the relationship between your plant's production and consumption from the Balances menu. Note Consumption is only displayed once a meter is connected. Note The auto-scaling option always scales the graphics up as much as possible in the yield data section. -
Page 27: Day Balance
Operating via a web browser within your own network The following tabs can be selected: • • Month • Year • Total The start view displays the current daily values as a graph. 2.6.1 Day balance tab under Balances displays the production, consumption and self-consumption side-by-side as a day curve. -
Page 28: Month Balance
Operating via a web browser within your own network 2.6.2 Month balance The tab Month under balances displays the production and consumption side-by-side in a bar graph. • Move the mouse above one of the bars to view either the daily yield or consumption. •... -
Page 29: Year Balance
Operating via a web browser within your own network 2.6.3 Year balance The Year tab under Balances displays the production and consumption side-by-side in a bar graph. • Move the mouse above one of the bars to view either the monthly yield or consumption with a comparison of the current and target values in regard to the annual forecast. -
Page 30: Total Balance
Operating via a web browser within your own network 2.6.4 Total balance The tab Total under balances displays the production and consumption side-by-side in a bar graph. • Move the mouse above one of the bars to view either the annual yield or consumption with a com- parison of the current and target values in regard to the annual forecast. -
Page 31: Finances
Operating via a web browser within your own network Finances Your plant's financial performance can be displayed as a graph or table from the Finances menu. (See the chapter "Defining Tariffs and Costs" in Installation Manual for the configuration of the tariff and consump- tion values) Fig.: Finances overview The total financial performance of your plant is displayed as a graphic with the actual/target value curve in... -
Page 32: Sensor
Operating via a web browser within your own network The calculations are based on the rate defined in the Configuration | Plant | Electricity Costs settings. • PV revenue: This displays all of the revenue from the PV plant based on the feed-in and self-consumption tariffs and the electricity costs saved with self-consumption. -
Page 33: System Information
Data is only available if a sensor is connected. System Information System info Go to the menu for plant and system information. Fig.: System Information The following information is displayed: About this Solar-Log™: • Model • Serial number • Firmware version Plant data: •... -
Page 34: Accessing Diagnostic Values
• Event log • Notifications • Feed-In Management • SCB Monitor (only Solar-Log 2000 with SCB activated) • Alarm contact (only Solar-Log 2000) • CSV Export 2.10.1 Inverter diagnostic To access the Inverter diagnostic menu, go to Diagnostic | Inverter Diagnostic. -
Page 35: Fig.: Inverter Details Graph
Operating via a web browser within your own network Inverter details To access the Inverter details menu, go to Diagnostic | Inverter Diagnostic | Inverter details. A particular date and device (e.g. inverter or sensor) can be selected under inverter details and evaluated. Fig.: Inverter details graph In the example (see Fig.: Inverter details graph), the following values can be displayed for the inverter: •... -
Page 36: Fig.: Tracker Comparison Graph
Operating via a web browser within your own network Tracker comparison To access the Tracker comparison menu, go to Diagnostic | Inverter Diagnostic | Tracker comparison. Two trackers (either from the same device or two different devices) can be compared on a particular date by selecting the date, device and tracker. -
Page 37: Fig.: Module Field Comparison Graph
Operating via a web browser within your own network Module field comparison To access the Module field comparison menu, go to Diagnostic | Inverter Diagnostic | Module field com- parison. Fig.: Module field comparison graph Date and Module Field With the boxes, the module field comparison permits all devices (e.g. -
Page 38: Accessing Event Logs
Operating via a web browser within your own network 2.10.2 Accessing Event logs To access the Event logs menu, go to Diagnostic | Event logs. The following mode is loaded when accessing the event logs. Fig.: The event log is being loaded. After the event log has been loaded, the window switches back to the normal view. -
Page 39: Accessing Notifications
Operating via a web browser within your own network • Fault codes: Under fault codes (default "All fault codes"), you can select individual fault codes or leave the default se- lection as is. By default, the current day is displayed in the table with all devices, fault codes and status codes. 2.10.3 Accessing Notifications Diagnostic | Notifications. -
Page 40: Fig.: Message With Text Field
The method with which the message is sent is displayed here. • Text: There is the option to display the messages sent by the Solar-Log™ under Text. Note For sending notifications, see the chapter "Configuring Notifications" in the Instal- lation Manual. -
Page 41: Accessing Feed-In Management
Operating via a web browser within your own network 2.10.4 Accessing Feed-In Management To access the Feed-In Management menu, go to Diagnostic | Feed-In Management. Note The menu Feed-In Management under Diagnostic | Feed-In Management only appears if active power has been configured in the Configuration | Special Func- tions | Feed-In Management section. - Page 42 Operating via a web browser within your own network 10% Diagnosis Function There is also a to simulate a dynamic reduction to 10%. The values are displayed in the table. Note The 10% Diagnosis Function can only be used when the 70% Fixed Reduction has been activated.
- Page 43 The consumption value is normally subtracted from the allowed power from the entire plant. Control value power (kW): This value is calculated by the Solar-Log™ and is the maximum current power output from the inverters. It is used for the current target power output.
-
Page 44: Fig.: Feed-In Management - Feed-Balance
Operating via a web browser within your own network Fig.: Feed-In Management - Feed-balance Feed-balance tab displays when power output was fed into the grid and when power was purchased from the grid. Negative values mean that the power was purchased from the grid and positive values mean that power was fed into the grid. -
Page 45: Accessing The Scb Monitor (Only Solar-Log 2000)
The bottom screen displays the current measurements of the individual strings based on the analog and digital number. Note The SCB Monitor menu only appears when a SCB is connected. It is also only available with the Solar-Log 2000. -
Page 46: Accessing Components
The following values are displayed in the Pulse meter box: • Total number of pulses for the SO meter since the last restart of the Solar-Log™ (first number) • Number of pulses since the menu has been accessed (second number) •... -
Page 47: Fig.: Alarm Contact
(e.g. alarm), the Internet status (e.g. OK) and if the notification has been manually or automatically acknowledged. Note The alarm contact is only available with the Solar-Log 2000. You can access the Wireless Package test function from the Diagnosis | Components | Wireless Package... - Page 48 Operating via a web browser within your own network To perform a connection test a Wireless Package has to be connected to the Solar-Log™, the interface Configuration | Devices | Definition with the Wireless Package has to be activated in the menu and the inverter has to be selected.
-
Page 49: Accessing Csv Export
Pac and DC values from the individual inverters and also from every MPP tracker. The CSV file with day values is in a table format and contains the day values from every individual inverter since the start of the plant's operation (since plant monitoring with the Solar-Log™ started). Note Files in the CSV format can be created with simple text editors or spreadsheet programs like MS Excel or Open Office Calc. -
Page 50: Accessing Support
CLIB (Version number of the Solar-Log™ library used). • Creating diagnostic reports: You have the option to create and download a diagnostic report. This can be sent to Solar-Log support for analysis. (See Fig.: Support - General.) • Creating screenshots: You have the option to create and download screenshots of the display in this section. -
Page 51: Notifications
Notifications 3 Notifications Yield E-mail All three Solar-Log models—300, 1200, 2000—come with an e-mail program that can send a daily over- view of the day's performance to two different e-mail addresses (maximum of 57 characters, separated with a semicolon). Configuration | Notifications The settings are configured under the menu. -
Page 52: Fig.: Defining Notification Times And Setting Types
Notifications Yield tab In the , you can define yield notifications per e-mail or text message (SMS). Fig.: Defining Notification times and setting types The time frame for notifications can be defined here. There are many types of settings: • Deactivated •... -
Page 53: Explanation Of The Individual E-Mail Functions
Notifications 3.1.1 Explanation of the individual E-mail Functions: Deactivated • When no e-mail notifications are to be sent. Yield overview short • The yield data from the entire plant is totaled and displayed for the day, month and year. (See Fig.: Screenshot of a yield message) Fig.: Example of a yield message... -
Page 54: Fig.: Yield Overview (All Inv) In Html Format
Notifications Yield overview (all INV) • Yield data is totaled for the entire plant with the totals for every individual inverter (also SO me- ters) broken down by day, month and year. This is then displayed in HTML format as a table. (See Fig.: Yield overview (all INV) in HTML format) Fig.: Yield overview (all INV) in HTML format Yield overview (all INV &... - Page 55 Notifications Explanation of the individual sections of the Yield Overviews Subject : The Solar-Log serial number and time and date Day: Field Explanation Text Total The actual amount of grid feed for the day in kWh. Specific Yield specific. The energy yield divided by the amount of generator power installed.
- Page 56 Notifications Year: Field Explanation Text Total The actual amount of grid feed for the day in kWh. Specific Yield specific. The energy yield divided by the amount of generator power installed. (Values are normalized to 1 kWp)
-
Page 57: Performance Monitoring
Notifications Performance Monitoring To monitor different sized inverters, the Solar-Log™ normalizes the value from every inverter to 1 kWp. The Configuration | Devices | Configuration Solar-Log™ uses the amount of generator power set in The generator power is equivalent to 100% and the value here is normalized to 1 kWp. -
Page 58: Fig.: Configuring Module Fields
Notifications Fig.: Configuring module fields Performance Monitoring Configuration under Configuration | Notifications. Fig.: Configuring performance monitoring... -
Page 59: Performance Monitoring Notification
Notifications The output measured from the inverters is contrasted with the generator capacity that is listed in the sys- tem. A notification is sent (by email) when the deviation exceeds the amount configured (for example 10%) over a set time period (for example 30 minutes). Note For performance monitoring configurations, see the chapter "... -
Page 60: Calculation And Explanation Of The Notification
Notifications Fig.: Performance Monitoring with notification and inverter Inverter 1, Inverter 1 house Inverter 2, Inverter 2 house Generator Power= 5500 Wp 3300 Wp Current power output = 3950 W = 2950 W Current efficiency = 71.81 % = 89.39 % Inverter with a deviation Reference Inverter Reference Inverter. -
Page 61: Operating The Solar-Log 1200 And 2000 Via Touch Display
4 Operating the Solar-Log 1200 and 2000 via Touch Display The Solar-Log 1200 and 2000 are equipped with a touch screen that allows power output, yield history and environmental performance to be quickly displayed. Data can also be transferred to and from the USB sticks via the display. - Page 62 Operating the Solar-Log 1200 and 2000 via Touch Display The following symbols are displayed in the left-side navigation menu and can be selected for additional options: Power Yield History Environmental per- formance Settings the display window with: • Solar-Log™ type •...
-
Page 63: Accessing The Dashboard
Operating the Solar-Log 1200 and 2000 via Touch Display Accessing the Dashboard From the Power menu, you can swipe to go from the start page to the Dashboard. Fig.: Dashboard view In the view from left-to-right: Current consumption and today's consumption high (only with connected meters). -
Page 64: Accessing The Energy Balance
Operating the Solar-Log 1200 and 2000 via Touch Display Accessing the Energy Balance From the Power menu, you can swipe from the start page to go to the Energy Balance. Fig.: Energy Balance view The energy balance is a split-screen window. The top part of the window displays the following values: Production: •... -
Page 65: Accessing Forecast
Edition to display the forecast on the Solar-Log™ . Note Plant location and the alignment and inclination of the module need to be config- ured in the portal to receive daily weather updates. The weather data is transfer to the Solar-Log™ in the morning and in the evening. -
Page 66: Accessing Yield History
Operating the Solar-Log 1200 and 2000 via Touch Display Accessing Yield history Access the Yield History from the navigation menu on the left by tapping on the symbol. Fig.: Yield history - Day The Yield history view is displayed in two sections: In the top part, you have the option, depending on the display mode (year, month, year), to swipe on the display to go to the exact date. - Page 67 Operating the Solar-Log 1200 and 2000 via Touch Display The Environmental performance view is displayed in two sections. The top display contains: • • Month • Year • Total The bottom display contains the values for your plant's environmental contributions: •...
-
Page 68: Accessing The Usb Menu
Operating the Solar-Log 1200 and 2000 via Touch Display Accessing the USB menu Access the USB menu from the navigation menu on the left. by tapping on the Settings symbol. Fig.: Menu Settings Settings This brings you to the main menu. - Page 69 As soon as a USB stick has been plugged in, the folder named "Backup" is auto- matically created on the USB stick. At the end of the day, the Solar-Log™ saves a daily backup with the date in this folder.
-
Page 70: Operating The Solar-Log 500 And 1000 Via The Display
5 Operating the Solar-Log 500 and 1000 via the Display Display Solar-Log 500 In additional to the web interface described above, the Solar-Log 500 also has a two-line text display on which the current power data can be displayed. The following values are displayed at regular intervals. -
Page 71: Display Solar-Log 1000
After touching the screen, the overview is displayed. Fig.: Home Screen After the display of the Solar-Log 1000 has been touched, it automatically displays the yield for the cur- rent day, the total yield for the plant and the amount of C02 avoided. -
Page 72: Accessing Yield Data
Here, you can access the system notifications, acknowledge alarm messages and adjust self-consumption. If the device is not connected to a local area network (LAN), a USB stick can be used to backup and re- store data. The USB connection can also be used to update the firmware on the Solar-Log™. Configuration The configuration menu allows you to change settings and to make adjustments to the device's software. -
Page 73: The Meaning Of The Values In The Overviews
Operating the Solar-Log 500 and 1000 via the Display 5.4.2 The meaning of the values in the overviews The following table contains the values and their meaning in alphabetical order. Name Unit Meaning The amount of carbon dioxide emissions that have been avoided based on the power output. -
Page 74: Daily Graph
Operating the Solar-Log 500 and 1000 via the Display 5.4.3 Daily Graph your finger on the display. • The main navigation screen is displayed. Graph and then on the Fig.: Daily Graph on the day's date to display the information for that day. -
Page 75: Monthly Graph
Operating the Solar-Log 500 and 1000 via the Display Back Select the desired inverter and tap on " ." • The values from the selected inverter are displayed. Daily Graph on the to display the additional measured values. Back Select the desired view and tap on "... -
Page 76: Yearly Graph
Operating the Solar-Log 500 and 1000 via the Display Fig.: Total Plant Back Select the desired inverter and tap on • The values from the selected inverter are displayed. on the display to access the Main Navigation. 5.4.5 Yearly Graph your finger on the display. -
Page 77: Overall Graph
Total Fig.: Total Graph The total graph displays the values for the plant since it has been monitored by the Solar-Log™. on the displayed bar to view the Yearly Graph for the selected year. Total Graph on the to display the yield values for the connected inverters. -
Page 78: Large External Display
Operating the Solar-Log 500 and 1000 via the Display Fig.: Total Plant Select the desired inverter and tap on Back • The values from the selected inverter are displayed. on the display to access the Main Navigation. 5.4.7 Large External Display your finger on the display. -
Page 79: Power Balance
Operating the Solar-Log 500 and 1000 via the Display 5.4.8 Power Balance If a power meter with the type "consumption meter" is set up on the Solar-Log 1000, the Power Balance menu appears on the touchscreen. your finger on the display. -
Page 80: Accessing The Diagnosis
Operating the Solar-Log 500 and 1000 via the Display Accessing the Diagnosis The diagnosis menu allows you to access to device logs. You can view all of the errors, faults and status changes from the connected inverters. 5.5.1 Accessing Notifications your finger on the display again. -
Page 81: Display The Inverter Events
Operating the Solar-Log 500 and 1000 via the Display 5.5.2 Display the Inverter Events your finger on the display again. • The main navigation screen is displayed. Diagnosis INV Event Log. and then on • A list of events from the connected inverters is displayed. -
Page 82: Handling Alarm Notifications
Operating the Solar-Log 500 and 1000 via the Display 5.5.3 Handling Alarm Notifications You can acknowledge fault notifications in this menu. your finger on the display again. • The main navigation screen is displayed. Diagnosis and then on Alarm Contact. -
Page 83: Optimizing The Consumption Of Self-Produced Power
To specifically concentrate your power consumption at times when there is sufficient power production, the Solar-Log 1000 offers the option to automatically turn on and off up to 10 appliances as needed. The appli- ances are displayed as "Switches" on the display. -
Page 84: Using Data Transfer With Usb
Operating the Solar-Log 500 and 1000 via the Display Using Data Transfer with USB If your Solar-Log 1000 is not connected to a local area network (LAN), you can use a USB stick to transfer data, event logs and settings. -
Page 85: Fig.: Starting Usb Backup
Fig.: Starting USB Backup Start Backup • The current data from the Solar-Log 1000 is copied to the USB stick. It can take several minutes to copy all of the data depending on the amount of data. Cancel if you do not want to start a backup. -
Page 86: Fig.: Importing Usb Yield Data
Operating the Solar-Log 500 and 1000 via the Display Import yield data Note Import the current configuration before importing saved yield data. Import Yield Data. Fig.: Importing USB Yield Data Search Backup • The device searches the USB stick for a backup directory and copies the data. It can take several minutes to copy all of the data depending on the amount of data. -
Page 87: Fig.: Usb Firmware Update
The Solar-Log™ firmware can be updated via the USB connection. Go to our website to download the current firmware version: http://www.solar-log.com/de/service-support/firmware.html. 1. Select the Solar-Log 1000 and copy the firmware to the USB stick. 2. Plug the USB stick into the Solar-Log 1000. 3. Tap on in the main menu. -
Page 88: Changing Settings In The Configuration Menu
Operating the Solar-Log 500 and 1000 via the Display Changing settings in the configuration menu The configuration menu allows you to change settings and to make adjustments to the device's software. The device should be completely configured by your installer. However, it can happen that you need to make later changes, such as changing the password or adjusting the network settings. -
Page 89: Pac Correction Factor
8% can arise. In practice, meters and inverters both can display too much or too little kWh. To correct these inaccuracies in the medium term, the Solar-Log™ firmware uses a PAC correction factor. Configuration | Devices | Configuration The PAC correction factor is located in the menu. -
Page 90: Using Solar-Log Web
The portal offers additional functions which can be tailored to your needs. Please contact your installer for more information or check out our website: http://www.solar-log.com/en/products-solutions/solar-log-web.html. Registering for Solar-Log™ WEB "Classic 2nd Edition" The Solar-Log™ WEB "Classic 2nd Edition" online registration is very simple. Start your browser and go to the Solar-Log™ WEB registration site: http://www.solar-log.com/classic2/... -
Page 91: Fig.: C2 Registration
Using Solar-Log WEB Register Select from the menu on the left. The registration form then appears. Fig.: C2 registration Enter your device's Serial Number. The serial number (SN) is located under the top cover. Select whether the data should be publicly visible on the Internet or not. - Page 92 Using Solar-Log WEB Enter the password from the image. This system is used to prevent bots from trying to access our server. Register Now Confirm the information entered by clicking on If you forgot to enter a password or entered the wrong one, a new password is automatically generated again without having to reenter all of the information.
-
Page 93: Accessing Plant Data
Using Solar-Log WEB Accessing Plant data Start your browser and go to the Solar-LogTM WEB start page. Enter the URL that you received in your confirmation e-mail in the address bar. http://home10.solarlog-web.de/ For example: The welcome screen is displayed. Fig.: C2 registration site... -
Page 94: Fig.: C2 Plant Search Screen
Using Solar-Log WEB Fig.: C2 Plant search screen Here you have the following search options: • Zip code • Plant size from to • Production year • Module type • Orientation from to • Roof pitch from to Only results... -
Page 95: Fig.: C2 Plant Search With Results
Using Solar-Log WEB The search results overview of the plants includes the number of installed inverters, their power output, orientation and roof pitch. A standard default image is used if there is no publicly viewable image available. You can also find an overview of the current plant yields in the column on the right. -
Page 96: Fig.: C2 Plant With A Day Curve
Using Solar-Log WEB Plant link Clink on the above the day graph from today. The graphic overview of the plant is displayed. Fig.: C2 plant with a day curve The graphic overview displays additional options that can be selected for your plant, such as current value, day yield and any fault notifications if present. -
Page 97: Accessing Yield Data
Using Solar-Log WEB Accessing Yield data 7.3.1 How to navigate between different overviews How you navigate the website overviews corresponds to navigating the overview page from your local network. Switching between overviews Move your mouse to the inverted triangle on the left next to the displayed period. -
Page 98: Daily Overview
Using Solar-Log WEB 7.3.3 Daily Overview Start your browser and click on the bookmark for your plant. • You might have to log on. • The plant details overview is then displayed. Select Graphic from the menu on the left. -
Page 99: Monthly Overview
Using Solar-Log WEB Additional functions with S0 power meters The following displays are additionally available when an S0 power meter is connected to the Solar-Log™. • CM: Displays the power consumption of your building as a graphic in watts. •... -
Page 100: Annual Overview
Using Solar-Log WEB 7.3.5 Annual Overview Select Annual Overview from the navigation menu. Fig.: Plant C2 - Annual Overview The monthly yields from a year are displayed as a total in a bar graph. The dark green lines indicate the an- nual target yield. -
Page 101: Total Overview
Using Solar-Log WEB 7.3.6 Total Overview Select Overview of all Years from the navigation menu. Fig.: Plant C2 - Total Overview The individual annual yields are displayed as a total in a bar graph. The dark green line indicates the annual target yield. -
Page 102: Accessing And Filtering The Event Log
Using Solar-Log WEB 7.3.7 Accessing and filtering the Event log Select Events from the menu on the left. • The complete list of all of the system events is displayed. Fig.: Plant C2 - Notifications Use the filter function to view a particular event or events from a particular day within the last 35 days. -
Page 103: Fig.: Plant C2 - Filtered Notifications
Using Solar-Log WEB Fig.: Plant C2 - Filtered notifications Select the desired inverters from the "All inverters" drop-box. • Only the events from the selected inverters are displayed. Limit your selection by selecting the desired day from the All Days drop-box. -
Page 104: Using The Solar-Log™ Android App
8 Using the Solar-Log™ Android App We offer a Solar-Log™ App for Android tablet PCs and smartphones to allow you to access your plant data at any time and from any location. The App is available for free from the Google Play store. -
Page 105: Add Plants
Using the Solar-Log™ Android App Add plants You can monitor as many plants with the App as are connected with a Solar-Log™. Go to the toolbar to monitor a plant. Fig.: The App's toolbar Touch the symbol in the toolbar. -
Page 106: Plant Settings
Using the Solar-Log™ Android App Fig.: Entering the plant name in the App. After that the Plant Name appears. Check that everything is correct and then touch The plant's current daily values will then be loaded. This can take a moment. -
Page 107: Administration
Using the Solar-Log™ Android App S0 meter 's view settings have the following options: • Display power consumption • Calculate energy balance 8.3.2 Administration Be selecting Management , you can update the plant configuration, reset yield data or also delete the plant. -
Page 108: The Toolbar
Using the Solar-Log™ Android App The Toolbar You can select the desired menu from the toolbar at the top right corner. Fig.: Toolbar. Use the symbol to add a plant. By selecting the symbol, you can display various yield values. -
Page 109: Accessing Yield Values
Using the Solar-Log™ Android App Accessing Yield values After your plant has been correctly recognized, the yield values are displayed with the current daily values in the overview. Note The data is only updated when your mobile device is connected to the Internet. -
Page 110: Daily Overview
Using the Solar-Log™ Android App 8.5.1 Daily Overview Tap on the symbol in the toolbar at the top right corner of the screen. The navigation screen then appears. Select to go to the daily overview. Fig.: Day curve. Swipe to the left to go to the next view or to the right to go back to the previous view. -
Page 111: Annual Overview
Using the Solar-Log™ Android App The daily yields of the selected month are displayed as a bar graph. Swipe to the left to go to the next view or to the right to go back to the previous view. Swipe up or down to change the module views. -
Page 112: Total Overview
Using the Solar-Log™ Android App 8.5.4 Total Overview Tap on the symbol in the toolbar at the top right corner of the screen. The navigation screen then appears. Select Total to go to the Total Overview. Fig.: Total Overview as a bar graph... -
Page 113: Viewing Co2 Savings
Using the Solar-Log™ Android App Viewing CO2 savings Tap on the symbol in the toolbar at the top right corner of the screen. The navigation screen then appears. Select The total accumulated amount of carbon dioxide emissions that have been prevented by your plant is displayed. -
Page 114: App Settings
Using the Solar-Log™ Android App App settings Tap on the symbol in the toolbar at the top right corner of the screen. The navigation screen then appears. • Update • Today • Settings • Fig.: Day curve and menu •... -
Page 115: Periodical Data Update
Using the Solar-Log™ Android App 8.7.1 Periodical data update Under General , tap on Periodical data update The following setting options will become visible. Fig.: Periodical data update settings Tap on the update interval to automatically update the data. The window automatically closes after the selec- tion. -
Page 116: Slide Show
Using the Solar-Log™ Android App 8.7.3 Slide show In the Slide Show menu, you have the option to adjust the display duration settings and to select a back- ground image. Slide Show By selecting , the following settings are available: •... -
Page 117: Legal Disclaimer
The Yield Data as a Slide Show With the slide show function, you can turn your tablet PC or smartphone into an "electronic picture frame." The "picture frame" alternates in displaying the various modules of the Solar-Log™ App. Tap the screen. -
Page 118: Using The Android App With A Smartphone
Using the Solar-Log™ Android App Using the Android App with a Smartphone When using the Android App with a smartphone, some menus differ from those with a tablet PC. In con- trast to the tablet PC, there are minor differences between the vertical and horizontal format. -
Page 119: Smartphone - Horizontal Format
Using the Solar-Log™ Android App Fig.: Selection via the menu button Back button Use the on the smartphone (see the phone's user manual) to return to the program. 8.9.2 Smartphone - horizontal format The only difference between the horizontal and vertical format is that the Slide Show can also be selected from the toolbar. -
Page 120: Solar-Log™ Widget For Smartphones
Using the Solar-Log™ Android App 8.9.3 Solar-Log™ Widget for Smartphones With an Android smartphone, you can display yield reports from your plant with the Solar-Log™ Widget. (Activating Widgets: see the phone's user manual). The Widget allows the plant's current daily yields to be displayed directly on your smartphone's home screen. -
Page 121: Using The Solar-Log™ App Iphone V3 For Iphones
We offer a Solar-Log™ App iPhone V3 for iPhones, iPads and iPod Touches to allow you to access your plant data at any time and from any location. The Solar-Log™ App is available for free from the Apple App Store. -
Page 122: Add Plants
Using the Solar-Log™ App iPhone V3 for iPhones Add plants You can monitor as many plants with the App as are connected with a Solar-Log™. Fig.: Saved plants Touch the symbol. • The screen New Plant is then displayed. -
Page 123: Fig.: Add Plants
Using the Solar-Log™ App iPhone V3 for iPhones Fig.: Add plants Enter the Serial Number Password from the registration email that you received from Solare Datensysteme GmbH. Save the added plant. The plant now appears with a name and URL in the plant menu. -
Page 124: Accessing Yield Data
Using the Solar-Log™ App iPhone V3 for iPhones Accessing Yield data After your plant has been correctly recognized, the yield data is displayed in the plant overview. Note The data is only updated when your iOS device is connected to the Internet. - Page 125 Using the Solar-Log™ App iPhone V3 for iPhones Fig.: Day curve with the top and bottom menu selection...
-
Page 126: The Top Menu Bar
Using the Solar-Log™ App iPhone V3 for iPhones The top menu bar The following items can be selected from the top menu bar: • Back • Today • Legend • Slide show Touch Back to go back to the plant settings page. -
Page 127: The Bottom Menu Bar
Using the Solar-Log™ App iPhone V3 for iPhones The bottom menu bar The following items can be selected from the bottom menu bar: • • Month • Year • Total • • Plant 9.5.1 Daily Overview Tap the screen. •... -
Page 128: Monthly Overview
Using the Solar-Log™ App iPhone V3 for iPhones 9.5.2 Monthly Overview Tap the screen. • The bottom menu bar is displayed. Select Month to go to the monthly values. Fig.: Monthly Overview in horizontal format The daily yields of the selected month are displayed as a bar graph. The dotted line in the view displays the plant's calculated target value based on the annual forecast. -
Page 129: Annual Overview
Using the Solar-Log™ App iPhone V3 for iPhones 9.5.3 Annual Overview Tap the screen. • The bottom menu bar is displayed. Select Year to go to the yearly values. Fig.: Annual Overview in horizontal format The monthly yields of the selected year are displayed as a bar graph. The dotted line in the view displays the plant's calculated target value based on the annual forecast. -
Page 130: Total Overview
Using the Solar-Log™ App iPhone V3 for iPhones 9.5.4 Total Overview Tap the screen. • The bottom menu bar is displayed. Select Total to go to the Total View. Fig.: Total Overview in horizontal format The annual yields of the total view are displayed as a bar graph. The dotted line in the view displays the plant's calculated target value based on the annual forecast. -
Page 131: Viewing Co2 Savings
Using the Solar-Log™ App iPhone V3 for iPhones Viewing CO2 savings Tap the screen. • The bottom menu bar is displayed. Select CO2. • The total accumulated amount of carbon dioxide emissions that have been prevented by your plant is displayed. -
Page 132: Viewing Plant Data
Using the Solar-Log™ App iPhone V3 for iPhones Viewing Plant data Tap the screen. • The bottom menu bar is displayed. Select Plant to go to the page with the plant details. The page displays the following plant data: •... -
Page 133: Fig.: Display Settings
Using the Solar-Log™ App iPhone V3 for iPhones Fig.: Display settings In addition, you can also adjust the following settings from these menu items: • Images. • Select plant image. • Select background image. • Consumption (can only be activated if a meter is connected). -
Page 134: The Yield Data As A Slide Show
With the slide show function, you can turn your iOS device into an "electronic picture frame." The "picture frame" alternates in displaying the various modules of the Solar-Log™ App. The Slide Show function can be configured in the settings menu. -
Page 135: Start The Slide Show
Using the Solar-Log™ App iPhone V3 for iPhones 9.8.1 Start the Slide Show Tap the screen. The menu bar is displayed. Fig.: Screen with the top and bottom menu selection Select Slide Show from the top menu bar. • Now you can always see the current values. -
Page 136: Cleaning And Care
Cleaning and care 10 Cleaning and care 10.1 Cleaning tips Important: Be sure to unplug the device prior to cleaning it! • Clean the device on the outside only with a dry, lint-free cloth. • If the device is very dirty, it can be cleaned with a slightly damp cloth and a commercially available household cleaner. -
Page 137: Notifications On The Lcd Status Display
Notifications on the LCD Status Display (Solar-Log 300, 1200 and 2000) 11 Notifications on the LCD Status Display (Solar-Log 300, 1200 and 2000) The Solar-Log 300, 1200 and 2000 have an LCD status display for notifications during installation and operation. 11.1 Meaning of the symbols on the LCD display The following symbols are shown on the Solar-Log™... - Page 138 Notifications on the LCD Status Display (Solar-Log 300, 1200 and 2000) Sensors for - Irradiation - Wind - Temperature Meter Booting progress SIM card Easy Installation active GPRS available Notifications from the Solar-Log™ Signal strength in combination with GPRS, WiFi or Bluetooth...
- Page 139 Notifications on the LCD Status Display (Solar-Log 300, 1200 and 2000) Note Please refer to the chapters "Notifications on the LCD display," "Fault messages" and "Faults" in the Installation Manual for further explanation on the LCD Status Code.
-
Page 140: Faults (Solar-Log 200, 500 And 1000)
12 Faults (Solar-Log 200, 500 and 1000) 12.1 LED status display (Solar-Log 200, 500 and 1000) On the front of the unit at the bottom left are four LEDs that show the operating status of the unit. Fig.: Status LEDs Depending on the operating status, LED 1, LED 2 and LED E may flash quickly or slowly, and may be lit steadily or switched off. -
Page 141: Troubleshooting Faults Oneself
Faults (Solar-Log 200, 500 and 1000) Faults LED 1 LED 2 LED E LED P Meaning and possible remedy quickly quickly For 5 min. during initialization: Error! » Pull out power plug and plug in again. slow slow Failed to synchronize the time via the Internet. -
Page 142: Obtaining Information From The Internet
Faults (Solar-Log 200, 500 and 1000) Fig.: Removing the cover from the Solar-Log™ Pull the cover forward to remove. Restarting 1. Press the reset button for a long period, e.g. with a straightened paper clip • LED:1, 2 2. Release the reset button. -
Page 143: Informing A Specialist Technician
Faults (Solar-Log 200, 500 and 1000) 12.4 Informing a specialist technician If problems occur with the Solar-Log™ that are not able to be remedied using the measures described, we recommend that you contact your installer or our customer service. -
Page 144: Disposal
Disposal 13 Disposal Important: Solar-Log™ contains electronic components that can release highly toxic substanc- es if burned or disposed of along with domestic waste. Note Make sure you dispose of the Solar-Log™ as electronic scrap in the recycling cen- ter. -
Page 145: Technical Data (Solar-Log 300, 1200 And 2000)
Technical Data (Solar-Log 300, 1200 and 2000) 14 Technical Data (Solar-Log 300, 1200 and 2000) Product comparison Solar-Log 300 Solar-Log 1200 Solar-Log 2000 PM+ / WiFi PM+ / GPRS Bluetooth (BT) WiFi (Wireless LAN) Bluetooth (BT) / WiFi GPRS Solar-Log... - Page 146 3) Using every inverter on the same bus is not always possible; see the inverter database www.solar-log.com. 4) Solar-Log 2000 PM+ / GPRS interfaces: 1 x RS485, 1 x RS485 / RS422, 1 x CAN (1 INV manufacturer per bus).
- Page 147 Technical Data (Solar-Log 300, 1200 and 2000) Accessories Solar-Log 300 Solar-Log 1200 Solar-Log 2000 Ready-to-install cable kits for most supported inverters Digital electricity meter PowerLine Package Accessories RS485 Wireless Package Sensors Surge protection Special PiggyBack RS485 (except TL-20 series) Accessories for SMA inverters...
- Page 148 Technical Data (Solar-Log 300, 1200 and 2000) Article Number Solar-Log 300 Solar-Log 1200 Solar-Log 2000 Standard 255574 255591 255592 255577 255585 WiFi 255576 255584 BT / WiFi 255578 255586 255579 255587 255594 PM+ / WiFi 255580 255588 GPRS 255575 255583...
- Page 149 Technical Data (Solar-Log 300, 1200 and 2000) Interfaces Solar-Log 300 Solar-Log 1200 Solar-Log 2000 RS485 A – RS485 – interface, interface, RS485 / RS422 RS485 / RS422 RS485 / RS422 B RS485/RS422 – interface usage – combined – combined – / RS485 / RS422...
- Page 150 Technical Data (Solar-Log 300, 1200 and 2000) Interfaces Solar-Log 300 Solar-Log 1200 Solar-Log 2000 Network Connection to the Internet (Ethernet, fixed IP address or DHCP) Antenna connection and SIM card slot GPRS (optional) for Solar-Log™ with integrated GPRS * not with GPRS models...
-
Page 151: Technical Data (Solar-Log 200, 500 And 1000)
Technical Data (Solar-Log 200, 500 and 1000) 15 Technical Data (Solar-Log 200, 500 and 1000) 1000 Product comparison Solar-Log Solar-Log Solar-Log PM+ / WiFi PM+ / GPRS Bluetooth (BT) WiFi (Wireless Lan) Bluetooth (BT) / WiFi GPRS Central inverter SCB and SMB (2) Max. - Page 152 1) Depending on the inverter used and the cable length (details can also vary from one type of device to another). 2) Other important information about Bluetooth and compatibility, Power Management, self-con- sumption and SCB and SMB inverters can be found on our website www.solar-log.com. 3) Operation with RS422 inverter is not possible on the same bus.
- Page 153 Local network accessibility The IP address of the Solar-Log™ no longer needs to be known, un- less there are several Solar-Logs in the network. Monitor and optimize the consumption of self-produced power...
- Page 154 Operating via a web browser within your own network...
- Page 155 Operating via a web browser within your own network...
- Page 156 List of figures 16 List of figures Fig.: Navigation designations ..................................... 9 Fig.: Log in button with selection box ..................................10 Fig.: Header bar with the “Hide Arrow” ................................10 Fig.: Welcome screen ........................................12 Fig.: The plant's current values ....................................13 Fig.: Graphic display of the plant's total production .............................14 Fig.: Daily View of the Production Graph with the Auto Scaling activated ..................15 Fig.: Day view of the production table .................................16 Fig.: Month view production graph ..................................
-
Page 157: List Of Figures
List of figures Fig.: C2 Plant search with results ...................................95 Fig.: C2 plant with a day curve ....................................96 Fig.: C2 Navigating in the view ....................................97 Fig.: Day curve with additional values .................................98 Fig.: Plant C2 - Monthly Overview ..................................99 Fig.: Plant C2 - Annual Overview .................................. - Page 158 +49 7428 9418 200 written consent of Solare Datensysteme GmbH. Fax: +49 7428 9418 280 Subject to change without notice! info@solar-log.com Non-compliance resulting in contradiction of the www.solar-log.com above-mentioned specifications shall result in obli- www.solarlog-WEB.com gation to provide compensation for damages.
Need help?
Do you have a question about the 300 and is the answer not in the manual?
Questions and answers