Rohde & Schwarz ZVH4 Operating Manual
Cable and antenna analyzer
Hide thumbs
Also See for ZVH4:
- Operating manual (242 pages) ,
- Manual (7 pages) ,
- Operating manual (246 pages)
Table of Contents
Advertisement
Quick Links
Advertisement
Table of Contents

Subscribe to Our Youtube Channel
Related Manuals for Rohde & Schwarz ZVH4


Summary of Contents for Rohde & Schwarz ZVH4
-
Page 1: Operating Manual
R&S ® Cable and Antenna Analyzer Operating Manual 1309.6946.12 – 04... - Page 2 ® The Operating Manual describes the following R&S ZVH models and options R&S ZVH4 (1309.6800.24) R&S ZVH8 (1309.6800.28) R&S ZVH-K1 (1309.6823.02) R&S ZVH-K9 (1309.6852.02) R&S ZVH-K14 (1309.7007.02) R&S ZVH-K39 (1309.6830.02) R&S ZVH-K42 (1309.6846.02) R&S ZVH-K45 (1309.6998.02) The contents of this manual correspond to firmware version 1.30 and higher.
-
Page 3: Basic Safety Instructions
R&S ZVH Basic Safety Instructions Basic Safety Instructions Always read through and comply with the following safety instructions! All plants and locations of the Rohde & Schwarz group of companies make every effort to keep the safety standards of our products up to date and to offer our customers the highest possible degree of safety. - Page 4 R&S ZVH Basic Safety Instructions Observing the safety instructions will help prevent personal injury or damage of any kind caused by dangerous situations. Therefore, carefully read through and adhere to the following safety instructions before and when using the product. It is also absolutely essential to observe the additional safety instructions on personal safety, for example, that appear in relevant parts of the product documentation.
- Page 5 R&S ZVH Basic Safety Instructions 2. Do not place the product on heat-generating devices such as radiators or fan heaters. The ambient temperature must not exceed the maximum temperature specified in the product documentation or in the data sheet. Product overheating can cause electric shock, fire and/or serious personal injury or death.
- Page 6 R&S ZVH Basic Safety Instructions 11. Use suitable overvoltage protection to ensure that no overvoltage (such as that caused by a bolt of lightning) can reach the product. Otherwise, the person operating the product will be exposed to the danger of an electric shock. 12.
- Page 7 R&S ZVH Basic Safety Instructions Repair and service 1. The product may be opened only by authorized, specially trained personnel. Before any work is performed on the product or before the product is opened, it must be disconnected from the AC supply network. Otherwise, personnel will be exposed to the risk of an electric shock.
- Page 8 R&S ZVH Informaciones Elementales de Seguridad Transport 1. Handles on the products are designed exclusively to enable personnel to transport the product. It is therefore not permissible to use handles to fasten the product to or on transport equipment such as cranes, fork lifts, wagons, etc. The user is responsible for securely fastening the products to or on the means of transport or lifting.
- Page 9 R&S ZVH Informaciones Elementales de Seguridad Además queda en la responsabilidad del usuario utilizar el producto en la forma debida. Este producto está destinado exclusivamente al uso en la industria y el laboratorio o, si ha sido expresamente autorizado, para aplicaciones de campo y de ninguna manera deberá...
- Page 10 R&S ZVH Informaciones Elementales de Seguridad Palabras de señal y su significado PELIGRO identifica un peligro inminente con riesgo elevado que provocará muerte o lesiones graves si no se evita. ADVERTENCIA identifica un posible peligro con riesgo medio de provocar muerte o lesiones (graves) si no se evita. ATENCIÓN identifica un peligro con riesgo reducido de provocar lesiones leves o moderadas si no se evita.
- Page 11 R&S ZVH Informaciones Elementales de Seguridad Seguridad eléctrica Si no se siguen (o se siguen de modo insuficiente) las indicaciones del fabricante en cuanto a seguridad eléctrica, pueden producirse choques eléctricos, incendios y/o lesiones graves con posible consecuencia de muerte. 1.
- Page 12 R&S ZVH Informaciones Elementales de Seguridad 11. Todo producto debe estar protegido contra sobretensión (debida p. ej. a una caída del rayo) mediante los correspondientes sistemas de protección. Si no, el personal que lo utilice quedará expuesto al peligro de choque eléctrico. 12.
- Page 13 R&S ZVH Informaciones Elementales de Seguridad Reparación y mantenimiento 1. El producto solamente debe ser abierto por personal especializado con autorización para ello. Antes de manipular el producto o abrirlo, es obligatorio desconectarlo de la tensión de alimentación, para evitar toda posibilidad de choque eléctrico.
- Page 14 R&S ZVH Informaciones Elementales de Seguridad 8. Las baterías y celdas deben reciclarse y no deben tirarse a la basura doméstica. Las baterías o acumuladores que contienen plomo, mercurio o cadmio deben tratarse como residuos especiales. Respete en esta relación las normas nacionales de eliminación y reciclaje.
- Page 15 Safety Instructions Kundeninformation zum Batteriegesetz (BattG) Dieses Gerät enthält eine Batterie bzw. Akkumulator. Die- se dürfen nicht mit dem Hausmüll entsorgt werden. Nach Ende der Lebensdauer darf die Entsorgung nur über eine geeignete Sammelstelle oder eine Rohde & Schwarz- Kundendienststelle erfolgen. Beachten Sie unbedingt die Hinweise zu Batterien und Akkumulatoren in den grundlegenden Sicherheitshinwei- sen.
- Page 16 Customer Information Regarding Product Disposal The German Electrical and Electronic Equipment (ElektroG) Act is an implementation of the following EC directives: • 2002/96/EC on waste electrical and electronic equipment (WEEE) and • 2002/95/EC on the restriction of the use of certain hazardous substances in e lectrical and electronic equipment (RoHS).
- Page 17 Customer Support Technical support – where and when you need it For quick, expert help with any Rohde & Schwarz equipment, contact one of our Customer Support Centers. A team of highly qualified engineers provides telephone support and will work with you to find a solution to your query on any aspect of the operation, programming or applications of Rohde &...
- Page 18 Qualitätszertifikat Certified Quality System ISO 9001 Certificate of quality Certified Environmental System Certificat de qualité ISO 14001 Sehr geehrter Kunde, Dear Customer, Cher client, Sie haben sich für den Kauf eines You have decided to buy a Vous avez choisi d’acheter un pro- Rohde &...
- Page 19 CE Declaration of Conformity Certificate No.: 2010-70 This is to certify that: Equipment type Stock No. Designation ZVH4 1309.6800.24 Handheld Cable and Antenna Analyzer ZVH8 1309.6800.28 complies with the provisions of the Directive of the Council of the European Union on the...
-
Page 20: Table Of Contents
R&S ZVH Table of Contents Table of Contents 1 Operating the R&S ZVH..............11 Screen Layout and Elements..................11 Means of Input......................12 1.2.1 Using the Alphanumeric Keys..................12 1.2.2 Confirming and Cancelling Entries ................13 1.2.3 Using the Rotary Knob....................13 1.2.4 Using the Cursor Keys ....................14 Presetting the R&S ZVH ....................14 Taking Screenshots....................15 Measurement Setup....................16... - Page 21 R&S ZVH Table of Contents 1.9.3.5 Sweep Configuration and Bandwidth Selection............25 1.9.3.6 Trace Functionality.......................25 1.9.3.7 Display and Limit Lines ....................25 1.9.3.8 Markers ........................26 1.9.4 Functions of the Network Analyzer (R&S ZVH-K42) ...........26 1.9.4.1 Measurement Configuration ..................26 1.9.4.2 Frequency Parameters ....................27 1.9.4.3 Measurement Format Selection...................27 1.9.4.4...
- Page 22 R&S ZVH Table of Contents 2.2.1.3 Working with a DTF List....................42 2.2.2 Configuring the Horizontal Axis ...................43 2.2.2.1 Setting the Frequency Range for DTF Measurements..........43 2.2.2.2 Setting the Start and Stop Distance for DTF Measurements ........44 2.2.2.3 Setting the Frequency Range for CAT Measurements (except DTF) ......45 2.2.2.4 Selecting a Signal Standard for CAT Measurements (except DTF)......45 2.2.3...
- Page 23 R&S ZVH Table of Contents 3.1.2 Using the Measurement Wizard ..................59 3.1.2.1 Starting the Measurement Wizard ................59 3.1.2.2 Performing a Sequence of Measurements ..............61 3.1.3 Evaluating Results .......................63 4 Spectrum Analyzer Mode (R&S ZVH-K1) ........65 Performing Spectrum Measurements..............65 4.1.1 Measuring the Channel Power of Continuously Modulated Signals......65 4.1.1.1 Selecting the Standard ....................66...
- Page 24 R&S ZVH Table of Contents 4.1.5.2 Optimizing Measurement Settings................85 4.1.5.3 Viewing the Results in a Table ..................85 4.1.6 Measuring the Harmonic Distortion ................86 4.1.6.1 Defining the Number of Harmonics................87 4.1.6.2 Optimizing the Display of Harmonics................88 4.1.6.3 Activating the Harmonics List ..................88 4.1.7 Measuring the AM Modulation Depth ................88 4.1.7.1...
- Page 25 R&S ZVH Table of Contents 4.2.3 Setting Bandwidths ....................108 4.2.3.1 Setting the Resolution Bandwidth................108 4.2.3.2 Setting the Video Bandwidth..................109 4.2.4 Configuring and Triggering the Sweep ..............111 4.2.4.1 Setting the Sweep Time.....................111 4.2.4.2 Selecting the Sweep Mode ..................111 4.2.4.3 Working with Trigger Functionality................112 4.2.5 Working with Traces ....................115 4.2.5.1...
- Page 26 R&S ZVH Table of Contents 6 Network Analyzer Mode (R&S ZVH-K42)........141 Calibrating Measurements..................142 6.1.1.1 Calibration States.......................143 6.1.1.2 Calibration Methods ....................143 6.1.1.3 Performing Calibration ....................143 Performing Vector Measurements .................145 6.2.1 Measuring the Transmission..................145 6.2.2 Measuring the Reflection ...................147 Evaluating the Results ....................148 6.3.1 Selecting the Measurement Format................148 6.3.1.1...
- Page 27 R&S ZVH Table of Contents 8 How a Spectrum Analyzer Works ..........167 Operating Manual 1309.6946.12 - 04...
- Page 28 R&S ZVH Documentation Overview Documentation Overview The user documentation for the R&S ZVH is divided as follows: Quick Start Guide The Quick Start Guide provides basic information on the instrument's functions. It covers the following topics: overview of all elements of the front and rear panels basic information on how to set up the R&S ZVH information on how to operate the R&S ZVH in a network instructions on how to perform measurements...
- Page 29 R&S ZVH Conventions Used in the Documentation Conventions Used in the Documentation The following conventions are used throughout the R&S R&S ZVH Operating Manual: Typographical conventions Convention Description “Graphical user interface elements” All names of graphical user interface elements both on the screen and on the front and rear panels, such as dialog boxes, softkeys, menus, options, buttons etc., are enclosed by quotation marks.
-
Page 30: Operating The R&S Zvh
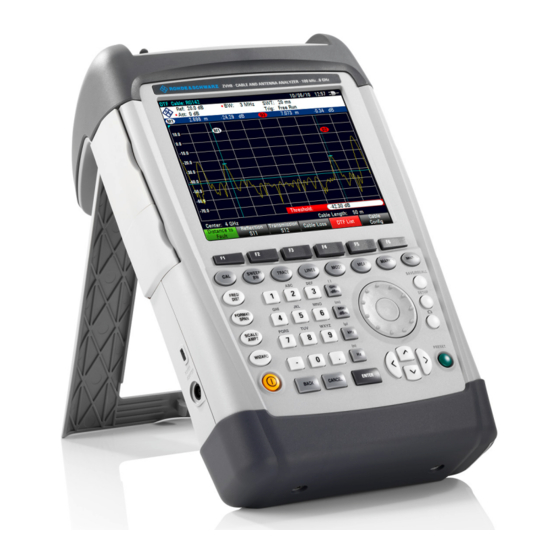
R&S ZVH Operating the R&S ZVH Screen Layout and Elements 1 Operating the R&S ZVH This chapter provides information about basic functionality and about the user interface of the R&S ZVH. 1.1 Screen Layout and Elements The following figure shows the screen layout in cable and antenna test operating mode. -
Page 31: Means Of Input
R&S ZVH Operating the R&S ZVH Means of Input 1.2 Means of Input The user interface of the R&S ZVH provides several elements for you to input data. Alphanumeric keys Unit keys Rotary knob Cursor keys Enter key Cancel key Back key 1.2.1 Using the Alphanumeric Keys Using the alphanumeric keys, you can enter numeric values or characters. -
Page 32: Confirming And Cancelling Entries
R&S ZVH Operating the R&S ZVH Means of Input blank 1.2.2 Confirming and Cancelling Entries Depending on the input you have made, there are several ways to confirm entries. Values without unit or values that have a fixed unit that you enter in an input field can be confirmed with the ENTER key or by pressing the center of the rotary knob. -
Page 33: Using The Cursor Keys
R&S ZVH Operating the R&S ZVH Presetting the R&S ZVH The rotary knob moves markers around. Again the step size is fixed. Pressing the rotary knob has the same effect as pressing the ENTER key as it confirms an entry or selection. 1.2.4 Using the Cursor Keys Using the cursor keys, you can do several things. -
Page 34: Taking Screenshots
R&S ZVH Operating the R&S ZVH Taking Screenshots 1.4 Taking Screenshots You can take and store a screenshot of the current screen anytime with the key. M Press the key. The R&S ZVH takes a screenshot. If available, the R&S ZVH stores the screenshot on an external storage device (USB memory stick or SD card). -
Page 35: Measurement Setup
R&S ZVH Operating the R&S ZVH Measurement Setup 1.5 Measurement Setup The "Measurement Setup" dialog box provides an overview of the current configuration of the R&S ZVH. In addition, you can also change the configuration in this dialog box. M Press the SETUP key. M Press the "Measurement Setup"... -
Page 36: Menu And Softkey Overview
R&S ZVH Operating the R&S ZVH Menu and Softkey Overview 1.9 Menu and Softkey Overview This chapter shows an overview of all instrument functions in the form of softkey and menu overviews. 1.9.1 General Functions General functions are those that are available for all operating modes. 1.9.1.1 General R&S ZVH Setup The SETUP key opens the setup menu that contains functionality to set up the... -
Page 37: File Management
R&S ZVH Operating the R&S ZVH Menu and Softkey Overview 1.9.1.2 File Management The SAVE/RECALL key opens the file manager that contains functionality to manage datasets and other files. 1.9.1.3 Operating Mode Selection The MODE key opens the mode menu that contains functionality to select the operating mode of the R&S ZVH. -
Page 38: Amplitude Parameters
R&S ZVH Operating the R&S ZVH Menu and Softkey Overview This is what the frequency menu looks like for distance-to-fault measurements. This is what the frequency menu looks like for reflection, transmission and cable loss measurements. 1.9.2.2 Amplitude Parameters The SCALE/AMPT key opens the amplitude menu that contains functionality to set up the vertical axis of the measurement diagram. -
Page 39: Markers
R&S ZVH Operating the R&S ZVH Menu and Softkey Overview 1.9.2.4 Markers The MARKER and MKR keys open the marker menu and marker to menu that contain functionality to use markers. This is what the marker menu looks like. This is what the marker to menu looks like. 1.9.2.5 Measurement Selection and Configuration The MEAS key opens the measurement menu that contains functionality to select and... -
Page 40: Measurement Calibration
R&S ZVH Operating the R&S ZVH Menu and Softkey Overview 1.9.2.7 Measurement Calibration The CAL key opens the calibration menu that contains functionality to calibrate the R&S ZVH. 1.9.3 Functions of the Spectrum Analyzer (R&S ZVH-K1) This section contains all softkeys and menus that are available in spectrum analyzer mode. - Page 41 R&S ZVH Operating the R&S ZVH Menu and Softkey Overview Channel Power Occupied Bandwith TDMA Power Operating Manual 1309.6946.12 - 04...
- Page 42 R&S ZVH Operating the R&S ZVH Menu and Softkey Overview Spectrum Emission Mask Harmonic Distortion AM Modulation Depth Spectrogram Spectrogram Playback Operating Manual 1309.6946.12 - 04...
-
Page 43: Frequency Parameters
R&S ZVH Operating the R&S ZVH Menu and Softkey Overview 1.9.3.2 Frequency Parameters The FREQ/DIST key opens the frequency menu that contains functionality to set up the horizontal axis of the measurement diagram. 1.9.3.3 Span Selection The FORMAT/SPAN key opens the span menu that contains functionality to set the span. -
Page 44: Sweep Configuration And Bandwidth Selection
R&S ZVH Operating the R&S ZVH Menu and Softkey Overview 1.9.3.5 Sweep Configuration and Bandwidth Selection The SWEEP/BW key opens a menu that contains all functionality to configure the sweep including the bandwidths. 1.9.3.6 Trace Functionality The TRACE key opens the trace menu that contains functionality to set up the traces. 1.9.3.7 Display and Limit Lines The LINES key opens a menu that contains the functionality to control display and limit... -
Page 45: Markers
R&S ZVH Operating the R&S ZVH Menu and Softkey Overview 1.9.3.8 Markers The MARKER and MKR keys open a menus to control markers and use marker functions. Softkey in the Marker Menu Softkeys in the Marker To Menu 1.9.4 Functions of the Network Analyzer (R&S ZVH-K42) This section contains all softkeys and menus that are available in network analyzer mode. -
Page 46: Frequency Parameters
R&S ZVH Operating the R&S ZVH Menu and Softkey Overview 1.9.4.2 Frequency Parameters The FREQ/DIST key opens the frequency menu that contains functionality to set up the horizontal axis of the measurement diagram. 1.9.4.3 Measurement Format Selection The FORMAT/SPAN key opens the span menu that contains available measurement formats. -
Page 47: Trace Functionality
R&S ZVH Operating the R&S ZVH Menu and Softkey Overview 1.9.4.6 Trace Functionality The TRACE key opens the trace menu that contains functionality to set up the traces. 1.9.4.7 Limit Lines The LINES key opens a menu that contains the functionality to control limit lines. 1.9.4.8 Markers The MARKER and MKR... -
Page 48: Functions Of The Power Meter
R&S ZVH Operating the R&S ZVH Menu and Softkey Overview Softkeys in the Marker To Menu 1.9.5 Functions of the Power Meter This section contains all softkeys and menus that are available in power meter mode. 1.9.5.1 Power Meter Measurements The MEAS key opens a menu that contains the functionality to configure measurements with the power meter. -
Page 49: Frequency Parameters
R&S ZVH Operating the R&S ZVH Menu and Softkey Overview 1.9.5.2 Frequency Parameters The FREQ/DIST key opens a menu that contains the functionality to set the frequency. 1.9.5.3 Amplitude Parameters The SCALE/AMPT key contains functionality to configure level parameters. 1.9.5.4 Sweep Configuration The SWEEP/BW key opens a menu that contains functionality to configure the sweep. -
Page 50: Cable And Antenna Test Mode
R&S ZVH Cable and Antenna Test Mode Menu and Softkey Overview 2 Cable and Antenna Test Mode The cable and antenna test (CAT) mode provides functionality to measure cables and antennas of transmission equipment in wireless telecommunication systems. In a perfect system, the signal would arrive at the antenna without any losses and be transmitted with the required power and frequency. - Page 51 R&S ZVH Cable and Antenna Test Mode Menu and Softkey Overview M Connect the RF cable to the RF input (port 1 or 2). M Connect the test cable to the RF cable. M For measurement on DUTs that need an external voltage supply (e.g. power amplifiers), you can connect the supply voltage from a suitable AC power supply to the BIAS Port 1 or use the internal bias.
-
Page 52: Performing Cable And Antenna Measurements
R&S ZVH Cable and Antenna Test Mode Performing Cable and Antenna Measurements 2.1 Performing Cable and Antenna Measurements In order to get an idea about problems in a transmission system that is exact as possible, the R&S ZVH features several measurements. Each measurement shows another aspect of the cable characteristics. -
Page 53: Distance To Fault Measurements
R&S ZVH Cable and Antenna Test Mode Performing Cable and Antenna Measurements 2.1.2 Distance to Fault Measurements The distance to fault (DTF) measurement determines the exact location of possible faults in a transmission system. If you connect the end of the cable to the R&S ZVH, the DTF measurement shows you the exact distance to the fault (in meter or feet), regardless by what the fault is caused. -
Page 54: 1-Port Cable Loss Measurements
R&S ZVH Cable and Antenna Test Mode Performing Cable and Antenna Measurements 2.1.3 1-Port Cable Loss Measurements The cable loss measurement evaluates the power attenuation of a cable over a specified frequency range in dB. The amount of power that gets absorbed depends on the frequency and the length of the cable. -
Page 55: Selecting The Measurement Format
R&S ZVH Cable and Antenna Test Mode Performing Cable and Antenna Measurements The Figure below shows the results of a transmission measurement on a filter. The results show that the filter works as it's supposed to. 2.1.5 Selecting the Measurement Format You can select several measurement formats for each measurement. -
Page 56: Calibrating Measurements
R&S ZVH Cable and Antenna Test Mode Performing Cable and Antenna Measurements The following pictures show the results of a reflection measurement in Magnitude format (left side) and VSWR format (right side). 2.1.6 Calibrating Measurements You will need one of the available calibration standards R&S FSH-Z28, -Z29 (order no. 1300.7804.03 and 1300.7504.03) or R&S ZV-Z121 (order no. - Page 57 R&S ZVH Cable and Antenna Test Mode Performing Cable and Antenna Measurements Note that the R&S ZVH discards user calibration over the complete frequency range after a preset has been done in CAT mode. However, you can also define that the R&S ZVH keeps user calibration after a preset. Press the SETUP key.
-
Page 58: Calibration Methods
R&S ZVH Cable and Antenna Test Mode Performing Cable and Antenna Measurements 2.1.6.2 Calibration Methods The following calibration types are available in antenna and cable test mode. Full 2-Port Both test ports are calibrated for a complete set of measurements. The calibration routine therefore requires the connection of the standards load, open and short to both test ports, and a through connection of the test ports. - Page 59 R&S ZVH Cable and Antenna Test Mode Performing Cable and Antenna Measurements M Press the CAL key. M Press the "Full 2-Port" softkey. The R&S ZVH asks you to connect an "Open" to port 1. M Firmly connect the "Open" of the calibration standard to port 1. M You can abort the calibration any time by pressing the "Cancel"...
-
Page 60: Configuring Cable And Antenna Tests
R&S ZVH Cable and Antenna Test Mode Configuring Cable and Antenna Tests 2.2 Configuring Cable and Antenna Tests For valid measurement results, you need to specify the characteristics of the cable under test like model or frequency range. 2.2.1 Selecting the Cable Model To determine the speed of propagation, and therefore the precise distance to any faults, you have to specify the cable model that you want to test. -
Page 61: Working With A Dtf List
R&S ZVH Cable and Antenna Test Mode Configuring Cable and Antenna Tests If you do not have access to a PC, but still need a cable model that is not stored on the R&S ZVH, you can also define the characteristics of a cable temporarily on the R&S ZVH itself. -
Page 62: Configuring The Horizontal Axis
R&S ZVH Cable and Antenna Test Mode Configuring Cable and Antenna Tests Distance Shows the distance from the measurement plane to the peak. Return Loss Shows the magnitude of the peak. To limit the information in the list, you can define a threshold for the DTF list, so that only peaks above a certain level are included in the list. -
Page 63: Setting The Start And Stop Distance For Dtf Measurements
R&S ZVH Cable and Antenna Test Mode Configuring Cable and Antenna Tests M Enter the span you need manually. The R&S ZVH sets the new span. Note that the maximum span you can set depends on the maximum cable distance you have defined and is never greater than the span calculated by the "Auto Span"... -
Page 64: Setting The Frequency Range For Cat Measurements (Except Dtf)
The minimum span for both measurements is 10 Hz, the maximum span depends on the R&S ZVH and is either 3.6 GHz (R&S ZVH4) or 8 GHz (R&S ZVH8). M Press the FREQ/DIST key. -
Page 65: Configuring The Vertical Axis
R&S ZVH Cable and Antenna Test Mode Configuring Cable and Antenna Tests 2.2.3 Configuring the Vertical Axis The amplitude menu contains all settings related to the level display. 2.2.3.1 Adjusting the Scale of the Diagram The R&S ZVH provides several options to improve the vertical scaling of the measurement diagram. -
Page 66: Setting The Attenuation
R&S ZVH Cable and Antenna Test Mode Configuring Cable and Antenna Tests Setting the reference position The reference position defines the position of the reference line in the diagram. The reference position is a linear value between 0 and 10. Each value represents one horizontal grid line of the diagram. -
Page 67: Selecting The Sweep Mode
R&S ZVH Cable and Antenna Test Mode Configuring Cable and Antenna Tests M Press the SWEEP/BW key. In its default state, the R&S ZVH selects the bandwidth automatically ("Auto Meas BW" softkey). In that state, the bandwidth is coupled to the span. The default setting is a compromise between measurement speed and good performance. -
Page 68: Holding Measurements
R&S ZVH Cable and Antenna Test Mode Configuring Cable and Antenna Tests The number of points also defines the resolution and, therefore, the accuracy of the measurement and affects the measurement time. In the default state, the R&S ZVH evaluates 201 measurement points. This number allows for fast measurement times and sufficient accuracy. -
Page 69: Analyzing Measurement Results
R&S ZVH Cable and Antenna Test Mode Analyzing Measurement Results When external trigger are selected, you can delay the start of the measurement with respect to the trigger event by entering a delay time. In this way, time differences between the trigger event and the measurement can be allowed for. M Press the "Trigger"... -
Page 70: Working With Memory Traces
R&S ZVH Cable and Antenna Test Mode Analyzing Measurement Results M Press the TRACE key. M Press the "Trace Mode" softkey. M Select the "Suppression On" menu item to activate suppression of interference. The R&S ZVH looks for signals that interfere with the measurement and suppresses them in the result display. -
Page 71: Using Markers
R&S ZVH Cable and Antenna Test Mode Analyzing Measurement Results 2.3.2 Using Markers The R&S ZVH has six markers, five of which can be used as either markers or delta markers. The markers cannot leave the trace and indicate the horizontal and vertical coordinates of the point they are positioned on. -
Page 72: Positioning Markers
R&S ZVH Cable and Antenna Test Mode Analyzing Measurement Results 2.3.2.1 Positioning Markers M Press the MARKER key. The marker menu opens. If, as yet, no marker has been activated, the R&S ZVH automatically activates the main marker and positions it on the maximum level that has been measured. In addition, the marker frequency input field opens. -
Page 73: Selecting The Marker Type
R&S ZVH Cable and Antenna Test Mode Analyzing Measurement Results M Confirm the delta marker position with the ENTER key. The delta marker input field closes. M To add more markers, press the "New Marker" softkey several times until you have the number of markers you want in the display. -
Page 74: Removing Markers
R&S ZVH Cable and Antenna Test Mode Analyzing Measurement Results 2.3.2.5 Removing Markers Remove markers any time you want. Removing selected markers M Select the marker you want to delete with the "Select Marker" softkey. The corresponding marker symbol turns red and the marker input field opens. M Press the MARKER key. -
Page 75: Using Marker Search Limits
R&S ZVH Cable and Antenna Test Mode Analyzing Measurement Results 2.3.2.6 Using Marker Search Limits The R&S ZVH allows you to use only a limited section of the trace for the "Set to Peak", "Set to Next Peak" and "Minimum" functions. M Press the MKR key. -
Page 76: Working With The Measurement Wizard
R&S ZVH Working with the Measurement Wizard Analyzing Measurement Results 3 Working with the Measurement Wizard When testing antennas and cables it is often necessary to perform a sequence of standardized and recurring measurements, often in an environment that is not easily accessible. - Page 77 R&S ZVH Working with the Measurement Wizard Analyzing Measurement Results Name of the measurement set Description of the measurement task Font type for on-screen instructions (latin and some asian fonts are supported) Cable model selection Approximate cable length Calibration method List of datasets that are available via the PC List of datasets that are currently part of the measurement set File management options...
-
Page 78: Uploading Measurement Sets
R&S ZVH Working with the Measurement Wizard Analyzing Measurement Results In this dialog box, you can see the name of the selected dataset define a name for the corresponding measurement include instructions about performing the measurement define several hardware settings as described in the Quick Start Guide. You can add instructions for every measurement that you include in the set to avoid handling measurements incorrectly. - Page 79 R&S ZVH Working with the Measurement Wizard Analyzing Measurement Results The dialog box contains the following information: Measurement Definition Name of the wizard definition file currently in use. Pressing the ENTER key on this field has the same effect as the "Load Meas Set" softkey. Measurement Description Short description of the measurement task.
-
Page 80: Performing A Sequence Of Measurements
R&S ZVH Working with the Measurement Wizard Analyzing Measurement Results Measurements List of all individual measurements (datasets) that need to be performed for successful completion of the measurement task. The list also shows the measurements that still need to be performed. Some parameters of the measurement setup you can still change directly on the R&S ZVH. - Page 81 R&S ZVH Working with the Measurement Wizard Analyzing Measurement Results After each measurement step, you have several options: Continue with the next measurement ("Continue" softkey). Finishes the current measurement and begins with the next measurement by showing the necessary preparations. Repeat the current measurement ("Repeat Meas"...
-
Page 82: Evaluating Results
R&S ZVH Working with the Measurement Wizard Analyzing Measurement Results All result files that belong to a measurement set are stored in the same directory. The directory is named after the measurement name and site. The syntax is 'sitename_measurement_#'. The R&S ZVH adds numbers in ascending order to files as well as directories if you perform a measurement or measurement set more than once. - Page 83 R&S ZVH Working with the Measurement Wizard Analyzing Measurement Results With the report editor, you can create measurement reports for the full measurement set or a selection of dataset only. You can also perform simple tasks like activating or deactivating markers that have been set during the measurement. M Add the results you want to include in the report by setting a checkmark or removing the checkmark in the report pane.
-
Page 84: Spectrum Analyzer Mode (R&S Zvh-K1)
R&S ZVH Spectrum Analyzer Mode (R&S ZVH-K1) Performing Spectrum Measurements 4 Spectrum Analyzer Mode (R&S ZVH-K1) If you equip the R&S ZVH with firmware option R&S ZVH-K1, you are able to perform spectrum measurements. This measurement mode provides the functionality to perform e.g. -
Page 85: Selecting The Standard
R&S ZVH Spectrum Analyzer Mode (R&S ZVH-K1) Performing Spectrum Measurements Screen layout for channel power measurements Standard Channel bandwidth Channel power numerical Channel bandwidth graphical (blue lines) Channel power measurement softkey menu 4.1.1.1 Selecting the Standard If you need to perform measurements that are conform to a telecommunications standard, you can activate one of the predefined standards that are already stored in the R&S ZVH memory. -
Page 86: Setting The Reference Level
R&S ZVH Spectrum Analyzer Mode (R&S ZVH-K1) Performing Spectrum Measurements 4.1.1.2 Setting the Reference Level The reference level is the power level that the R&S ZVH expects at the RF input. When selecting the reference level, make sure that you do not overload the R&S ZVH by applying a signal whose power exeeds the maximum reference level. -
Page 87: Measuring The Maximum Channel Power
R&S ZVH Spectrum Analyzer Mode (R&S ZVH-K1) Performing Spectrum Measurements M Press the FORMAT/SPAN key. In the default configuration, "Auto Span" is active. The R&S ZVH automatically sets the optimal span for the channel power measurement. M Press the "Manual Span" softkey. The R&S ZVH opens an input field to define the span manually. -
Page 88: Measuring The Occupied Bandwidth
R&S ZVH Spectrum Analyzer Mode (R&S ZVH-K1) Performing Spectrum Measurements 4.1.2 Measuring the Occupied Bandwidth The proper operation of a transmission network requires that all transmitters adhere to the bandwidths assigned to them. The occupied bandwidth is defined as the bandwidth that contains a specified percentage of the entire power of the transmitter. -
Page 89: Selecting A Standard
R&S ZVH Spectrum Analyzer Mode (R&S ZVH-K1) Performing Spectrum Measurements 4.1.2.1 Selecting a Standard If you need to perform measurements that are conform to a telecommunications standard, you can activate one of the predefined standards that are already stored in the R&S ZVH memory. -
Page 90: Setting The Channel Bandwidth
R&S ZVH Spectrum Analyzer Mode (R&S ZVH-K1) Performing Spectrum Measurements To prevent an overload, perform the measurement with the largest resolution bandwidth possible using the peak detector. If you set these parameters, it is not possible for the trace to exceed the reference level.. To simplify operation and to prevent incorrect measurements, the R&S ZVH has an automatic routine for setting the reference level. -
Page 91: Changing The Span
R&S ZVH Spectrum Analyzer Mode (R&S ZVH-K1) Performing Spectrum Measurements 4.1.2.5 Changing the Span Usually, the span the R&S ZVH sets yields optimal results. But sometimes you also need to see the spectrum outside the current span to detect other signal components that you need to include in the measurement. -
Page 92: Selecting A Standard
R&S ZVH Spectrum Analyzer Mode (R&S ZVH-K1) Performing Spectrum Measurements Screen layout for TDMA power measurements Standard TDMA power Measurement limits Trigger delay Trigger level Measurement time TDMA power measurement softkey menu 4.1.3.1 Selecting a Standard If you need to perform measurements that are conform to a telecommunications standard, you can activate one of the predefined standards that are already stored in the R&S ZVH memory. -
Page 93: Setting The Burst Length
R&S ZVH Spectrum Analyzer Mode (R&S ZVH-K1) Performing Spectrum Measurements 4.1.3.2 Setting the Burst Length The burst length is the measurement time that the R&S ZVH performs measurements with. The burst length can be equal or less than the sweep time. M Press the MEAS key. -
Page 94: Measuring The Adjacent Channel Leakage Ratio (Aclr)
R&S ZVH Spectrum Analyzer Mode (R&S ZVH-K1) Performing Spectrum Measurements If the DUT features some sort of trigger equipment, you can also use an external trigger to trigger measurements. M Connect the DUT trigger output to the R&S ZVH trigger input. M Press the SWEEP/BW key. - Page 95 R&S ZVH Spectrum Analyzer Mode (R&S ZVH-K1) Performing Spectrum Measurements Screen Layout for ACLR measurements Standard Marker information Limit check information Channel information TX channel (red line) Adjacent channel (green line) Alternate channels (green lines) Marker (blue line) ACLR softkey menu The predefined standards are the same as for channel power measurements (3GPP WCDMA, cdmaOne and CDMA2000 1x systems).
- Page 96 R&S ZVH Spectrum Analyzer Mode (R&S ZVH-K1) Performing Spectrum Measurements Selecting the frequency span If the frequency span is too large in comparison to the channel bandwidth (or the adjacent-channel bandwidths) being examined, only a few points on the trace are available per channel.
-
Page 97: Selecting A Standard
R&S ZVH Spectrum Analyzer Mode (R&S ZVH-K1) Performing Spectrum Measurements The R&S ZVH then selects the smallest possible VBW with regard to the available step size. Selecting the detector: It is best to use the RMS detector. This detector correctly indicates the power irrespective of the characteristics of the signal to be measured. -
Page 98: Configuring The Measurement
R&S ZVH Spectrum Analyzer Mode (R&S ZVH-K1) Performing Spectrum Measurements 4.1.4.2 Configuring the Measurement In addition to creating and editing standards with the R&S ZVHView software, the R&S ZVH also provides functionality to set up a measurement configuration. Setting the number of transmission channels M Press the MEAS key. - Page 99 R&S ZVH Spectrum Analyzer Mode (R&S ZVH-K1) Performing Spectrum Measurements Setting the channel spacing In case of the R&S ZVH, the channel spacing is defined as the distance between the center frequency of the transmission channel and the center frequency to the next transmission channel or the distance between the center frequency of the transmission channel and the center frequency of the adjacent channel.
-
Page 100: Normalization Of Measurement Results
R&S ZVH Spectrum Analyzer Mode (R&S ZVH-K1) Performing Spectrum Measurements Even number of TX channels The two TX channels in the middle are used to calculate the frequency between those two channels. This frequency is aligned to the center frequency. Adjacent or alternate channel spacing is also available for single-carrier measurements. -
Page 101: Selecting The Reference Channel
R&S ZVH Spectrum Analyzer Mode (R&S ZVH-K1) Performing Spectrum Measurements 4.1.4.5 Selecting the Reference Channel When determining relative power values for the adjacent channels, you can set a specific transmission channel as the reference channel. M Press the MEAS key. M Press the "Channel Settings"... - Page 102 R&S ZVH Spectrum Analyzer Mode (R&S ZVH-K1) Performing Spectrum Measurements M Select the channel you want to define a limit for. M Activate the input by pressing the "Select" softkey. The channel turns green and the check box in the first column is marked.
-
Page 103: Measuring The Spectrum Emission Mask
R&S ZVH Spectrum Analyzer Mode (R&S ZVH-K1) Performing Spectrum Measurements 4.1.5 Measuring the Spectrum Emission Mask The Spectrum Emission Mask (SEM) measurement is a method to detect spurious emissions or intermodulation products of a signal. When performing a SEM measurement, the R&S ZVH checks the signal against a spectral mask to see whether the signal complies with a specific standard or not. -
Page 104: Selecting A Standard
R&S ZVH Spectrum Analyzer Mode (R&S ZVH-K1) Performing Spectrum Measurements 4.1.5.1 Selecting a Standard If you need to perform measurements that are conform to a telecommunications standard, you can activate one of the predefined standards that are already stored in the R&S ZVH memory. -
Page 105: Measuring The Harmonic Distortion
R&S ZVH Spectrum Analyzer Mode (R&S ZVH-K1) Performing Spectrum Measurements The list contains the following information: Tx Power Power level of the transmission channel. Tx Bandwidth Bandwidth of the transmission channel. PASS / FAIL information If the signal is within the limits of the spectral mask, the R&S ZVH shows if not it shows Range [Hz] Frequency range. -
Page 106: Defining The Number Of Harmonics
R&S ZVH Spectrum Analyzer Mode (R&S ZVH-K1) Performing Spectrum Measurements The search for harmonics starts as soon as you enter the Harmonic Distortion measurement. Upon entering the measurement, the R&S ZVH automatically adjusts the settings in order to display the selected number of harmonics (default = 2) on the screen. -
Page 107: Optimizing The Display Of Harmonics
R&S ZVH Spectrum Analyzer Mode (R&S ZVH-K1) Performing Spectrum Measurements 4.1.6.2 Optimizing the Display of Harmonics The R&S ZVH places the markers on the other harmonics even if they are outside of the display range. M Press the MEAS key. M Press the "Adjust Settings"... -
Page 108: Setting A Threshold
R&S ZVH Spectrum Analyzer Mode (R&S ZVH-K1) Performing Spectrum Measurements If the R&S ZVH is unable to find any AM modulated a carriers, it shows the message Screen layout for the AM modulation depth measurement Marker list Modulation depth Trace Threshold line Markers (blue lines) AM modulation depth softkey menu... -
Page 109: Activating The Marker List
R&S ZVH Spectrum Analyzer Mode (R&S ZVH-K1) Performing Spectrum Measurements 4.1.7.3 Activating the Marker List To see the exact frequency of the carrier and its sidebands, you can activate the marker list that shows the value for each marker. M Press the MKR key. M Press the "View List"... -
Page 110: Controlling The Spectrogram Update
R&S ZVH Spectrum Analyzer Mode (R&S ZVH-K1) Performing Spectrum Measurements Screen layout for the spectrogram Result display Marker and time line information Spectrum result display (optional) Marker/ delta marker (vertical lines) Spectrogram Time lines T1 and T2 (horizontal lines) Scroll direction Spectrogram softkey menu By default, the spectrogram result display consists of two windows. -
Page 111: Browsing Through The Signal History
R&S ZVH Spectrum Analyzer Mode (R&S ZVH-K1) Performing Spectrum Measurements The spectrogram result display is filled with results until you change a measurement setting. As soon as a setting is changed, the spectrogram clears and starts to fill again. You can also clear the spectrogram manually. M Press the MEAS key. -
Page 112: Configuring The Display
R&S ZVH Spectrum Analyzer Mode (R&S ZVH-K1) Performing Spectrum Measurements 4.1.8.3 Configuring the Display As colors are an important part of the spectrogram, the R&S ZVH offers various ways to customize the display for best viewing results. The first and most obvious way to configure the display is to select a different color scheme. - Page 113 R&S ZVH Spectrum Analyzer Mode (R&S ZVH-K1) Performing Spectrum Measurements To get a better result, change the spectrogram reference level to a level near the maximum power level that has been measured first. M Press the "Spectrogram Settings" softkey. M Select the "Spectrogram Reference Level" menu item. The R&S ZVH opens an input field to enter the spectrogram reference level.
-
Page 114: Recording A Spectrogram
R&S ZVH Spectrum Analyzer Mode (R&S ZVH-K1) Performing Spectrum Measurements This means that signal parts with a low amplitude are in a shade of green while signal parts with a high amplitude are yellow. The best way to display a spectrogram is therefore to reduce the level range until the lowest signal part is mapped to the lower... -
Page 115: Playback Of A Spectrogram
R&S ZVH Spectrum Analyzer Mode (R&S ZVH-K1) Performing Spectrum Measurements M Enter the name of the spectrogram with the alphanumeric keys. By default, the R&S ZVH saves the spectrogram as 'Spectrogram###' with ascending numbers. M Press the "Save" softkey to store the spectrogram. - Page 116 R&S ZVH Spectrum Analyzer Mode (R&S ZVH-K1) Performing Spectrum Measurements The first time line (T1) corresponds to an absolute time value, the second (T2) is a time relative to the first time line. Both time lines are positioned on the most recent spectrogram line at the top of the result display.
-
Page 117: Using Isotropic Antennas
R&S ZVH Spectrum Analyzer Mode (R&S ZVH-K1) Performing Spectrum Measurements You can use the spectrogram playback for a detailed analysis of the signal levels over time and compare signal details in the spectrum result display, e.g. with the help of markers. - Page 118 R&S ZVH Spectrum Analyzer Mode (R&S ZVH-K1) Performing Spectrum Measurements The transducer factors for each antenna element and the cable loss of the antenna cable are compensated in the measurement. If you use an extension cable like R&S TS-EMFZ2 (order no. 1166.5708.02), you can take the additional cable loss into account by using transducer factors.
-
Page 119: Configuring Spectrum Measurements
R&S ZVH Spectrum Analyzer Mode (R&S ZVH-K1) Configuring Spectrum Measurements M Select the transducer factor you need with the extension *.isotrd. M Confirm the selection with the "Select" softkey. You should also select a secondary transducer to compensate the extension cable of the antenna. -
Page 120: Defining A Frequency Step Size
R&S ZVH Spectrum Analyzer Mode (R&S ZVH-K1) Configuring Spectrum Measurements While adjusting the center frequency, you may obtain a value that is outside the R&S ZVH maximum span. If this happens, the R&S ZVH automatically reduces the span. 4.2.1.2 Defining a Frequency Step Size If you set the center frequency with the rotary knob or the cursor keys, the distance of each step that you take depends on the span. -
Page 121: Defining A Start And Stop Frequency
A rule of thumb is that it should be at least twice the bandwidth occupied by the signal. The span for frequency domain measurements for the R&S ZVH4 is between 100 Hz and 3.6 GHz and for the R&S ZVH8 between 100 Hz and 8 GHz. - Page 122 R&S ZVH Spectrum Analyzer Mode (R&S ZVH-K1) Configuring Spectrum Measurements M Press the FORMAT/SPAN key. When you press the FORMAT/SPAN key, the R&S ZVH automatically opens an input field to define the span. If the input field is inactive, you can open it with the "Manual Span"...
-
Page 123: Configuring The Vertical Axis
R&S ZVH Spectrum Analyzer Mode (R&S ZVH-K1) Configuring Spectrum Measurements 4.2.2 Configuring the Vertical Axis All relevant settings to configure the vertical axis are available in the amplitude menu. You can access it via the SCALE/AMPT key. 4.2.2.1 Setting the Reference Level The reference level is represented graphically by the grid line at the top of the diagram. -
Page 124: Selecting The Display Unit
R&S ZVH Spectrum Analyzer Mode (R&S ZVH-K1) Configuring Spectrum Measurements However, increasing resolution does not increase the accuracy of, for example, the marker level readout, but only makes it easier to read values off the trace. You can also select a linear scale for the vertical axis. In that case, the power levels are expressed as a percentage of the reference level. -
Page 125: Setting The Rf Attenuation
R&S ZVH Spectrum Analyzer Mode (R&S ZVH-K1) Configuring Spectrum Measurements 4.2.2.5 Setting the RF Attenuation RF attenuation adjusts the input range inside the analyzer. It is coupled directly to the reference level. If you have set a high reference level, RF attenuation is turned on in 10 dB steps according to the table below so that the input mixer always remains in the linear range. -
Page 126: Using The Preamplifier
R&S ZVH Spectrum Analyzer Mode (R&S ZVH-K1) Configuring Spectrum Measurements M Press the SCALE/AMPT key. M Press the "RF Att / Amp / Imp" softkey. M Select either the "Auto Low Distortion" or the "Auto Low Noise" menu item. The R&S ZVH sets the attenuation according to the table above. M Select the "Manual: 0 dB"... -
Page 127: Setting Bandwidths
R&S ZVH Spectrum Analyzer Mode (R&S ZVH-K1) Configuring Spectrum Measurements 4.2.3 Setting Bandwidths The bandwidth menu contains all settings to set up filter bandwidths available in the R&S ZVH. You can access it with the SWEEP/BW key. 4.2.3.1 Setting the Resolution Bandwidth The resolution bandwidth in a spectrum analyzer determines the frequency resolution for frequency domain measurements and therefore determines how well it can separate adjacent frequencies. -
Page 128: Setting The Video Bandwidth
R&S ZVH Spectrum Analyzer Mode (R&S ZVH-K1) Configuring Spectrum Measurements M Press the "Manual RBW" softkey. The R&S ZVH opens an input field to define the resolution bandwidth. M Enter the resolution bandwidth you need. The R&S ZVH uses the resolution bandwidth you have entered for the measurement. - Page 129 R&S ZVH Spectrum Analyzer Mode (R&S ZVH-K1) Configuring Spectrum Measurements If the bandwidth of the video filter is less than the frequency of the AC component, it is suppressed depending on its maximum frequency. If the AM component should be displayed truly, the cutoff frequency of the filter has to be greater than the modulation frequency.
-
Page 130: Configuring And Triggering The Sweep
R&S ZVH Spectrum Analyzer Mode (R&S ZVH-K1) Configuring Spectrum Measurements 4.2.4 Configuring and Triggering the Sweep You can find all necessary settings to configure the sweep itself in the sweep menu. To access it, press the SWEEP/BW key. 4.2.4.1 Setting the Sweep Time The sweep time is the time it takes the R&S ZVH to get the results that are contained in one trace. -
Page 131: Working With Trigger Functionality
R&S ZVH Spectrum Analyzer Mode (R&S ZVH-K1) Configuring Spectrum Measurements In some cases it may be sufficient to get the results over a single sweep only, e.g. if a particular trigger condition is met. In single sweep mode, the R&S ZVH performs the sweep a certain number of times (depending on the number of averages you have set) over the defined range of the horizontal axis (frequency or time) and then stops measuring. - Page 132 R&S ZVH Spectrum Analyzer Mode (R&S ZVH-K1) Configuring Spectrum Measurements Pulsed signals can be measured by this method, if the gate delay and gate length are selected in a way that the measurement is only performed while the pulse is active.
- Page 133 R&S ZVH Spectrum Analyzer Mode (R&S ZVH-K1) Configuring Spectrum Measurements M Select the "Trace Video" menu item. The R&S ZVH opens an input field to define the trigger level. M Enter the trigger level. The R&S ZVH shows the trigger level by adding a horizontal line to the diagram area.
-
Page 134: Working With Traces
R&S ZVH Spectrum Analyzer Mode (R&S ZVH-K1) Configuring Spectrum Measurements M Enter the length of the gate. The R&S ZVH now measures over the period of the gate length. After the gate has closed, the R&S ZVH waits with the measurement until the next gate signal happens. -
Page 135: Selecting The Detector
R&S ZVH Spectrum Analyzer Mode (R&S ZVH-K1) Configuring Spectrum Measurements Min Hold The trace shows the minimum power levels that have been measured at each pixel. To overwrite a min hold trace, change a parameter in a way that the results can not be compared any more, e.g. - Page 136 R&S ZVH Spectrum Analyzer Mode (R&S ZVH-K1) Configuring Spectrum Measurements Max Peak If the max peak detector is active, the R&S ZVH displays only the maximum power levels that were measured in the frequency range covered by a pixel. The max peak detector is useful for measurements on pulse or FM signals, for example.
-
Page 137: Working With A Second Trace
R&S ZVH Spectrum Analyzer Mode (R&S ZVH-K1) Configuring Spectrum Measurements The R&S ZVH provides automatic selection of the detector. In that case, the R&S ZVH selects the detector that is most suitable for the current trace mode. Trace mode Detector Clear/Write Auto Peak Average... -
Page 138: Working With Memory Traces
R&S ZVH Spectrum Analyzer Mode (R&S ZVH-K1) Configuring Spectrum Measurements M Press the "Select Trace" softkey. Trace 1 becomes the active trace. You can put both traces into the internal memory of the R&S ZVH and restore them later. Note that the memory trace 1 and memory trace 2 have the same color (i.e. white). -
Page 139: Using Trace Mathematics
R&S ZVH Spectrum Analyzer Mode (R&S ZVH-K1) Configuring Spectrum Measurements 4.2.5.5 Using Trace Mathematics Trace mathematics substract the memory trace from the live trace and vice versa and then display the results. M Press the TRACE key. M Press the "Trace Memory" softkey. - Page 140 R&S ZVH Spectrum Analyzer Mode (R&S ZVH-K1) Configuring Spectrum Measurements Noise power density can provide useful information when you are measuring noise or digitally modulated signals. However, you will get valid results only if the spectrum in the vicinity of the marker has a flat frequency response. When measuring the noise power density on discrete signals, results are not valid.
- Page 141 R&S ZVH Spectrum Analyzer Mode (R&S ZVH-K1) Configuring Spectrum Measurements M Press the MARKER key. M Press the "Marker Function" softkey. M Select the "Frequency Count" menu item The R&S ZVH displays the counted marker frequency with a resolution of 1 Hz. If the frequency counter is on, the marker symbol changes from M1 to C.
- Page 142 R&S ZVH Spectrum Analyzer Mode (R&S ZVH-K1) Configuring Spectrum Measurements Demodulating Signals The R&S ZVH features an AM and FM demodulator to demodulate and monitor audio signals. It demodulates the signal at the marker frequency. You can listen to the demodulated signal with the internal speaker or headphones that you can connect to the 3.5 mm headphone jack on the top of the R&S ZVH.
-
Page 143: Using Display Lines
R&S ZVH Spectrum Analyzer Mode (R&S ZVH-K1) Configuring Spectrum Measurements 4.2.7 Using Display Lines Like markers, display lines help you to determine the level of the signal. A display line is a straight line that runs horizontally and corresponds to a certain level value. -
Page 144: Selecting A Limit Line
R&S ZVH Spectrum Analyzer Mode (R&S ZVH-K1) Configuring Spectrum Measurements After turning on a limit line, the R&S ZVH checks if the signal violates the shape of the limit line. If one or more signal levels violate the limits defined, the R&S ZVH shows the points of violation. -
Page 145: Performing Limit Checks
R&S ZVH Spectrum Analyzer Mode (R&S ZVH-K1) Configuring Spectrum Measurements Threshold line and display line Like the display line, a threshold line is a straight horizontal line. The difference is that the R&S ZVH performs a limit check for threshold lines, but not for display lines. A failed limit check may be an issue if you want to create a measurement report, because measurements with failed limits are not included in this report. -
Page 146: Working With Channel Tables
R&S ZVH Spectrum Analyzer Mode (R&S ZVH-K1) Working with Channel Tables 4.3 Working with Channel Tables Almost all transmission systems divide their assigned frequency ranges into channels. Each channel corresponds to a specific frequency. To keep the handling of such systems simple, you can use channel tables instead of entering frequencies manually. -
Page 147: Using Transducer Factors
R&S ZVH Spectrum Analyzer Mode (R&S ZVH-K1) Using Transducer Factors 4.4 Using Transducer Factors The frequency-dependent transducer factor of transducers and antennas can be directly considered in the measurement result. A transducer factor consists of a numeric value and a unit. The R&S ZVH corrects the level values of the trace by the values of the transducer. -
Page 148: Unit For Measurements With Transducers
R&S ZVH Spectrum Analyzer Mode (R&S ZVH-K1) Using Transducer Factors M Select the "Select Primary Transducer" menu item. The R&S ZVH opens a dialog box to select the transducer factor. M Select the transducer factor you need. M Confirm the selection with the "Select" softkey. The R&S ZVH shows the name of the active transducer on the display. -
Page 149: Frequency Range Of Transducer
R&S ZVH Spectrum Analyzer Mode (R&S ZVH-K1) Using Transducer Factors 4.4.3 Frequency Range of Transducer If the set frequency range is wider than the span in which a transducer is defined, the R&S ZVH assumes the transducer values outside the defined range to be zero. 4.4.4 Data Sets Containing Transducer Factors The R&S ZVH stores data sets together with any transducer factors that may have been active for the measurement in question. -
Page 150: Working With Power Sensors
R&S ZVH Working with Power Sensors Using a Power Sensor 5 Working with Power Sensors For highly accurate power measurements, you can connect a power sensor to the R&S ZVH and perform measurements. 5.1 Using a Power Sensor A power sensor measures the power in the frequency range defined in the data sheet of the power sensor. -
Page 151: Connecting A Power Sensor
R&S ZVH Working with Power Sensors Using a Power Sensor Screen layout of the power meter mode Connected power sensor model Reference for relative power measurements Power offset Measurement time Readout of the measured power Analog readout of the measured power Measurement frequency Power sensor softkey menu 5.1.1 Connecting a Power Sensor... -
Page 152: Performing And Configuring Measurements
R&S ZVH Working with Power Sensors Using a Power Sensor If the R&S ZVH recognizes a power sensor, it sets up a connection via the interface and after a few seconds shows the measured power. It displays the type of the power sensor in the display header. - Page 153 R&S ZVH Working with Power Sensors Using a Power Sensor M Enter the frequency of the signal. The R&S ZVH transfers the new frequency to the power sensor which then corrects the measured power readings. Zeroing the power sensor Offset voltages and currents have most effect on the power readout when measuring low powers.
- Page 154 R&S ZVH Working with Power Sensors Using a Power Sensor M Press the " Ref" softkey. The R&S ZVH sets the current result as the reference level. It then displays the measured level relative to the reference level in dB. The unit is automatically set to dB Rel...
-
Page 155: Using A Directional Power Sensor
R&S ZVH Working with Power Sensors Using a Directional Power Sensor 5.2 Using a Directional Power Sensor For power measurements in both directions (forward and reverse), you can connect directional power sensors to the R&S ZVH. The R&S ZVH supports the following directional power sensors: R&S FSH-Z14 R&S FSH-Z44... -
Page 156: Connecting A Directional Power Sensor
R&S ZVH Working with Power Sensors Using a Directional Power Sensor 5.2.1 Connecting a Directional Power Sensor The R&S ZVH controls and powers the directional power sensors via a special interface on the top of the instrument. Connect the power sensor cable to the power sensor interface and screw it into position. - Page 157 R&S ZVH Working with Power Sensors Using a Directional Power Sensor Risk of skin burns and / or damage to the R&S ZVH Measuring high powers may lead to skin burns and / or damage to the R&S ZVH. You can avoid it by: Never exceeding the permissible continuous power.
- Page 158 R&S ZVH Working with Power Sensors Using a Directional Power Sensor Selecting the unit for the power readout When using a directional power sensor, the R&S ZVH displays the forward power as a logarithmic level value in dBm (relative value) or as a linear value in W or mW (absolute value).
- Page 159 R&S ZVH Working with Power Sensors Using a Directional Power Sensor If high powers are applied that exceed the maximum input level of the R&S FSH-Z14 or R&S FSH-Z44, a directional coupler or an attenuator has to be connected ahead of the power sensor.
-
Page 160: Network Analyzer Mode (R&S Zvh-K42)
R&S ZVH Network Analyzer Mode (R&S ZVH-K42) Using a Directional Power Sensor 6 Network Analyzer Mode (R&S ZVH-K42) The network analyzer mode provides the functionality to characterize networks with one or two ports. All R&S ZVH models already have a tracking generator and VSWR bridge that are necessary to use the network analyzer. -
Page 161: Calibrating Measurements
R&S ZVH Network Analyzer Mode (R&S ZVH-K42) Calibrating Measurements Screen layout of the network analyzer Result display Measurement mode 0 dB reference Status line - S-matrix - Calibration status - Measurement format Trace window Network analyzer softkey menu 6.1 Calibrating Measurements In its default state, the R&S ZVH uses factory calibration. -
Page 162: Calibration States
R&S ZVH Network Analyzer Mode (R&S ZVH-K42) Calibrating Measurements During calibration, the R&S ZVH removes systematic errors from the measurement. This process is based on correction data it gets while performing the calibration. The correction data for transmission measurements is based on the results of comparing the transmission characteristics of the test setup to the frequency response of the tracking generator. - Page 163 R&S ZVH Network Analyzer Mode (R&S ZVH-K42) Calibrating Measurements You can either use one of the calibration kits specifically designed for use with the R&S ZVH, e.g. the R&S FSH-Z28 and -Z29 calibration kits. Those provide an "Open", "Short" and "Load" calibration standard in one piece. The characteristics of these calibration kits are already part of the R&S ZVH firmware.
-
Page 164: Performing Vector Measurements
R&S ZVH Network Analyzer Mode (R&S ZVH-K42) Performing Vector Measurements 6.2 Performing Vector Measurements If you equip the R&S ZVH with option R&S ZVH-K42, vector measurements become available. Unlike scalar measurements, vector measurements also measure the phase characteristics of a DUT. Vector measurements also have a higher dynamic range and accuracy because of the advanced calibration methods that vector measurements provide. - Page 165 R&S ZVH Network Analyzer Mode (R&S ZVH-K42) Performing Vector Measurements Select the type of transmission measurement M Press the MEAS key. M Press the "Transmission S21" or "Transmission S12" softkey for transmission measurements in forward or reverse direction. Define the frequency parameters Before calibrating the measurement, you should define the frequency parameters to avoid interpolation of the results.
-
Page 166: Measuring The Reflection
R&S ZVH Network Analyzer Mode (R&S ZVH-K42) Performing Vector Measurements Depending on the calibration method, you can also select other result displays (e.g. reflection measurements) without having to recalibrate the R&S ZVH. 6.2.2 Measuring the Reflection The example included here is based on a reflection measurement of the two-port filter that was also used for the transmission measurement. -
Page 167: Evaluating The Results
R&S ZVH Network Analyzer Mode (R&S ZVH-K42) Evaluating the Results M Reconnect the DUT. The R&S ZVH shows the results of the vector reflection measurement on the filter. You can change the measurement configuration (e.g. the sweep time or detector) or format (e.g. view phase characteristics) without affecting the accuracy of the measurement. - Page 168 R&S ZVH Network Analyzer Mode (R&S ZVH-K42) Evaluating the Results In the default state, the R&S ZVH shows the phase only from -200° to +200°. In that case, the R&S ZVH displays measurement results correctly only if the phase difference between two adjacent test points is less than 180°.
- Page 169 R&S ZVH Network Analyzer Mode (R&S ZVH-K42) Evaluating the Results Group delay Shows the group delay characteristics of the DUT. The group delay is a measure that describes the time period or delay of the signal as it goes through the DUT. Available for vector measurements.
-
Page 170: Working With The Smith Chart
R&S ZVH Network Analyzer Mode (R&S ZVH-K42) Evaluating the Results 6.3.1.1 Working with the Smith Chart If you are displaying measurement results in a Smith chart (available for vector reflection measurements), the R&S ZVH provides several special functionality. M Press the FORMAT/SPAN key. M Press the "Smith Chart"... - Page 171 R&S ZVH Network Analyzer Mode (R&S ZVH-K42) Evaluating the Results M Press the "Move Y" softkey. The R&S ZVH opens an input field. M Enter a value between -50 % and 50 % to shift the window vertically. Entering negative values moves the rectangle up, positive values move it down. M Press the "Zoom Active"...
-
Page 172: Working With The Dual Trace Mode
R&S ZVH Network Analyzer Mode (R&S ZVH-K42) Evaluating the Results M Press the MARKER key. The R&S ZVH activates a marker and opens the marker softkey menu. Like usual traces, you can move the marker around with the rotary knob or the cursor keys, or enter a specific marker position. -
Page 173: Configuring The Vertical Axis
R&S ZVH Network Analyzer Mode (R&S ZVH-K42) Evaluating the Results Screen layout in dual trace mode Result display trace 1 Result display trace 2 Measurement mode Trace window 1 Trace information trace 1 - S-matrix - calibration status - measurement format Trace window 2 Measurement format trace 2 Active trace indicator... - Page 174 R&S ZVH Network Analyzer Mode (R&S ZVH-K42) Evaluating the Results Changing the reference value Changing the reference value works like an attenuation or gain in that it moves the trace to another level. The R&S ZVH adjusts the scale of the vertical axis accordingly. The R&S ZVH indicates the value and position of the current reference value with a triangle at the vertical axis ( ).
- Page 175 R&S ZVH Network Analyzer Mode (R&S ZVH-K42) Evaluating the Results M Enter the new position of the reference value. The R&S ZVH moves the trace accordingly and moves the triangle to the new position. Changing the display range The display range is the value range the vertical axis covers. The default display range depends on the measurement format.
-
Page 176: Using Markers
R&S ZVH Network Analyzer Mode (R&S ZVH-K42) Evaluating the Results 6.3.3 Using Markers The network analyzer mode also features markers. The functionality is similar to that of the spectrum analyzer. For more information see "Markers" on page 20. 6.3.4 Working with Channel Tables The R&S ZVH allows you to use channel tables in network analyzer mode. -
Page 177: Vector Voltmeter (R&S Zvh-K45)
R&S ZVH Network Analyzer Mode (R&S ZVH-K42) Vector Voltmeter (R&S ZVH-K45) 6.4 Vector Voltmeter (R&S ZVH-K45) With firmware option R&S ZVH-K45 (order no. 1304.5658.02) you can use a R&S ZVH with tracking generator and VSWR bridge (models .24 and .28) as a vector voltmeter. A vector voltmeter performs reflection (S11) and transmission measurements (S21). -
Page 178: Performing Measurements
R&S ZVH Network Analyzer Mode (R&S ZVH-K42) Vector Voltmeter (R&S ZVH-K45) The process of calibration including the selection of a calibration kit works like that for scalar or vector measurement. For more information see "Calibrating Measurements" on page 142. 6.4.2 Performing Measurements With the vector voltmeter you can measure the reflection on port 1 and the transmission in reverse direction. -
Page 179: Performing Reflection Measurements
R&S ZVH Network Analyzer Mode (R&S ZVH-K42) Vector Voltmeter (R&S ZVH-K45) 6.4.2.2 Performing Reflection Measurements Calibrate the measurement for reflection measurements. M Press the CAL key. M Press the "Full 1-Port" softkey (for calibration on port 1). M Perform calibration. For more information see "Performing Calibration". -
Page 180: Saving And Loading Instrument Settings And Measurement Results
R&S ZVH Saving and Loading Instrument Settings and Measurement Results Saving Data Sets 7 Saving and Loading Instrument Settings and Measurement Results For documentation purposes or further analysis, the R&S ZVH provides functionality to save, store and load measurement settings and results. These datasets contain an image of the current configuration so that the context of the measurement is clear. - Page 181 R&S ZVH Saving and Loading Instrument Settings and Measurement Results Saving Data Sets The default storage device depends on which devices are connected to the R&S ZVH. If an SD card is connected, datasets are always stored there first. If a memory stick is connected, datasets are stored there only if no SD card is connected The internal memory is used only if neither SD card or memory stick are connected The internal memory provides approximately 20 MB of data, therefore the number of...
-
Page 182: Quick Naming Of Data Sets
R&S ZVH Saving and Loading Instrument Settings and Measurement Results Quick Naming of Data Sets 7.2 Quick Naming of Data Sets The R&S ZVH provides a quick naming feature that speeds up the process of naming a file. 7.2.1 Putting Together a File Name Basically, using the quick naming feature is a way of compiling a file name by putting one or more predefined text modules or terms together in a logical way. -
Page 183: Designing A Table
R&S ZVH Saving and Loading Instrument Settings and Measurement Results Loading Measurement Results 7.2.2 Designing a Table The firmware of the R&S ZVH already has some basic mobile communication terms in the table. However, you can add up to 120 terms to the table. M Press the SAVE/RECALL key. -
Page 184: Previewing A Dataset
R&S ZVH Saving and Loading Instrument Settings and Measurement Results Deleting Datasets 7.3.1 Previewing a Dataset The R&S ZVH provides a preview of datasets. The preview is like a screenshot and lets you take a quick look at that measurement and its settings. The R&S ZVH does not yet activate the measurement settings of that dataset. - Page 185 R&S ZVH Saving and Loading Instrument Settings and Measurement Results Deleting Datasets M Select the "Delete" menu item and confirm with the ENTER key or the "Select Action" softkey. Before deleting the data set, the R&S ZVH shows a warning message that you need to confirm.
- Page 186 R&S ZVH How a Spectrum Analyzer Works Deleting Datasets 8 How a Spectrum Analyzer Works Basically, it is possible to measure and analyze RF signals either in the time domain or the frequency domain. Measurements in the time domain show signal variations over time. You can perform these with an oscilloscope, for example.
- Page 187 R&S ZVH How a Spectrum Analyzer Works Deleting Datasets Figure 8-2: Block diagram showing the basic functionality of a spectrum analyzer The precision attenuator at the R&S ZVH input attenuates the signal to a level that the mixer can handle without overdriving the mixer. The attenuator is directly coupled to the reference level.
- Page 188 R&S ZVH How a Spectrum Analyzer Works Deleting Datasets Figure 8-3: Mixing process The first local oscillator is tuned with a sawtooth which simultaneously acts as the x deflection voltage for the display. In practice, synthesizer technology is used to generate the frequency of the first local oscillator and for a digital display.
- Page 189 R&S ZVH How a Spectrum Analyzer Works Deleting Datasets The video filter comes after the envelope detector. The filter is a lowpass with an adjustable cutoff frequency which limits the bandwidth of the video signal. It is particularly useful when sine signals are to be measured in the vicinity of the spectrum analyzer’s intrinsic noise.
- Page 190 R&S ZVH How a Spectrum Analyzer Works Deleting Datasets The figure above shows 30 measured values which are represented by a single pixel. The peak detector determines and displays the maximum measured value. The Auto Peak detector takes the maximum and minimum and displays them together. The two values are joined by a vertical line segment.
- Page 191 R&S ZVH Index Index ACLR CF step size..............101 absolute results .............. 81 Channel bandwidth adjacent channel............. 79 ACLR................79 channel bandwidth............79 channel power ..............67 channel spacing.............. 80 occupied bandwidth ............71 limit check............... 82 Channel power..............65 measurement configuration..........
- Page 192 R&S ZVH Index Harmonic distortion ............86 Max peak ................. 117 adjust settings..............88 Measurement..............111 harmonics............... 87 ACLR................75 harmonics list..............88 AM modulation depth............88 THD................87 audio demodulation ............123 History ................92 cable loss (CAT) ............. 35 Hold spectrogram ..............
- Page 193 R&S ZVH Index channel bandwidth............71 Sample ................117 power percentage ............71 Scaling..............46, 105, 156 reference level ..............70 horizontal axis............... 100 span ................72 Screen layout..............11 standard ................. 70 ACLR................76 Offset AM modulation depth............89 frequency..............101 CAT mode ..............
- Page 194 R&S ZVH Index power sensor ..............139 Transducer .............. 107, 128 spectrum emission mask ..........85 unit ................129 TDMA power..............73 Transmission (CAT)............35 Start length ................ 44 Transmission channel ............79 Start/stop frequency........... 44, 102 Trigger ............... 49, 112 Step size................
Need help?
Do you have a question about the ZVH4 and is the answer not in the manual?
Questions and answers