Table of Contents
Advertisement
Quick Links
Advertisement
Table of Contents

Related Manuals for VeEX VePal TX130M+


Summary of Contents for VeEX VePal TX130M+
- Page 1 TX130M+_e-manual_D07-00-051P_RevD00...
-
Page 2: Table Of Contents
TX130M+_e-manual_D07-00-051P_RevD00 Table of Contents 1.0 About This Guide 2.0 Introduction to TX130M+ 3.0 Safety Information 4.0 Basic Operations 4.1 Keypad 4.2 Touch-Screen Display 4.3 Battery 4.4 Connectors and Panels 4.4.1 BNC Interface 4.4.2 Ethernet Port 4.4.3 Dual PDH/DSn Port 4.4.4 Utility Ports 4.5 LEDs 4.6 Software Upgrade 5.0 Home Menus... - Page 3 TX130M+_e-manual_D07-00-051P_RevD00 7.1.2 Traffic Settings 7.1.3 Error Injection 7.1.4 Control Settings 7.1.5 Starting/Stopping a Bert Test 7.2 BERT Results 7.2.1 Summary 7.2.2 Errors 7.2.3 Events 7.2.4 Alarms 7.2.5 Traffic 7.2.6 Rates 7.2.7 Delay 7.2.8 Saving BERT Results 8.0 RFC 2544 Conformance Testing 8.1 RFC 2544 Setup 8.1.1 Header Settings 8.1.2 Frame Settings...
- Page 4 TX130M+_e-manual_D07-00-051P_RevD00 9.1 Setup 9.1.1 General Settings 9.1.2 Control 9.1.3 Per Stream Configurations 9.1.4 Traffic Settings (Individual Stream Configurations) 9.1.5 Error Injection Settings (Individual Stream Configuration) 9.1.6 Starting/Stopping a Throughput (Multiple Streams) Test 9.2 Throughput Results 9.2.1 Viewing Test Results (Individual and Multiple Streams) 9.2.2 Global Results 9.2.3 Individual Stream Results 9.2.4 Saving Throughput (Multiple Streams) Results...
- Page 5 TX130M+_e-manual_D07-00-051P_RevD00 12.1 SyncE Setup 12.1.1 Port (Test Port selection) 12.1.2 Mode (SyncE test mode) 12.2 Clock Measurement 12.3 SyncE Wander Measurements 12.3.1 Setup 12.3.2 Results 12.4 ESMC SSM 13.0 1588v2/PTP 13.1 Setup 13.1.1 Mode (Test Mode) 13.2 Test Results 13.3 Protocol Monitor 13.4 1588v2 Wander Measurements 13.4.1 Setup 13.4.2 Results...
- Page 6 TX130M+_e-manual_D07-00-051P_RevD00 16.0 V-SAM 16.1 V-SAM Setup 16.1.1 Header Settings 16.1.2 Bandwidth Profile 16.1.3 Thresholds 16.2 Results 17.0 VLAN Scan 18.0 Menu B - PDH/DSn Setup 18.1 Signal Overview 18.1.1 Hierarchy 18.1.2 Interface 18.1.3 Payload 18.1.4 Pattern 18.2 Measurement Configuration 18.2.1 Timer Setup 18.2.2 Performance Analysis 18.2.3 General 18.3 Auto-Config...
- Page 7 TX130M+_e-manual_D07-00-051P_RevD00 20.1 Alarm Generation 21.0 E1/E3 Tools 21.1 E1/E3 Pulse Mask 21.2 E1 APS Testing 21.3 E1 Frame Words 21.4 Round Trip Delay 21.5 E1 Rx Data 21.6 E1 VF 21.7 Jitter Measurement 21.8 Wander Measurement 21.8.1 Setup 21.8.2 Results 21.9 V.54 22.0 DS1/3 Tools 22.1 DS1 Pulse Mask...
- Page 8 25.1 Install the MTIE / TDEV post analysis software 25.2 Move TIE Data to a PC 25.3 View Data 25.4 MTIE & TDEV Masks 25.5 Wander Analysis Report 26.0 Warranty and Software 27.0 Product Specification 28.0 Certification and Declaration 29.0 About VeEX Go back to ToC...
-
Page 9: About This Guide
This device uses software either developed by VeEX Inc or licensed by VeEX Inc from third parties. The software is confidential and proprietary of VeEX Inc. The software is protected by copyright and contains trade secrets of VeEX Inc or VeEX's licensors. -
Page 10: Introduction To Tx130M
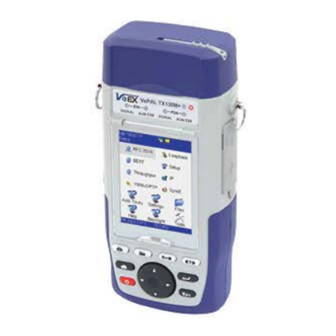
TX130M+_e-manual_D07-00-051P_RevD00 2.0 Introduction to TX130M+ The VePAL TX130M+ is a full-featured Mobile Backhaul test solution supporting legacy PDH/DSn, Carrier Ethernet technologies, and Synchronized Packet networks. The unit is capable of emulating both Master and Slave clocks according to ITU-T G.8261 SyncE and IEEE 1588v2 standards. -
Page 11: Safety Information
Do not operate the instrument in the presence of flammable gases or fumes or any other combustible environment. VeEX Inc. assumes no liability for the customer's failure to comply with safety precautions and requirements. -
Page 12: Basic Operations
TX130M+_e-manual_D07-00-051P_RevD00 4.0 Basic Operations The unit is powered on and off from the red key on the keyboard area. In order to turn off the unit, press the power key for at least two seconds. If the unit is not responding, holding the power key down by more than 10 seconds will force the unit to power down. -
Page 13: Touch-Screen Display
TX130M+_e-manual_D07-00-051P_RevD00 4.2 Touch-Screen Display The LCD supports touch-screen operations. In order to use the unit in touch-screen mode, open the transparent door covering the screen. Then take out the stylus available on the top door i.e. door protecting the connector panel. Keep the LCD cover closed when using the unit in non touch-screen mode, and use the arrow, enter, and escape keys. -
Page 14: Bnc Interface
TX130M+_e-manual_D07-00-051P_RevD00 Go back to top Go back to ToC 4.4.1 BNC Interface 75 ohm unbalanced BNC for E1, DS1, E3, DS3. Go back to top Go back to ToC 4.4.2 Ethernet Port RJ45 Copper 10/100/1000BaseT and SFP 100/1000BaseX. Go back to top Go back to ToC 4.4.3 Dual PDH/DSn Port 120 ohm Balanced RJ48 E1 and DS1. -
Page 15: Leds
Go back to top Go back to ToC 4.6 Software Upgrade There are two methods of updating the test set software: manually or via ReVeal MTX software. Manual Software Upgrade To manually upgrade the test set software, download the latest version from the VeEX website. - Page 16 TX130M+_e-manual_D07-00-051P_RevD00 1. Download software from the VeEX website Enter Username and Password under Partners/Customers Login (1). Click on the Partners tab at the top of the screen after successfully logging in (2). Click on Software, located in the Functions toolbar on the left side of the screen (3).
- Page 17 TX130M+_e-manual_D07-00-051P_RevD00 Please refer to 7.4 Upgrade section in the ReVeal MTX manual. Go back to top Go back to ToC...
-
Page 18: Home Menus
The upper part of Menu A contains items specific to the test application of the handheld test set, while the lower part of the menu contains items common to all VeEX VePAL handheld test sets. Menu B features PDH and DSn test functions. - Page 19 TX130M+_e-manual_D07-00-051P_RevD00 Go back to top Go back to ToC...
-
Page 20: Menu A - Ethernet/Synce/1588V2/Common Features Setup
TX130M+_e-manual_D07-00-051P_RevD00 6.0 Menu A - Ethernet/SyncE/1588v2/Common Features Setup Test ports and network settings are required prior to performing any measurements or applications. Port Setup Port Status (10/100/1000T only) Laser Activation Profiles Measurement Settings Go back to top Go back to ToC 6.1 Port Setup Port setup of the test interface configurations are accessed via the Setup menu located on the Home page. -
Page 21: Port Status
TX130M+_e-manual_D07-00-051P_RevD00 Go back to top Go back to ToC 6.2 Port Status (10/100/1000T only) Copper Port Status Copper Port Status Copper Port Status (Page 1) (Page 2) (Page 3) Go back to top Go back to ToC 6.3 Laser Activation LASER On/Off Operation: When the 100/1000Base-X ports is/are selected, the top pull down menu appears in the Setup/Port screen. -
Page 22: Profiles
TX130M+_e-manual_D07-00-051P_RevD00 Go back to top Go back to ToC 6.4 Profiles Profiles Tab: Previously stored profiles can be viewed, deleted and loaded from this screen. When the user loads a profile, the screen will change automatically to the application that the profile corresponds to. TX130M+ Profile Selection Viewing a Profile Go back to top Go back to ToC... - Page 23 TX130M+_e-manual_D07-00-051P_RevD00 Timed: User defines the duration of the test; after the test is started, the test will run for the configured duration and stop automatically. Auto: User configures the start and end time of the test, selects the type of test to run, and a profile if one has been previously stored.
- Page 24 TX130M+_e-manual_D07-00-051P_RevD00 same time at the start of the test. Separate: Independent control (Start/Stop) of the transmitter is enabled. At the start of the test only the receiver is turned on - the user must start the transmitter manually. Go back to top Go back to ToC...
-
Page 25: Bert
TX130M+_e-manual_D07-00-051P_RevD00 7.0 BERT Overview Setup Header MAC Header VLAN MPLS Data Layer 2 & 3 RX Filter Traffic Error Injection Control Settings Start/ Stop BERT Results Summary Errors Events Alarms Traffic Rates Delay Saving Results Go back to top Go back to ToC Overview: BERT can be accessed under the Additional Tests menu on the home screen. - Page 26 TX130M+_e-manual_D07-00-051P_RevD00 Layer 2: Framed BERT (same as Layer 1 Framed) MAC Address: A default or user configured Media Access Control (MAC) address is added to the frame. This MAC address is used as the source MAC address for all streams (Throughput Testing mode). BERT Setup - Header (Layer 2) BERT Setup - MAC address editing Layer 3: Framed BERT (same as Layer 1 &...
-
Page 27: Bert Setup
TX130M+_e-manual_D07-00-051P_RevD00 BERT Setup - Header (Layer 4) BERT Setup - Header (Layer 4) UDP Settings Go back to top Go back to ToC 7.1 BERT Setup The test layer, frame header, traffic profile, error injection, and control settings of the far-end device (if applicable) must be configured prior to testing. - Page 28 TX130M+_e-manual_D07-00-051P_RevD00 To configure the MAC addresses, IP addresses, VLAN tags, MPLS tags, and test pattern, tap on the frame image displayed on the screen. This brings you to the configuration screens for all the header fields. Alternately, tap on the magnifying glass at the bottom right corner to access the configuration screens.
- Page 29 TX130M+_e-manual_D07-00-051P_RevD00 BERT Setup - VLAN Tag Configuration BERT Setup - VLAN Tag Summary Go back to top Go back to ToC MPLS Tab: In the MPLS tab the following parameters are configured; MPLS label: Can be configured in the range 16 through 1,048,575 (labels 0 to 15 are reserved) Note: Composed of 20 bits which allows for the creation of over one million labels.
- Page 30 TX130M+_e-manual_D07-00-051P_RevD00 Go back to top Go back to ToC IP Tab: In the IP tab the user must configure the destination IP address and source address. The user may also configure the following IP header fields: IP TOS (for Quality of Service testing): Legacy TOS (Precedence): The first three bits of the IP TOS field can be edited;...
- Page 31 TX130M+_e-manual_D07-00-051P_RevD00 Go back to top Go back to ToC Data Tab: User selects a test pattern that will be encapsulated in the Ethernet frame payload (for framed mode). Depending on the test layer, different test pattern options are available; Layer 1 test patterns: CRPAT: Compliant Random Pattern provides broad spectral content and minimal peaking for the measurement of jitter at component or system level.
- Page 32 TX130M+_e-manual_D07-00-051P_RevD00 139 264kbit/s) 2^15 -1 (32 767-bit pattern primarily intended for error and jitter measurements at bit rates of 1544, 2048, 6312, 8448, 32 064 and 44 736kbit/s 2^11 -1 (2047-bit pattern primarily intended for error and jitter measurements on circuits operating at bit rates of 64kbit/s and N 64kbit/s) Fixed: All 0s or All 1s User Defined pattern: Length depends on size of frame...
- Page 33 TX130M+_e-manual_D07-00-051P_RevD00 UDP/TCP: Input Source Port and Destination Port. Go back to top Go back to ToC 7.1.2 Traffic Settings Traffic tab: The user configures the traffic profile for the stream, including traffic flow, frame size, frame type, and transmit rate. Traffic Flow: Select from the following traffic flows: Constant: The selected frame is transmitted continuously according to the selected bandwidth %.
- Page 34 TX130M+_e-manual_D07-00-051P_RevD00 Error injection can only be performed during testing. The error type and injection rate are configured in the Error Injection tab. Error type: Select from Bit, CRC, Bit and CRC, IP Checksum (layer 3 only), TCP/UDP Checksum (layer 4 only), or Pause. Injection Flow: Determines how the selected errors will be injected.
- Page 35 TX130M+_e-manual_D07-00-051P_RevD00 BERT - Control Setup (Manual) BERT - Device Discovery TX Discover Feature - If the local and remote test sets are on the same IP subnet, the TX Discover feature can be used - Automatically discover the far-end test unit by pressing the Discover button - Once discovered, select the remote unit and send a loop up command - No manual configuration of the IP address is needed, since these are populated automatically Go back to top Go back to ToC...
- Page 36 TX130M+_e-manual_D07-00-051P_RevD00 OAM Devices If OAM is enabled, any link partner that supports the IEEE 802.3ah protocol, will be discovered automatically and be displayed under the "OAM Discover" tab. Go back to top Go back to ToC 7.1.5 Starting/Stopping a BERT Once all the necessary configurations have been completed, the user can start the test by selecting Start from the top right corner action pull-down menu (green arrow pointing down).
-
Page 37: Errors
TX130M+_e-manual_D07-00-051P_RevD00 7.2.2 Errors Errors tab: The following Errors (Current and Total) are displayed: Bits: Indicates errors related to test pattern (Bit Error or LSS (Pattern Loss)) BER: Bit Error Ratio Symbol: Declared when an invalid code-group in the transmission code is detected FCS/CRC: Number of received frames with an invalid FCS IP Checksum (Layer 3 only) Jabber frames: Number of received frames larger than 1518 bytes containing an invalid FCS... -
Page 38: Traffic
TX130M+_e-manual_D07-00-051P_RevD00 Go back to top Go back to ToC 7.2.5 Traffic Traffic tab: The following Traffic statistics are displayed: Frame Type: Test and non-test frames Traffic type: Layer 2 and Layer 3 Unicast, Broadcast and Multicast frame percentage Frame size distribution Pause frames Frames tab: The following Frame distribution statistics are displayed in count (#) and percentage (%): Received (RX) frames:... - Page 39 TX130M+_e-manual_D07-00-051P_RevD00 Go back to top Go back to ToC Traffic Type tab: The following Traffic distribution statistics are displayed in Count (#) and Percentage (%): Layer 2 Unicast frames: Number of Unicast frames received without FCS errors Layer 2 Broadcast frames: Number of Broadcast frames received without FCS errors; Broadcast frames have a MAC address equal to FF-FF-FF-FF-FF-FF Layer 2 Multicast frames: Number of Multicast frames received without FCS errors Pause frames: Number of valid flow-control frames received;...
-
Page 40: Rates
TX130M+_e-manual_D07-00-051P_RevD00 Go back to top Go back to ToC 7.2.6 Rates Rates tab: Rate statistics are displayed graphically and in tabular format: Frame rate in Frames per second (FPS): Number of received frames (including bad frames, Broadcast frames and Multicast frames) Data rate in Mbps: Received data rate expressed in Mbps BERT Results - Rates Graph BERT Results - Rates Details... -
Page 41: Saving Bert Results
TX130M+_e-manual_D07-00-051P_RevD00 Minimum Maximum Variation (Current) - - Interframe delay variation BERT Results - Delay Go back to top Go back to ToC 7.2.8 Saving BERT Results Once the test is completed, results can be saved by pressing the save function key on the keypad. The results will be saved and named automatically. -
Page 42: Rfc 2544 Conformance Testing
TX130M+_e-manual_D07-00-051P_RevD00 8.0 RFC 2544 Conformance Testing Overview Setup Header Frames Threshold Throughput Latency Frame Loss Burst Control Start / Stop a RFC 2544 Test Results Status and Events Throughput Latency Frame Loss Burst Save RFC 2544 Results Go back to top Go back to ToC Overview: Service providers often need to test the end-to-end performance of the link when deploying Ethernet services to customers. - Page 43 TX130M+_e-manual_D07-00-051P_RevD00 802.3 LLC (IEEE 802.3 frame with LLC header) 802.3 SNAP (IEEE 802.3 frame with SNAP header) Ethernet II (DIX) (named after DEC, Intel, and Xerox, this is the most common frame type today) MAC/IP: Tap the MAC and IP blocks on the Frame image to access the setup menus Set the Source and Destination MAC address for Layer 2 Set the Source and Destination MAC and IP addresses for Layer 3 VLAN: Off, 1 tag, 2 tags, 3 tags.
-
Page 44: Frame Settings
86DD (Internet Protocol, Version 6 (IPv6)) - Future Release Data Tab: No payload selection is possible. The payload area is populated with a VeEX signature field and other proprietary data. RX Filter Tab: Depending on test layer, allows the user to filter streams by;... -
Page 45: Threshold Settings
TX130M+_e-manual_D07-00-051P_RevD00 Go back to top Go back to ToC 8.1.3 Threshold Settings Threshold tab: User enables or disables threshold settings for the throughput and latency tests. When enabled, threshold settings can be configured for all of the test frames selected in the frame settings tab. A Pass/Fail criteria will be applied when the threshold settings are enabled. - Page 46 TX130M+_e-manual_D07-00-051P_RevD00 The RFC 2544 test suite allows the user to run all of the four tests, one of the four tests, or a combination of any of the four tests. The user simply has to enable/disable which tests to perform by checking/unchecking a selection box in the respective tab for each test.
- Page 47 TX130M+_e-manual_D07-00-051P_RevD00 Custom rate: User configures a custom rate in % or Mbps Rate: Only available if Custom Rate is selected'. Enter up to 100% of the negotiated line rate or enter the rate in Mbps. Duration: 5 to 999 seconds. The default value is 20 seconds. This is the amount of time that the latency test will be performed for each test frame size.
- Page 48 TX130M+_e-manual_D07-00-051P_RevD00 Accessing Upstream and Downstream Settings Depending on the Control Mode selected (e.g. Asymmetric mode), test settings for upstream and downstream are also displayed Go back to top Go back to ToC Burst (Back-to-Back) tab: Max Rate: The default value is 100%. In the burst test, frames are always transmitted at the maximum rate for a given minimum and maximum burst duration.
-
Page 49: Control Settings
TX130M+_e-manual_D07-00-051P_RevD00 Accessing Upstream and Downstream Settings Depending on the Control Mode selected (e.g. Asymmetric mode), test settings for upstream and downstream are also displayed Go back to top Go back to ToC 8.1.5 Control Settings Overview: Asymmetrical links like ADSL and VDSL2 provide different line rates in the two directions - normally the downlink line rate is significantly higher than the uplink line rate. -
Page 50: Starting/Stopping A Rfc 2544 Test
TX130M+_e-manual_D07-00-051P_RevD00 Control button: Configures the loop-up and loop-down commands necessary to control the remote unit or the test profile in the case of Asymmetric testing. The user is allowed to configure the commands manually or automatically. Manual selection: user must input the destination IP address of the far-end device Automatic selection: No configuration is necessary - user only has to select the "discovered"... -
Page 51: Rfc 2544 Results
TX130M+_e-manual_D07-00-051P_RevD00 suite needs to be stopped before they are done, then simply press the Stop button, located in the actions pull down menu. The status of each selected test can be seen in the Results tab. Far-End Unit Controlled with Manual Mode Loop Up/Down Commands If the far-end unit is not manually looped back, then it must first receive a loop up command from the control unit before the RFC 2544 test suite can be started. -
Page 52: Throughput
TX130M+_e-manual_D07-00-051P_RevD00 Go back to top Go back to ToC 8.2.2 Throughput Throughput results are displayed in the following formats: Graphical Summary table Test log table RFC Results - Throughput Summary RFC Results - Throughput Graph RFC Results - Throughput Test Log Go back to top Go back to ToC 8.2.3 Latency Latency results are displayed in the following formats;... -
Page 53: Frame Loss
TX130M+_e-manual_D07-00-051P_RevD00 Test log - Byte Size, Latency (ms), Rate (%) and Status (Pass or Fail) Jitter Graph Jitter Summary Jitter Log RFC Results - Latency Summary RFC Results - Latency Graph RFC Results - Latency Test Log RFC Results - Latency Jitter Graph RFC Results - Latency Jitter Summary RFC Results - Latency Jitter Log Go back to top Go back to ToC... -
Page 54: Burst
TX130M+_e-manual_D07-00-051P_RevD00 RFC Results - Frame Loss Test Graph RFC Results - Frame Loss Graph (Zoomed) Go back to top Go back to ToC 8.2.5 Burst Burstability (back-back) results are displayed in the following formats; Summary table Test log table RFC Results - Burstability Summary RFC Results - Burstability Test Log... - Page 55 TX130M+_e-manual_D07-00-051P_RevD00 Go back to top Go back to ToC 8.2.6 Saving RFC 2544 Results Once the test has been stopped the results can be saved by pressing the save key on the keypad. The results will be saved and named automatically. Once the results are saved, the user may view or rename the results file by going to the Explorer folder located in the Files menu.
-
Page 56: Saving Rfc 2544 Results
TX130M+_e-manual_D07-00-051P_RevD00 9.0 Throughput Testing (Multiple Streams) Overview Setup General Control Per Stream Header Per Stream Traffic Per Stream Error Injection Start / Stop a Throughput Test Results Global Aggregate Global Errors Global Alarms Global Traffic Per Stream Summary Per Stream Errors Per Stream Events Per Stream Delay Per Stream Traffic... -
Page 57: Control
TX130M+_e-manual_D07-00-051P_RevD00 # of Streams: From 1 to 8 streams. Pressing the zoom function, displays the Bandwidth allocated per Stream Note: The total bandwidth for all streams cannot exceed 100%. RTD Measurements: Enable: enables the Round Trip Delay measurements to be displayed in the Results/Per Stream/Delay page. RTD measurements MUST be done with the far-end test partner in loopback mode. -
Page 58: Per Stream Configurations
TX130M+_e-manual_D07-00-051P_RevD00 Automatic selection: User must select from a list of discovered devices to loop-up/down. In automatic mode no configuration is necessary - user only has to select the "discovered" far-end device to control. Go back to top Go back to ToC 9.1.3 Per Stream Configurations Please note that for any of the per stream configurations (Header, Traffic, and Error Injection), a stream number will be displayed. -
Page 59: Traffic Settings (Individual Stream Configurations)
TX130M+_e-manual_D07-00-051P_RevD00 Multiple Streams All streams are configured for the same test layer - if layer 2 is selected, then all streams will be layer 2 traffic. Throughput - Header Summary Stream #1 Throughput - MAC Setup Stream #1 Multiple Streams - MAC/IP address setups If all streams are going to the same far-end unit, then the MAC/IP destination addresses must be the same on all of the streams. -
Page 60: Error Injection Settings (Individual Stream Configuration)
TX130M+_e-manual_D07-00-051P_RevD00 Throughput - Traffic Setup - Single Burst Throughput - Traffic Setup - Burst Go back to top Go back to ToC 9.1.5 Error Injection Settings (Individual Stream Configuration) Error injection can be performed during test. The type of errors and error injection are configured in the Error Injection tab. Once the test is running, error injection can be performed by pressing the Error Inject button on the right side of the screen. -
Page 61: Starting/Stopping A Throughput (Multiple Streams) Test
TX130M+_e-manual_D07-00-051P_RevD00 Go back to top Go back to ToC 9.1.6 Starting/Stopping a Throughput (Multiple Streams) Test Once all the necessary configurations have been made, the user can now start the Throughput test. The following are three scenarios of how to prepare and start the unit for Throughput testing. Note: If the testing on the fiber ports, make sure the LASER is turned On before starting the test. -
Page 62: Viewing Test Results (Individual And Multiple Streams)
TX130M+_e-manual_D07-00-051P_RevD00 9.2.1 Viewing Test Results (Individual and Multiple Streams) When the test is first started, the screen automatically changes to the Global/Aggregate results screen. Go back to top Go back to ToC 9.2.2 Global Results The Aggregate screen displays: Line Rate (Mbps): Negotiated rate of the interface (10M, 100M, or 1000M). This value is always fixed since it depends on the maximum capacity of the link under test, hence the test interface that is configured. - Page 63 TX130M+_e-manual_D07-00-051P_RevD00 IP Network QoS Class Definitions and Network Performance Objectives (Classes 4-7) Throughput Results - Global Aggregate Throughput Results - Stream Summary Go back to top Go back to ToC The Global 'Errors' screen displays the Current and Total error count of all streams: Bit: Indicates errors related to test pattern (Bit Error or LSS [Pattern Loss]) BER: Bit Error Ratio...
- Page 64 TX130M+_e-manual_D07-00-051P_RevD00 Symbol: Declared when an invalid code-group in the transmission code is detected FCS/CRC: Number of received frames with an invalid Frame Check Sequence (FCS) IP Checksum: Invalid IP Frame Check sequence Jabber frames: Number of received frames larger than 1518 bytes containing an invalid FCS Runt frames: Number of received frames smaller than 64 bytes containing an invalid FCS Go back to top Go back to ToC The Global 'Alarms' screen displays the Current and Total alarm count of all streams:...
-
Page 65: Individual Stream Results
TX130M+_e-manual_D07-00-051P_RevD00 Go back to top Go back to ToC The Global 'Traffic' screen displays: Frame Type of all streams Traffic Type/s of all streams Frame size of all streams Throughput Results - Global Traffic Summary Throughput Results - Global Stream Delay Go back to top Go back to ToC 9.2.3 Individual Stream Results In the 'Per Stream' tab the following measurements are available:... - Page 66 TX130M+_e-manual_D07-00-051P_RevD00 Go back to top Go back to ToC The Per Stream 'Errors' screen displays the Current and Total error count of each stream: Bit: Indicates errors related to test pattern (Bit Error or LSS [Pattern Loss]) BER: Bit Error Ratio Frame Loss Frame Loss % Symbol: Declared when an invalid code-group in the transmission code is detected...
- Page 67 TX130M+_e-manual_D07-00-051P_RevD00 each stream. The Per Stream 'Delay' screen displays the frame delay information pertaining to each stream. Throughput Results - Events per Stream Throughput Results - Delay per Stream Go back to top Go back to ToC The Per Stream 'Traffic' screen displays the frame type summary (graphical), frame type (tabular) and frame size distribution pertaining to each stream.
-
Page 68: Saving Throughput (Multiple Streams) Results
TX130M+_e-manual_D07-00-051P_RevD00 Rate Details Stream 1 Rate Details Stream 2 Go back to top Go back to ToC 9.2.4 Saving Throughput (Multiple Streams) Results Only once the test has been stopped, can the results be saved by pressing the save function key on the VePAL keypad. If the measurement is not stopped, a pop-up message will appear warning the user. - Page 69 TX130M+_e-manual_D07-00-051P_RevD00 Go back to top Go back to ToC...
-
Page 70: Oam Testing
TX130M+_e-manual_D07-00-051P_RevD00 10.0 OAM Testing Overview Setup Link Level 802.3ah OAM Setup Service Level OAM: 802.1ag/Y.1731 General Setup Process Service Level OAM Configuration Parameters Results Link OAM Results OAM Service Results Definitions 802.3ah OAM Discovery IEEE 802.1ag Definitions Continuity Check Messages (CCM) 802.1ag/Y.1731 Connectivity Fault Management Functions Link Trace and Loopback Messages Frame Loss Measurement... - Page 71 TX130M+_e-manual_D07-00-051P_RevD00 Organizational Specific Extensions (function not supported in current software release) Link OAM Setup (Page 1) Link OAM Setup (Page 2) Page 1 802.3ah OAM: Tap on the check box to start 802.3ah protocol testing. Transmission of OAM PDUs starts as soon as the box is checked.
-
Page 72: Service Level Oam
TX130M+_e-manual_D07-00-051P_RevD00 and 4 are also displayed with the test options. Select the available test options on Page 3 and 4. For 802.1ag the following are available: Continuity Check Messages (CCM), Loopback Message (LBM) and Link Trace Message (LTM) For Y.1731 the following are available: Continuity Check Messages (CCM), Loopback Message (LBM), Link Trace Message (LTM), Frame Loss (LM) and Delay (DM). -
Page 73: Oam Results
TX130M+_e-manual_D07-00-051P_RevD00 VLAN Type: C-VLAN or S-VLAN Direction Up: Inward facing MEP used for MA/MEG with a wider reach (i.e., end-to-end, beyond a single link). Down: Outward facing MEP used for MA/MEG spanning a single link. Dest MEP ID: MEP ID of the MEP end point. Page 3: Enable: Enable sending Continuity Check messages Disable: Disable sending Continuity Check messages... - Page 74 TX130M+_e-manual_D07-00-051P_RevD00 Link OAM Discovery The discovery page lists Local (the current test unit) and Remote (far-end device) parameters. OAM - Link - Discovery (Page 1) Mode: Lists Active or Passive mode configuration. Supported and unsupported capabilities advertised during Discovery are listed, including: Unidirection, Link Events, Remote Loopback, MIB Retrieval, and MTU Size.
-
Page 75: Oam Service Results
TX130M+_e-manual_D07-00-051P_RevD00 OAM - Service - CCM OAM PDU Transmitted and received 802.3ah OAM PDU are displayed with other Link OAM statistics: Information: Information OAM PDU acts as a "heart beat" message. Discovery must be restarted if no OAM PDU is received after 5 seconds. - Page 76 TX130M+_e-manual_D07-00-051P_RevD00 OAM CCM Results RDI, LOC, XCON, UNEXP, and Alarm will display an Inactive or Active status. Remote MPID: MEP ID of the remote MEP. Remote MAC: MAC address of the remote MEP. RDI: The CCM received contains the RDI flag set. LOC: The MEP detects loss of connectivity.
- Page 77 TX130M+_e-manual_D07-00-051P_RevD00 In Order: Number of LBR received in order Out of Order: Number of LBR received out of order No Match: The loopback transaction ID between the LBM and LBR do not match OAM - Service - LTM OAM LTM Results Action: RlyHit indicates that the LTM has reached the destination MAC/MEP (i.e., final point) MAC: MAC address of the responder TTL: TTL field on the response, indicated how many hops have been traversed...
-
Page 78: Definitions
TX130M+_e-manual_D07-00-051P_RevD00 OAM - Service - DMM OAM DMM Parameters DMM Status: Lists status: In progress, Fail, or Complete Delay Samples: Number of frames transmitted Average Delay: Average round trip delay over the number of delay samples Average Variation: Average round trip delay variation over the number of delay samples Last Delay: Last round trip delay value measured Last Variation: Last round trip delay variation value measured Go back to top Go back to ToC... -
Page 79: Ieee 802.1Ag Definitions
TX130M+_e-manual_D07-00-051P_RevD00 Notice that each device can be placed in any mode as long as the remote and local device are not both in passive mode. Discovery Capabilities: Capabilities advertised during discovery process Remote Loopback: The user can transmit a loopback command to place the remote unit into loopback mode. Every frame received is transmitted back on the same port to ensure the quality of links during installation or troubleshooting and for fault isolation testing. -
Page 80: Continuity Check Messages (Ccm)
TX130M+_e-manual_D07-00-051P_RevD00 Maintenance Point Roles Go back to top Go back to ToC 10.3.3 Continuity Check Messages (CCM) CCM Messages are multicast messages sent from MEP to MEP at configurable intervals. Loss of continuity is detected after no CCM is received for 3.5 times the CCM interval. Note: There can be 4,094 VLANs per port and up to eight maintenance levels. -
Page 81: Ag/Y.1731 Connectivity Fault Management Functions
TX130M+_e-manual_D07-00-051P_RevD00 Go back to top Go back to ToC 10.3.4 802.1ag/Y.1731 Connectivity Fault Management Functions 802.1ag/Y.1731 Functions supported are as listed: Fault Detection – Continuity Check: CCM "heartbeat" messages are transmitted at a configurable periodic interval by MEPs. Network/Path Discovery – Link trace message: Equivalent to a "traceroute"... - Page 82 TX130M+_e-manual_D07-00-051P_RevD00 Link Trace Response Format OAM Service Level - LBM Loopback Message (LBM/LBR) LBM (Loopback Message) are unicast messages transmitted on demand to a destination MAC address. A destination address responds with an LBR (Loopback Reply Message). LBM Diagram Loopback Message Format...
-
Page 83: Frame Loss Measurement
TX130M+_e-manual_D07-00-051P_RevD00 Go back to top Go back to ToC 10.3.6 Frame Loss Measurement Two local counters for each peer MEP: TxFCf: Counter for in-profile data frames transmitted towards peer MEP RxFCf: Counter for in-profile data frames received from peer MEP Single-ended ETH-LM: On demand OAM MEP sends LMM frame (Unicast DA or Multicast Class 1 DA) and receives LMR frame (Unicast DA) with counters... -
Page 84: Loopback
TX130M+_e-manual_D07-00-051P_RevD00 11.0 Loopback The Loopback application in the main menu allows the user to establish a manual loopback on the test set. The loopback function is used when an end-to-end test needs to be performed with one of the test partners in software loopback mode. The Loopback function will loopback the incoming traffic to the test set back into the network under test. -
Page 85: Synce
TX130M+_e-manual_D07-00-051P_RevD00 12.0 SyncE Setup Port Selection Mode Clock Measurement SyncE Wander Measurements ESMC SSM Overview Setup Results Monitor Capture SyncE Main Menu Go back to top Go back to ToC 12.1 SyncE Setup 12.1.1 Port (Test Port selection) Prior to starting the SyncE operation, the selected test port must be connected to a network that supports SyncE timing synchronization. -
Page 86: Mode (Synce Test Mode)
TX130M+_e-manual_D07-00-051P_RevD00 Go back to top Go back to ToC 12.1.2 Mode (SyncE test mode) SyncE Master-Emulation Mode SyncE Slave-Emulation Mode The Mode setup parameters are as follows: Mode: There are four test modes available: Master Emulation, Slave Emulation, Master Sync, and Slave Sync. Master Emulation - Emulates a SyncE Master clock device out of the Ethernet test port (10/100/1000BaseT or 100/1000BaseX). - Page 87 TX130M+_e-manual_D07-00-051P_RevD00 Master Sync: Emulates a SyncE Master clock device out of the Ethernet test port (10/100/1000BaseT or 100/1000BaseX). Uses an internal or external reference clock. The reference clock used on the SyncE link can be used for Ethernet and PDH testing simultaneously while the clocks are synchronized, the PDH TX port can be used for BERT testing.
-
Page 88: Clock Measurement
TX130M+_e-manual_D07-00-051P_RevD00 Indicator Symbols An M or S indicates that the test set is in Master or Slave Mode. A green SyncE icon indicates that the SyncE test is running and a green 1588 icon indicates that the 1588 test is running. If the icon is flashing or solid red, there may be an issue with setup and the test will not work. -
Page 89: Synce Wander Measurements
Press the Stop button to terminate the test. If Save TIE to USB is set to ON, then remove the USB memory stick from the test set, bring it to a computer, and open it with the VeEX Wander Analysis PC software, for further MTIE, TDEV, and masks analysis (refer to the MTIE and TDEV Analysis section). -
Page 90: Esmc Ssm
TX130M+_e-manual_D07-00-051P_RevD00 Go back to top Go back to ToC 12.4 ESMC SSM Overview Ethernet Synchronization Message Channel (ESMC) Synchronization Status Messages (SSM) are supported by both SDH and Ethernet networks. SDH is supported by the transport overhead channel and is unidirectional, Ethernet is defined as Organization Specific Slow Protocol (OSSP). - Page 91 TX130M+_e-manual_D07-00-051P_RevD00 IEEE Assigned OUI and slow protocol subtype QL TLV Format TLV: Type Length Field QL: Quality Level Heirarchy of Quality Levels in Option I of Synchronization Networks Heirarchy of Quality Levels in Option II Synchronization Networks In TX130M+ the SyncE ESMC SSM option has the following features:...
- Page 92 TX130M+_e-manual_D07-00-051P_RevD00 Generates “information” at a programmable interval, IPG, (default 1 sec) Generates “event” upon changing the QL-TLV followed by “information” Count message types Monitor and decode messages on screen Capture ESMC/SSM messages and output in pcap file for further off-line protocol analysis Go back to top Go back to ToC Setup Mode: The TX130M+ can be set as Master or Slave.
- Page 93 TX130M+_e-manual_D07-00-051P_RevD00 Go back to top Go back to ToC Monitor The Tracer shows the messages as they are sent or received. The TX130M+ stores up to 2000 messages. There are four function keys: Pause/Continue - to pause or continue the tracer. ->...
- Page 94 TX130M+_e-manual_D07-00-051P_RevD00 To store these results packets, press stop, then press Save as. Enter a name for the results file. Press Apply to save the file. The file is saved under the Files folder on the unit in pcap format. The file can be later exported to a PC and analyzed using Wireshark.
-
Page 95: 1588V2/Ptp
TX130M+_e-manual_D07-00-051P_RevD00 13.0 1588v2/PTP Setup IP Configuration Port Mode Setup Reference Clock Test Results PTP Messages Overview Protocol Monitor 1588v2 Wander Measurement Setup Results 1588v2/PTP Main Menu Go back to top Go back to ToC 13.1 Setup Before proceeding with any tests, configure the Port and IP connection. IP configuration setup (Page 1) IP Type: IPv4 or IPv6... -
Page 96: Mode (Test Mode)
TX130M+_e-manual_D07-00-051P_RevD00 Pri: VLAN priority 0 to 7. Type: Set to 8100. Indicates 802.1q tag type. DHCP Options: DHCP options can be edited. Off, All, Vendor Type, User Class, Host Name, and Vendor Info. Note: DHCP Options are only available under AUTO or DHCP. Port Setup Refer to 12.0 SyncE Port... - Page 97 TX130M+_e-manual_D07-00-051P_RevD00 Master and Slave Clock ID: This field is not configurable; it will be populated with the clock ID of the 1588 Master and Slave once the 1588 protocol exchange is established. This will be indicated by the 1588 top icon becoming green. The Clock ID is formatted as the MAC address of the device first 3 byte -- FF -- FE -- last 3 byte of MAC address.
-
Page 98: Test Results
TX130M+_e-manual_D07-00-051P_RevD00 13.2 Test Results The Test Results are only available in 1588v2 PTP slave emulation mode. The Summary screen displays the 1588v2 message statistics including the number of Total messages, Event messages, and General messages along with information on Lost, Duplicated and Out of Ordered messages. Tap on the "..." tab to see more detailed message error information. - Page 99 TX130M+_e-manual_D07-00-051P_RevD00 Test Result screens below. Pressing Restart at the bottom of the screen will clear the counter and histograms. PDV: Delay Request, Asymmetry, and Sync PDV min and max information. Delay Request: The Delay_Req PDV measures t4-t3 (delay message jitter) Asymmetry: The Asymmetry PDV measures (t4-t3)+(t2-t1) (this measures the Delay) Sync PDV: The Sync PDV measures t2-t1 (sync messages jitter) RoundTrip PDV: The RoundTrip PDV measures (t4-t3)+(t2-t1), which is the Delay measurement packet delay variation...
- Page 100 TX130M+_e-manual_D07-00-051P_RevD00 Go back to top Go back to ToC Overview of timing - PTP Messages 1. The master starts the exchange by sending a Sync message to the slave. The message contains the time t1 at which the packet was sent. The slave notes the time t2 at which this message was received. Depending on the master hardware capabilities, the sending time may not be accurate enough in the original Sync message;...
-
Page 101: Protocol Monitor
TX130M+_e-manual_D07-00-051P_RevD00 13.3 Protocol Monitor The Tracer shows the 1588v2 messages from both Master and Slave clock devices. The TX130M+ stores up to 2000 messages. There are four function keys: Pause/Continue - to pause or continue the tracer. -> & <- - in Pause mode, use the key to page up or page down. End - in Pause mode, use End key to jump to the end of the trace. -
Page 102: Results
Press the Stop button to terminate the test. If Save TIE to USB is set to ON, then remove the USB memory stick from the test set, bring it to a computer, and open it with the VeEX Wander Analysis PC software, for further MTIE, TDEV, and masks analysis (refer to the MTIE and TDEV Analysis section). -
Page 103: Additional Tests - Menu A
TX130M+_e-manual_D07-00-051P_RevD00 14.0 Additional Tests - Menu A The Additional Tests Menu offers the following test options: NetWiz BERT Scan Profile Scripting Additional Tests (Menu A) - Home Go back to top Go back to ToC 14.1 NetWiz Please refer to the V100+ Common Functions Manual (Chapter 5.2) for this section. Go back to top Go back to ToC 14.2 BERT Please refer to section... - Page 104 TX130M+_e-manual_D07-00-051P_RevD00 Profile Scripting Home Select Profile 3. Tap Start to start the test. The screen will show the respective test's results screen. Test Results Summary 4. Open the Action Menu by tapping the arrow icon in the top right hand corner. The actions available are: Close: Stop the test Restart: Restart the test Next Profile: Move to the next profile in the script for testing.
- Page 105 TX130M+_e-manual_D07-00-051P_RevD00 Go back to top Go back to ToC...
-
Page 106: Common Functions
TX130M+_e-manual_D07-00-051P_RevD00 15.0 Common Functions Home Menu A (Common functions listed at the bottom portion of screen) The following functions, (Chapters 15.1-15.6) are functions common to all V100+ test sets. Please refer to the V100+ Common Functions Manual for these sections. The sections are renumbered in the V100+ Common Functions Manual as follows: 14.1 Additional Tests: (5.2) Net Wiz 14.2 (6.0) Settings 14.3 (7.0) Files... -
Page 107: V-Sam
Go back to top Go back to ToC Overview V-SAM (VeEX Service Activation Methodology) is an automated Ethernet service activation test feature conforming to the ITU-T Y.1564 standard, created to address and solve the deficiencies of RFC 2544: RFC2544 was limited to test at the maximum throughput line rate for a single service. SAM is able to run multiple services on a single 10/100/1000 or 10G Ethernet line at a bandwidth ranging from 0 to the line rate, allowing for more realistic stream testing. - Page 108 TX130M+_e-manual_D07-00-051P_RevD00 Phase 2: Service Performance test: The services running on the same line are tested simultaneously over an extended period of time, to verify network robustness. Test Application Phase 1: Service Configuration Test The service configuration test is broken down into three steps. The steps are tested individually for all the services delivered on the same line.
-
Page 109: V-Sam Setup
TX130M+_e-manual_D07-00-051P_RevD00 16.1 V-SAM Setup General (Page 1) Profile: Default, Save, Save as New # of Services: Select the number of services to run. Up to 8 services can be chosen for a 1 GE interface. Configuration Test: Enable or Disable the configuration test. Configuration Test Step: Specify min and max duration for the configuration test step. - Page 110 TX130M+_e-manual_D07-00-051P_RevD00 the RFC 2544 Setup section. The user can assign a name to each stream by tapping on the Service Name box and entering a name. V-SAM Services - Header V-SAM Services - Header - Selecting a Stream V-SAM Header Configuration Selecting a Stream On the Services tab, tap on the stream number (S #) next to the Action Menu icon to select a service to configure.
-
Page 111: Bandwidth Profile
TX130M+_e-manual_D07-00-051P_RevD00 16.1.2 Bandwidth Profile The Bandwidth Profile specifies how much traffic the customer is authorized to transmit and how the frames are prioritized within the network. Under the Bandwidth tab, the user specifies the following bandwidth criteria: Frame Size: Input a fixed frame size within the range of 64-10000 bytes. CIR: Committed Information Rate. -
Page 112: Results
TX130M+_e-manual_D07-00-051P_RevD00 for traffic conforming to the CIR. Enter a percentage from 0-100. The user can also choose to Disable the AVAIL threshold evaluation. AVAIL will be measured regardless, but the value will not contribute toward passing or failing the service. Copying Frame Configurations V-SAM Services - Thresholds Between Services... - Page 113 TX130M+_e-manual_D07-00-051P_RevD00 S1 Detailed Results - CIR Test S1 Detailed Results - CIR/EIR Test S1 Detailed Results - Policing Test Viewing Test Results on Different Streams On the Services tab of Conf. Test and Perf. Test, tap on the service number (S #) next to the Action Menu icon to view the test results for a specific stream.
- Page 114 TX130M+_e-manual_D07-00-051P_RevD00 does not exceed the allowed CIR+EIR. CBS Test: The test passes if the frame loss rate stays below the configured FLR. EBS Test: The test passes if the frame loss rate stays below the configured FLR. CIR, CIR/EIR Test, and Policing tabs display min, mean, and max values for IR Mbps, FTD, FDV, FL Count, and FLR (%).
- Page 115 TX130M+_e-manual_D07-00-051P_RevD00 Go back to top Go back to ToC Events A time stamped record or log of test types and test statuses (start/stop). Events Go back to top Go back to ToC...
-
Page 116: Vlan Scan
TX130M+_e-manual_D07-00-051P_RevD00 17.0 VLAN Scan Scan is only available in single port mode. To change the operation mode, go to the home menu, then navigate to Setup > Operation Mode > Single Port. VLAN Scan scans up to 4096 VLAN IDs for switch configuration and displays VLAN ID bandwidth rates, useful for identifying top bandwidth users based on VLAN ID. - Page 117 TX130M+_e-manual_D07-00-051P_RevD00 Monitoring Traffic After checking VLAN IDs to monitor (from the VLAN ID tab), press Monitor (on the screen or from the Action menu ) to monitor streaming traffic. To only receive traffic streams meeting specific criteria, go to the Monitor tab to configure filter parameters.
- Page 118 TX130M+_e-manual_D07-00-051P_RevD00 For a description of each measurement from Global and Per Stream Results tabs, please see the Throughput Results section. To view measurements for other streams, tap on the Stream # drop-down menu to select a different stream. Monitor Setup Viewing Results by Stream Go back to ToC...
- Page 119 TX130M+_e-manual_D07-00-051P_RevD00 18.0 Menu B PDH/Dsn Setup Signal Overview Hierarchy Interface Payload Rate Framing Pattern Measurement Configuration Timer Setup Performance Analysis General Auto-Config Go back to top Go back to ToC PDH/Dsn Setup PDH/DSn Home Menu To access the Setup application, tap on the Setup icon. This application allows the user to set up the Transmitter and Receiver interfaces and associated test parameters prior to running a test.
-
Page 120: Signal Overview
TX130M+_e-manual_D07-00-051P_RevD00 Go back to top Go back to ToC 18.1 Signal Overview The Transmitter and Receiver configurations are grouped into a simple yet intuitive block diagram. The Tx and Rx signal parameters can be modified by tapping the applicable block which brings up a new dialog window displaying additional input and specific selection settings. -
Page 121: Interface
TX130M+_e-manual_D07-00-051P_RevD00 Go back to top Go back to ToC 18.1.2 Interface Tap the Interface box to access this feature. Interface allows the user to select clock source. Offset options are also configured in this screen. Coupled Interface - External Line Code: In E1 mode, the line code options default to HDB3 or AMI. -
Page 122: Payload
TX130M+_e-manual_D07-00-051P_RevD00 External: Clock Port: Unbalanced RX2 selected as default. Clock External Aux Line Code: HDB3, B8ZS, or AMI Rx: The clock for the transmitter is derived from the received signal and the jitter of the incoming signal is suppressed. Offset: Clock Offset: With the Clock Offset box checked, a custom deviation value of +/- 50ppm can be entered Termination (Rx only): The sensitivity of the receiver can be set for ITU-T/ANSI, Protected Monitoring Points (PMP) or High Impedance connections. - Page 123 TX130M+_e-manual_D07-00-051P_RevD00 34 M: Configures the transmitter for full rate testing at 34Mbit/s 2 M (E3/E1 Mux): Configures the transmitter for full rate testing at 34Mbit/s signal with E1 payloads (1 to 16 channels) Fractional E1 (E3/E1Mux w/Nx64): Configures the transmitter for full rate testing at 34Mbit/s signal with E1 payloads (1 to 16 channels) for fractional testing using N or M 64kbit/s timeslots.
-
Page 124: Pattern
TX130M+_e-manual_D07-00-051P_RevD00 Framing: Options are PCM31, PCM31C, PCM30, and PCM30C per G.704 and G.706 recommendations same as E1 described above. Note: Unframed signal types are not supported in the Nx64 fractional mode because framing is required to determine the location of timeslots. Unused: AIS, Broadcast, Unequipped used to fill up the unused (idle) timeslots Timeslot Selection: Select the timeslot by tapping the applicable box. -
Page 125: Measurement Configuration
TX130M+_e-manual_D07-00-051P_RevD00 Warning Message While a test is running, it is possible to view the signal configuration, but it is not possible to change the setup or modify other measurements settings on the fly. This warning screen is only shown during initial setup to alert the user. Go back to top Go back to ToC 18.2 Measurement Configuration Tapping the Measurements box opens the setup screen for the Timer, Performance Analysis and General configurations. -
Page 126: Performance Analysis
TX130M+_e-manual_D07-00-051P_RevD00 Note: The timed mode will be required when running a M.2100 performance. Go back to top Go back to ToC 18.2.2 Performance Analysis The Analysis setup page selects the ITU-T performance test that will be performed by the unit. The selections include None, G.821, G.826 and M.2100. -
Page 127: Auto-Config
TX130M+_e-manual_D07-00-051P_RevD00 Audible Alarm: On or Off. Provides an audible indication when alarm or error condition is recorded. Results on start: On or Off. Provides an automatic move to results screen when it starts Auto Save: The Automatic Save results file. Tapping the Auto Save set to "ON" will automatically save the results file. Measurement Clock Source: Internal Clock or Tx Clock Source;... - Page 128 TX130M+_e-manual_D07-00-051P_RevD00 Search Parameters and Criteria Interface: Checks physical parameters (bit rate line code) Payload: Only test patterns defined in ITU-T or ANSI standards will be recognized. If no test pattern is detected, the unit assumes live traffic. PDH Signals: Unframed or framed payloads at all hierarchies. For 2M signals containing 64kbit/s timeslots, the TX130+ will assume live traffic and will not search for a test pattern.
-
Page 129: Results
TX130M+_e-manual_D07-00-051P_RevD00 19.0 Results Measurements are accessed by tapping the Results icon in the main menu. The results comprise a range of tabbed pages, similar to the setup pages. Summary PDH Errors / Alarms Event Log Signal Analysis Histograms Graph Go back to top Go back to ToC 19.1 PDH Results 19.1.1 Summary The Summary tab displays an overview of the major test parameters. - Page 130 TX130M+_e-manual_D07-00-051P_RevD00 Errors/Alarms Tab Errors/Alarms Tab - Dual E1 Mode Note: Tapping the individual soft LED will automatically link you to the applicable result screen which provides detailed information. Go back to top Go back to ToC Errors/Alarms (Page 2) Page 2 of 4 lists the alarms in logical order that are associated with the signal under test. All alarms are evaluated and stored. The time resolution of alarms is 100ms.
- Page 131 TX130M+_e-manual_D07-00-051P_RevD00 Go back to top Go back to ToC Errors/Alarms (Page 4) Page 4 of 4 lists the Bit Error Performance (BERT) associated with the signal under test. Errors/Alarms Tab (Page 4) Errors/Alarms Tab (Page 6) - Dual E1 Mode Go back to top Go back to ToC 19.1.3 Event Log The Event log tab brings up the screen listing the error and alarm events recorded during a test.
-
Page 132: Signal
TX130M+_e-manual_D07-00-051P_RevD00 Event Log Go back to top Go back to ToC 19.1.4 Signal The Signal tab brings up the Frequency and Level result screen. Signal Frequency: The received signal frequency and offset is measured and displayed. For E1 signals, the measurement is performed on both balanced 120ohm and unbalanced 75ohm interfaces. -
Page 133: Analysis
TX130M+_e-manual_D07-00-051P_RevD00 Level: Measures the Peak and Peak-Peak voltage values of the incoming signal. The levels for the various signal types according to ITU-T recommendations are presented in the table below. Go back to top Go back to ToC 19.1.5 Analysis ITU-T recommendations are available to analyze results. - Page 134 TX130M+_e-manual_D07-00-051P_RevD00 The alarms and errors presented will depend on the signal type and structure selected. A graphical timeline on the horizontal axis indicates when the event occurred since the test was started. The upper left and right arrows allow the user to scroll through the measurement period while the + and –...
-
Page 135: Graph
TX130M+_e-manual_D07-00-051P_RevD00 The screen below depicts BER and bit errors. Histogram (BERT Alarms/Errors) Go back to top Go back to ToC 19.1.7 Graph The Bar tab brings up the screen displaying a log of the Errors recorded during the measurement interval. A dedicated page is available for each error type. - Page 136 TX130M+_e-manual_D07-00-051P_RevD00 A graphical timeline on the horizontal axis indicates when the event occurred while, the vertical axis indicates the error ratio. The upper left and right arrows allow the user to scroll through the measurement period while the + and – keys allow zooming of the time axis.
-
Page 137: Alarms/Errors
TX130M+_e-manual_D07-00-051P_RevD00 20.0 Alarms/Errors The Alarm and Error generation functionality can be found on the main menu. Tap the Alarm/Error icon to display the Alarm and Error Generation screen. The Alarm and Error functions are used in conjunction with the pull-down menu, which has dedicated buttons for Error Injection and Alarm Generation. The alarm and error selections will depend on PDH signal types. - Page 138 TX130M+_e-manual_D07-00-051P_RevD00 have been selected. PDH/DSn Alarm Generation Error Insertion (pull-down menu) At any time during the test process, you can inject errors or generate alarms by tapping the Error Injection and Alarm Generation buttons in the pull-down menu. Alarm/Error Injection Menu Go back to top Go back to ToC...
-
Page 139: E1/E3 Tools
TX130M+_e-manual_D07-00-051P_RevD00 21.0 E1/E3 Tools The E1 and E3 Tools can be found on the main menu. Tap the E1 and E3 Tools icon to display the shortcut screen shown below. E1 Tools Menu E3 Tools Menu E1/E3 Pulse Mask E1 APS Service Disruption Testing E1 Frame Words Round Trip Delay E1 Rx Data... -
Page 140: E1 Aps Testing
TX130M+_e-manual_D07-00-051P_RevD00 as necessary to compensate for test point or cable attenuation characteristics. E1 Pulse Mask E3 Pulse Mask Go back to top Go back to ToC 21.2 E1 APS Service Disruption Testing This function measures the Automatic Protection Switching (APS) limits of the network. APS applies the Multiple E1 Links and enables network elements to reroute traffic to a backup circuit in the event of network failure or problems. -
Page 141: E1 Frame Words
TX130M+_e-manual_D07-00-051P_RevD00 Go back to top Go back to ToC 21.3 E1 Frame Words This function requires the E1 signal to be framed. The NFAS word is used to carry information about the status of the link and to provide control signals for primary rate multiplexers. Sa bits are often used to transmit the clock quality level (QL) SSM information. -
Page 142: E1 Rx Data
TX130M+_e-manual_D07-00-051P_RevD00 The Round Trip Delay (Propagation Delay) measurement works by sending a test pattern. An error is transmitted in the pattern. The time it takes for the error to reach the receiver is the propagation time through the network. View the Round Trip Delay of a looped back signal Set check box on Setup Rx pattern to Out-of-Service Go back to top Go back to ToC 21.5 E1 Rx Data... -
Page 143: Jitter Measurement
TX130M+_e-manual_D07-00-051P_RevD00 E1 VF Tasks E1 Warning Note Do not attempt to enter VF Tasks if the Frame LED is not green. Green LEDs indicate that the framing found on the received signal matches the framing selected in the Setup screen. It is impossible to talk, listen, or perform other channelized functions in the absence of frame synchronization, since channels can be identified only within a framed signal. - Page 144 TX130M+_e-manual_D07-00-051P_RevD00 The Jitter Measurement submenu allows the user to measure and analyze received signal jitter. The measurements example is shown above (the vertical grid spacing is 2.0UIpp). Red Bar is Max. peaked jitter during testing and Yellow is the current peaked jitter.
-
Page 145: V.54
Press the Stop button to terminate the test. If Save TIE to USB is set to ON, then remove the USB memory stick from the test set, bring it to a computer, and open it with the VeEX Wander Analysis PC software, for further MTIE, TDEV, and masks analysis (refer to the MTIE and TDEV Analysis section). -
Page 146: Ds1/3 Tools
TX130M+_e-manual_D07-00-051P_RevD00 22.0 DS1/3 Tools The DS1/3 Tools can be found on the main menu. Tap the DS1/3 Tools icon to display the shortcut screen shown below. E1 Jitter Measurement E3 Jitter Measurement DS1 Pulse Mask DS1 Loop Round Trip Delay DS1 Rx Data DS3 Pulse Mask DS3 FEAC... -
Page 147: Ds1 Loop
TX130M+_e-manual_D07-00-051P_RevD00 Go back to top Go back to ToC 22.2 DS1 Loop Tap the DS1 Loop icon to display the shortcut screen shown below. DS1 Loop DS1 Loop Menu Loopback Control: Tap the Loop Icon located at the top of the screen to select Up (Loop Up) or Down (Loop Down). Loop Up: 1. -
Page 148: Round Trip Delay
TX130M+_e-manual_D07-00-051P_RevD00 Transmits in-band and out-of-band DS1 loop In-band:CSU, NIU FAC1, NIU FAC2. Transmit: Select code transmitted for 5 seconds (nominal). ESF DFL (Out-of-band): Line, Payload, Network. Transmit: Selected code transmitted either continuously or a burst of n-messages (where n is selectable in the range 1 to 15). Go back to top Go back to ToC 22.3 Round Trip Delay The Round Trip Delay (Propagation Delay) measurement works by sending a test pattern. -
Page 149: Ds3 Feac
TX130M+_e-manual_D07-00-051P_RevD00 - Left/Right button: To move the pulse mask to left or right direction, press the left or right button first and re-run the test. Go back to top Go back to ToC 22.6 DS3 FEAC DS3 FEAC responses (Far-End Alarm and Control Channel Responses): Enabling this option allows loop-back to be configured from any “far-end”... -
Page 150: Ds1 Vf
TX130M+_e-manual_D07-00-051P_RevD00 DS3 Equip. Failure(Service Affecting) DS3 LOS DS3 OOF DS3 AIS RCV DS3 IDLE RCV DS3 EQUIQ FAIL(NON-SERVICE AFFECT) COMMON EQUIP. FAIL (NSA) MULTIPLE DS1 LOS DS1 EQUIP FAIL SINGLE DS1 LOS DS1 EQUIP FAIL(NON-SERVICE AFFECT) LOOP TYPE: Options: NIU, LINE DS3 FEAC Tasks (Page 1) DS3 FEAC Tasks (Page 2) Go back to top Go back to ToC... -
Page 151: Jitter Measurement
TX130M+_e-manual_D07-00-051P_RevD00 Note Do not attempt to enter VF Tasks if the Frame LED is not green. Green LEDs indicate that the framing found on the received signal matches the framing selected in the Setup screen. It is impossible to talk, listen, or perform other channelized functions in the absence of frame synchronization, since channels can be identified only within a framed signal. - Page 152 TX130M+_e-manual_D07-00-051P_RevD00 The Jitter Measurement submenu allows the user to measure and analyze received signal jitter. The measurements example is shown above (the vertical grid spacing is 2.0UIpp). Red Bar is Max. peaked jitter during testing and Yellow is the current peaked jitter.
-
Page 153: Profiles
TX130M+_e-manual_D07-00-051P_RevD00 23.0 Profiles Profiles can be created in any application that has a 'Profiles' pull-down menu available. The PDH & DS1/3 applications all have the ability to save profiles. Profiles can be viewed and loaded in the Profiles folder located in the Files folder structure. Profile Menu To save a new profile from the PDH &... -
Page 154: Additional Tests
TX130M+_e-manual_D07-00-051P_RevD00 24.0 Additional Tests - Menu B ISDN PRI CALL Setup Signal Call-Voice Setup Call - Data Setup Data Call BERT Results Supplementary Service Scan Multi Call DTMF DBackup ISDN PRI MONITOR Clock Wander Analysis Setup Results 1PPS Phase Analysis Setup Result Go back to top Go back to ToC... - Page 155 TX130M+_e-manual_D07-00-051P_RevD00 AT&T relates to the 5ESS switch NTI relates to the Northern Telecom DMS-100 switch ETSI is the ETSI standard Channel Config: 23B+D, 46B+2D, 47B+D, or 23Bx2 in T1; Single/Dual PRI in E1. D Channel: Designates the time slot to transmit D Channel messages. The D Channel decoder helps to verify that a call is successfully established, or determine why a call was not completed by examining the protocol cause values.
-
Page 156: Call - Voice Setup
TX130M+_e-manual_D07-00-051P_RevD00 master clock. Termination: Terminated, Monitor, or Bridge. DS1 Framing: SF or ESF. Unused: AIS or Idle. PRI Call Signal Main Setup Connect to the CPE or Network Connect headsets to the mini USB port Select Call Control protocol type Select the emulation type (Should be TE on the other NT) Go back to top Go back to ToC 24.1.3 Call - Voice Setup... - Page 157 TX130M+_e-manual_D07-00-051P_RevD00 Trace: ISDN Protocol Decode Trace Trace Details D Channel Decodes help to verify that a call is successfully established, or determine why a call was not completed by examining the protocol messages. The user can monitor layer 2 (Q.921) and layer 3 (Q.931) messages on the D Channel in both terminate and monitor modes.
-
Page 158: Data Call Bert Results (Result)
TX130M+_e-manual_D07-00-051P_RevD00 Call - Data Setup Pattern tab Press Call and the other unit should ring. Go back to top Go back to ToC 24.1.5 Data Call BERT Results (Result) After successfully placing a data call, the BER is available. Pressing the Result screen presents the measurement parameters specified in G.821. -
Page 159: Multi Call
TX130M+_e-manual_D07-00-051P_RevD00 Call - Data Setup Pattern tab SubAddress Type: NSAP to select the Network Service Access Point subaddress User to use a subaddress defined by a user (no standard applied) When the test is finished, the screen displays a list of these services: CLIP: Calling Line Identification Presentation presents the Calling Party Number to the called user. - Page 160 TX130M+_e-manual_D07-00-051P_RevD00 Multi Call by Single Call Number. Multi Call Map L1 Multi Call Result ISDN Phone Number List Using Reveal MTX...
-
Page 161: Dtmf
TX130M+_e-manual_D07-00-051P_RevD00 Alternatively, the user can prepare a Multi Call list using ReVeal MTX software and upload the list to the test set. Go back to top Go back to ToC 24.1.8 DTMF During the call DTMF tones can be transmitted. To transmit DTMF tones, access the DTMF tab. -
Page 162: Isdn Pri Monitor
TX130M+_e-manual_D07-00-051P_RevD00 Go back to top Go back to ToC 24.2 ISDN PRI Monitor ISDN PRI Monitor PRI Monitor Action Menu The ISDN PRI Monitor's setup and results resemble those found in ISDN PRI Call. Please refer to 24.1 ISDN PRI Call for more information on these respective sections: 24.1.1 Setup (PRI Call Setup) -
Page 163: Reference Clock Wander Analysis
TX130M+_e-manual_D07-00-051P_RevD00 Please consult the factory. Go back to top Go back to ToC 24.4 Reference Clock Wander Analysis This advanced synchronization tool allows users to compare different types of Reference Clock sources and measure phase differences (TIE) to establish accuracy and stability. It is a generic wander measurements analysis option that provides a flexible function that allows testing different types of reference clocks against other reference clocks, including test rates (G.703), analog (sinosoidal), and digital (TTL) signals. -
Page 164: Results
If Save TIE to USB is set to ON, then remove the USB memory stick from the test set, bring it to a computer, and open it with the VeEX Wander Analysis PC software, for further MTIE, TDEV, and masks analysis (refer to the MTIE and TDEV Analysis section). -
Page 165: Setup
TX130M+_e-manual_D07-00-051P_RevD00 Absolute Phase differences between Core Network and edge nodes, or between edge nodes, create timing problems. LTE TTD: Maximum time error allowed at the NodeB is ±1.5µs Maximum time error allowed between adjacent NodeB is ±3µs A portable GPS-disciplined Clock is usually the reference used at the NodeB to compare the standard second against the 1PPS recovered by the PTP clock Translator (e.g. - Page 166 TX130M+_e-manual_D07-00-051P_RevD00 Graph The Graph tab shows the phase variation between the 1PPS under test compared to the 1PPS reference for the last 200 seconds for a quick visual verification of accuracy and stability. Vertical Scales: ±1µs, ±10µs, ±100µs, ±500µs Horizontal Scale: 200s (50s/div) 1PPS Phase Analysis - Graph Go back to top Go back to ToC...
-
Page 167: Mtie And Tdev Analysis
TX130M+_e-manual_D07-00-051P_RevD00 25.0 MTIE and TDEV Analysis Overview Install software Move TIE Data to a PC View Data MTIE & TDEV Masks Wander Analysis Report Go back to top Go back to ToC Overview The TX130M+ test set comes with a MTIE / TDEV Post-Analysis PC software. The software compatible with Windows 7, Vista, and XP offers Simple and intuitive GUI Fast processing of TIE data into MTIE and TDEV analysis... -
Page 168: Mtie & Tdev Masks
Go back to top Go back to ToC 25.4 MTIE & TDEV Masks VeEX’s Wander Analysis PC tool includes the most common wander masks. After the MTIE and TDEV Analysis is done, select the masks that fit the requirements. Selected masks are drawn and a PASS / FAIL assessment is displayed. Users can switch between different applicable masks to... - Page 169 TX130M+_e-manual_D07-00-051P_RevD00 Final Wander Assessment Selected masks are drawn and a PASS / FAIL assessment is displayed. Users can switch between different applicable masks to compare. Adding New Wander Masks: If the required masks are not listed, new ones can be added. MTIE and TDEV masks are defined in plain text and with a simple notation.
-
Page 170: Wander Analysis Report
End of file Go back to top Go back to ToC 25.5 Wander Analysis Report VeEX’s Wander Analysis PC tool allows users to create concise PDF reports. The report consists of the following: TIE graph MTIE, TDEV graphs Selected masks... - Page 171 TX130M+_e-manual_D07-00-051P_RevD00 Go back to top Go back to ToC...
-
Page 172: Warranty And Software
Replace hardware which proves to be defective provided that the products that the customer elects to replace is returned to VeEX Inc by the customer along with proof of purchase within thirty (30) days of the request by the customer, freight prepaid. -
Page 173: Product Specification
TX130M+_e-manual_D07-00-051P_RevD00 27.0 Product Specifications The TX130M+ product specifications are available in pdf format by clicking the link or specification sheet below. Please note you will need Adobe Reader version 9.0 or higher to open and view the file. To get the latest free version of Adobe Reader, click here. -
Page 174: Certification And Declaration
European Directives. To permit the use of a CE mark on a product, proof that the item meets the relevant requirements must be documented. For a copy of the CE Declaration of Conformity relating to VeEX products, please contact VeEX customer service. -
Page 175: About Veex
TX130M+_e-manual_D07-00-051P_RevD00 29.0 About VeEX VeEX (Verification EXperts), is an innovative designer and manufacturer of test and measurement solutions addressing numerous technologies. Global presence through a worldwide distribution channel provides uncompromised product and technical support. Visit us online at www.veexinc.com for latest updates and additional documentation.
Need help?
Do you have a question about the VePal TX130M+ and is the answer not in the manual?
Questions and answers