VeEX VePAL TX300 Quick Reference Manual
Ds3 monitor
Hide thumbs
Also See for VePAL TX300:
- User manual (421 pages) ,
- Quick reference manual (16 pages) ,
- Quick reference manual (12 pages)
Advertisement
Quick Links
Advertisement

Related Manuals for VeEX VePAL TX300


Summary of Contents for VeEX VePAL TX300
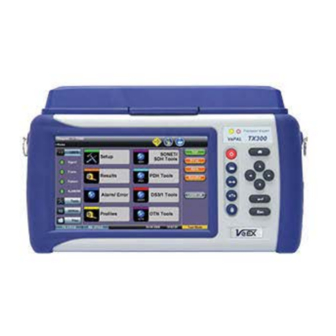
- Page 1 DS3 MONITOR VePAL TX300 T he Veri fication E xper ts...
- Page 2 DS3 MONITOR VePAL TX300 Quick Reference Guide TX300 Test Set...
- Page 3 DS3 MONITOR VePAL TX300 Quick Reference Guide Home Menu The Home menu can be accessed at anytime during operation by pressing the Home key on the rubber keypad. The screen is divided into three presentation areas: LEDs: Displays soft LEDs associated with Errors...
- Page 4 DS3 MONITOR VePAL TX300 Quick Reference Guide DS3 Home Allows the user to set up the DS3 interfaces and associated test parameters prior to running a test. DS3 Home Menu Setup – configure Interface, Measurement and General settings; Framing, Line...
- Page 5 DS3 MONITOR VePAL TX300 Quick Reference Guide Configuration (Single DS3) 1. Connect to the DS3 test interface using the BNC connectors 2. Power on the unit 3. From the DS3 Home menu, tap on the DS3 Monitor menu 4. Configure the Measurements and General settings...
- Page 6 DS3 MONITOR VePAL TX300 Quick Reference Guide Configuration (cont’d) 6. Select the Mode. DS3/45M-Muxed DS1/1.5M: search DS3 and selected DS1 channel check DS3/45M: Only search AUTO: search DS3 then first DS1 channel 7. Press Start - Searching for Line Code, Framing, Contained DS1 if present, and Test Pattern in Rx DS3 signal.
- Page 7 DS3 MONITOR VePAL TX300 Quick Reference Guide Configuration (Dual DS3) 8. Configure the Dual DS3 Monitor mode − Set the Dual: ON − Set the Termination for sensitivity of receiving signal. Dual: ON, for Dual DS3 Monitor Termination: High, DSX,...
- Page 8 DS3 MONITOR VePAL TX300 Quick Reference Guide Results 10. Once the OK button is pressed, the screen automatically moves to the Results, Summary screen. − Results can be viewed by selecting the following tabs: Summary, Analysis, Errors/Alarms, Histogram, Graph, Signal, and Event Log Summary screen: Provides an overview of any alarms, errors or signal failures.
- Page 9 DS3 MONITOR VePAL TX300 Quick Reference Guide Results (cont’d) Errors/Alarms screen: The soft LEDs on screen are arranged logically and depend on signal hierarchy, structure, payload and framing selected. The soft LEDs have a tri-color function. Green: No error or...
- Page 10 DS3 MONITOR VePAL TX300 Quick Reference Guide Results (cont’d) Signal screen: Tap the Signal tab to bring up the Frequency and Level results. FREQUENCY – the received signal frequency and offset is measured and displayed. − 45M current: Indicates the frequency of the input signal −...
- Page 11 DS3 MONITOR VePAL TX300 Quick Reference Guide Results (cont’d) Event Log screen: Tap the Event Log tab to display a listing of the Error and Alarm events recorded during a test. EVENTS – presented in chronological sequence - number, type of event, start time and duration, duration (alarms) and ratio/count (errors) are displayed.
- Page 12 51MHz! © 2011 VeEX Inc. All rights reserved. VeEX Inc. VeEX is a registered trademark of VeEX Inc. The 2827 Lakeview Court information contained in this document is accurate. Fremont, CA 94538 USA However, we reserve the right to change any Tel: +1.510.651.0500...
Need help?
Do you have a question about the VePAL TX300 and is the answer not in the manual?
Questions and answers