Agilent Technologies 1260 Infinity User Manual
Fluorescence detector
Hide thumbs
Also See for 1260 Infinity:
- User manual (282 pages) ,
- Service manual (108 pages) ,
- Quick start manual (98 pages)
Table of Contents
Advertisement
Quick Links
Advertisement
Chapters
Table of Contents

Related Manuals for Agilent Technologies 1260 Infinity


Summary of Contents for Agilent Technologies 1260 Infinity
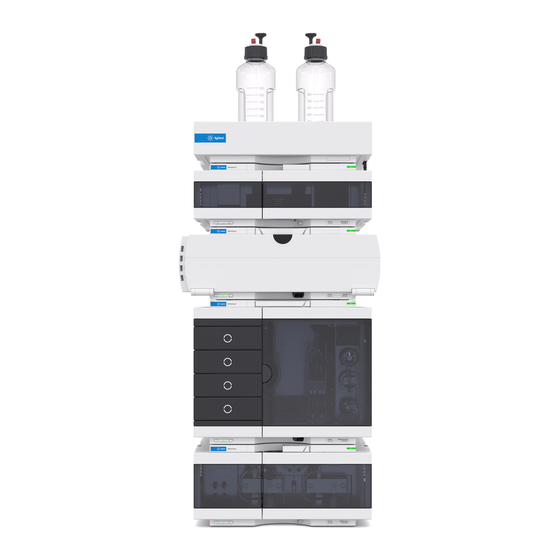
- Page 1 Agilent 1260 Infinity Fluorescence Detector User Manual Agilent Technologies...
- Page 2 Notices Warranty © Agilent Technologies, Inc. 2010 receive no greater than Restricted Rights as defined in FAR 52.227-19(c)(1-2) (June No part of this manual may be reproduced The material contained in this docu- 1987). U.S. Government users will receive in any form or by any means (including elec- ment is provided “as is,”...
- Page 3 In This Guide In This Guide This manual covers the Agilent 1260 Infinity Fluorescence Detector (G1321B). 1 Introduction to the Fluorescence Detector This chapter gives an introduction to the detector, instrument overview and internal connectors. 2 Site Requirements and Specifications This chapter provides information on environmental requirements, physical and performance specifications.
- Page 4 In This Guide 8 Test Functions This chapter describes the detector’s built in test functions. 9 Maintenance This chapter provides general information on maintenance of the detector. 10 Parts for Maintenance This chapter provides information on parts for maintenance. 11 Identifying Cables This chapter provides information on cables used with the 1290 series of HPLC modules.
-
Page 5: Table Of Contents
Contents Contents 1 Introduction to the Fluorescence Detector Introduction to the Detector How the Detector Operates Raman Effect Optical Unit Analytical Information From Primary Data Early Maintenance Feedback Instrument Layout Electrical Connections Interfaces Setting the 8-bit Configuration Switch 2 Site Requirements and Specifications Site Requirements Physical Specifications Performance Specifications... - Page 6 Contents 5 Optimizing the Detector Optimization Overview Design Features Help Optimization Finding the Best Wavelengths Finding the Best Signal Amplification Changing the Xenon Flash Lamp Frequency Selecting the Best Response Time Reducing Stray Light 6 Troubleshooting and Diagnostics Overview of the Module’s Indicators and Test Functions Status Indicators User Interfaces Agilent Lab Advisor Software...
- Page 7 External Contact Cable Agilent Module to PC 12 Appendix General Safety Information The Waste Electrical and Electronic Equipment (WEEE) Directive (2002/96/EC) Lithium Batteries Information Radio Interference Sound Emission UV-Radiation (UV-lamps only) Solvent Information Agilent Technologies on Internet Agilent 1260 FLD User Manual...
- Page 8 Contents Agilent 1260 FLD User Manual...
-
Page 9: Introduction To The Fluorescence Detector
Early Maintenance Feedback Instrument Layout Electrical Connections Serial Number Information Electrical Connections Interfaces Overview Interfaces Setting the 8-bit Configuration Switch Communication Settings for RS-232C Special Settings This chapter gives an introduction to the detector, instrument overview and internal connectors. Agilent Technologies... -
Page 10: Introduction To The Detector
• optional cuvette is available and can be used for off-line measurements • easy front access to flow cell for fast replacement and • built-in wavelength accuracy verification. For specifications, see “Performance Specifications” on page 50 Figure 1 The Agilent 1260 Infinity Fluorescence Detector Agilent 1260 FLD User Manual... -
Page 11: How The Detector Operates
Introduction to the Fluorescence Detector How the Detector Operates How the Detector Operates Luminescence Detection Luminescence, the emission of light, occurs when molecules change from an excited state to their ground state. Molecules can be excited by different forms of energy, each with its own excitation process. For example, when the excitation energy is light, the process is called photoluminescence. - Page 12 Introduction to the Fluorescence Detector How the Detector Operates When a more complex molecule transforms from its ground energy state into an excited state, the absorbed energy is distributed into various vibrational and rotational sub-levels. When this, same molecule returns to the ground state, this vibrational and rotational energy is first lost by relaxation without any radiation.
- Page 13 Introduction to the Fluorescence Detector How the Detector Operates Figure 4 Phosphorescence Energy Transitions The molecule must change its spin back again before it can return to its ground state. Since the chance of colliding with another molecule with the necessary spin for change is slight, the molecule remains in its triplet state for some time.
-
Page 14: Raman Effect
Introduction to the Fluorescence Detector Raman Effect Raman Effect The Raman effect arises when the incident light excites molecules in the sample which subsequently scatter the light. While most of this scattered light is at the same wavelength as the incident light, some is scattered at a different wavelength. -
Page 15: Optical Unit
Introduction to the Fluorescence Detector Optical Unit Optical Unit All the elements of the optical system, shown in Figure 6 on page 16, including Xenon flash lamp, excitation condenser, excitation slit, mirror, excitation grating, flow cell, emission condenser, cut-off filter, emission slit, emission grating and photo-multiplier tube are housed in the metal casting inside the detector compartment. - Page 16 Introduction to the Fluorescence Detector Optical Unit Figure 6 Optical Unit The radiation source is a xenon flash-lamp. The 3 µs flash produces a continuous spectrum of light from 200 nm to 900 nm. The light output distribution can be expressed as a percentage in 100 nm intervals, see Figure 7 on page 17.
- Page 17 Introduction to the Fluorescence Detector Optical Unit UV degradation, especially below 250 nm is significantly higher compared to Visible wavelength range. Generally the "LAMP ON during run" - setting or using "economy mode" will increase lamp life by a magnitude. Figure 7 Lamp Energy Distribution (vendor data) The radiation emitted by the lamp is dispersed and reflected by the excitation...
- Page 18 Introduction to the Fluorescence Detector Optical Unit Figure 8 Mirror Assembly The geometry of the grooves is optimized to reflect almost all of the incident light, in the 1 order and disperse it with about 70 % efficiency in the ultra-violet range.
- Page 19 Introduction to the Fluorescence Detector Optical Unit Figure 9 Dispersion of Light by a Grating The grating is turned using a 3-phase brushless DC motor, the position of the grating determining the wavelength or wavelength range of the light falling onto the flow cell.
- Page 20 Introduction to the Fluorescence Detector Optical Unit The flow cell is a solid quartz body with a maximum back pressure of 20 bar. Excessive back pressure will result in destruction of the cell. Operating the detector close to waste with low back pressure is recommended. A slit is integrated to the quartz body.
- Page 21 Introduction to the Fluorescence Detector Optical Unit On the photocathode, Figure 11 on page 21, incident photons generate electrons. These electrons are accelerated by an electrical field between several arc-shaped dynodes. Depending on the voltage difference between any pair of dynodes, an incident electron may spark-off further electrons which accelerate onto the next dynode.
- Page 22 Introduction to the Fluorescence Detector Optical Unit Reference System A reference diode, located behind the flow cell, measures the excitation (EX) light transmitted by the flow cell and corrects flash lamp fluctuations and long-term intensity drift. Because of a non-linear output of the diode (depending on the EX-wavelength), the measured data are normalized.
-
Page 23: Analytical Information From Primary Data
Introduction to the Fluorescence Detector Analytical Information From Primary Data Analytical Information From Primary Data We now know how the primary data from your sample is acquired in the optical unit. But how can the data be used as information in analytical chemistry? Depending on the chemistry of your application, the luminescence measured by the fluorescence detector will have different characteristics. - Page 24 Introduction to the Fluorescence Detector Analytical Information From Primary Data Phosphorescence Detection An appropriate parameter set will be specified as soon as you chose the phosphorescence detection mode (special setpoints under FLD parameter settings). Figure 13 Measurement of Phosphorescence Processing of Raw Data If the lamp flashes at single wavelength and high-power, then the fluorescence data rate is 296 Hz.
- Page 25 Introduction to the Fluorescence Detector Analytical Information From Primary Data Figure 14 LAMP: Frequency of Flash, Fluorescence, and Phosphorescence You can improve the signal-to-noise characteristics by disabling the “economy” mode. Disabling the “economy” mode will shorten the lifetime of the lamp significantly. Consider N O T E lifetime saving by switching off the lamp after the run is completed.
- Page 26 Introduction to the Fluorescence Detector Analytical Information From Primary Data Figure 15 PMTGAIN: Amplification of Signal Check proposed PMTGAIN. Deviations of more than 2 PMT gains should be corrected in the method. Each PMTGAIN step is increased approximately by a factor of 2 (range 0 - 18). To optimize your amplification for the peak with the highest emission, raise the PMTGAIN setting until the best signal-to-noise is achieved.
- Page 27 Introduction to the Fluorescence Detector Analytical Information From Primary Data Figure 16 RESPONSETIME: Signal-to-Noise Ratio Agilent 1260 FLD User Manual...
-
Page 28: Early Maintenance Feedback
Introduction to the Fluorescence Detector Early Maintenance Feedback Early Maintenance Feedback Maintenance requires the exchange of components which are subject to wear or stress. Ideally, the frequency at which components are exchanged should be based on the intensity of usage of the module and the analytical conditions, and not on a predefined time interval. -
Page 29: Instrument Layout
Introduction to the Fluorescence Detector Instrument Layout Instrument Layout The industrial design of the module incorporates several innovative features. It uses Agilent’s E-PAC concept for the packaging of electronics and mechanical assemblies. This concept is based upon the use of expanded polypropylene (EPP) layers of foam plastic spacers in which the mechanical and electronic boards components of the module are placed. -
Page 30: Electrical Connections
There are no externally accessible fuses, because automatic electronic fuses are implemented in the power supply. Never use cables other than the ones supplied by Agilent Technologies to ensure proper N O T E functionality and compliance with safety or EMC regulations. - Page 31 00000 Serial number Figure 17 Rear View of Detector – Electrical Connections and Label The GPIB interface has been removed with the introduction of the 1260 Infinity modules. N O T E Agilent 1260 FLD User Manual...
-
Page 32: Interfaces
Introduction to the Fluorescence Detector Interfaces Interfaces The Agilent 1200 Infinity Series modules provide the following interfaces: Table 1 Agilent 1200 Infinity Series Interfaces Module LAN/BCD RS-232 Analog Special (optional) (on-board) Remote Pumps G1310B Iso Pump G1311B Quat Pump G1311C Quat Pump VL G1312B Bin Pump G1312C Bin Pump VL 1376A Cap Pump... - Page 33 Introduction to the Fluorescence Detector Interfaces Table 1 Agilent 1200 Infinity Series Interfaces Module LAN/BCD RS-232 Analog Special (optional) (on-board) Remote G4212A/B DAD G1315C DAD VL+ G1365C MWD G1315D DAD VL G1365D MWD VL G1321B FLD G1362A RID G4280A ELSD EXT Contact AUTOZERO Others...
- Page 34 Introduction to the Fluorescence Detector Interfaces Overview Interfaces The CAN is inter-module communication interface. It is a 2-wire serial bus system supporting high speed data communication and real-time requirement. The modules have either an interface slot for an LAN card (e.g. Agilent G1369A/B LAN Interface) or they have an on-board LAN interface (e.g.
- Page 35 Introduction to the Fluorescence Detector Interfaces The RS-232C is designed as DCE (data communication equipment) with a 9-pin male SUB-D type connector. The pins are defined as: Table 2 RS-232C Connection Table Direction Function Ground Figure 18 RS-232 Cable Analog Signal Output The analog signal output can be distributed to a recording device.
- Page 36 APG Remote The APG Remote connector may be used in combination with other analytical instruments from Agilent Technologies if you want to use features as common shut down, prepare, and so on. Remote control allows easy connection between single instruments or systems to ensure coordinated analysis with simple coupling requirements.
- Page 37 Introduction to the Fluorescence Detector Interfaces Table 3 Remote Signal Distribution Signal Description DGND Digital ground PREPARE (L) Request to prepare for analysis (for example, calibration, detector lamp on). Receiver is any module performing pre-analysis activities. START (L) Request to start run / timetable. Receiver is any module performing run-time controlled activities.
-
Page 38: Setting The 8-Bit Configuration Switch
Introduction to the Fluorescence Detector Setting the 8-bit Configuration Switch Setting the 8-bit Configuration Switch Setting the 8-bit Configuration Switch (On-Board LAN) The 8-bit configuration switch is located at the rear of the module. Switch settings provide configuration parameters for LAN, serial communication protocol and instrument specific initialization procedures. - Page 39 Introduction to the Fluorescence Detector Setting the 8-bit Configuration Switch Table 4 8-bit Configuration Switch (with on-board LAN) Mode Function SW 1 SW 2 SW 3 SW 4 SW 5 SW 6 SW 7 SW 8 Link Configuration Init Mode Selection Auto-negotiation 10 MBit, half-duplex 10 MBit, full-duplex...
- Page 40 • for boot/test modes DIPS 1+2 must be UP plus required mode Switch settings provide configuration parameters for GPIB address, serial communication protocol and instrument specific initialization procedures. With the introduction of the Agilent 1260 Infinity, all GPIB interfaces have been removed. N O T E The preferred communication is LAN.
- Page 41 Introduction to the Fluorescence Detector Setting the 8-bit Configuration Switch Table 5 8-bit Configuration Switch (without on-board LAN) Mode Select RS-232C Baudrate Data Parity Bits Reserved Reserved TEST/BOOT RSVD RSVD RSVD The LAN settings are done on the LAN Interface Card G1369A/B. Refer to the N O T E documentation provided with the card.
- Page 42 Introduction to the Fluorescence Detector Setting the 8-bit Configuration Switch Table 7 Baudrate Settings (without on-board LAN) Switches Baud Rate Switches Baud Rate 9600 9600 1200 14400 2400 19200 4800 38400 Table 8 Data Bit Settings (without on-board LAN) Switch 6 Data Word Size 7 Bit Communication 8 Bit Communication...
- Page 43 Introduction to the Fluorescence Detector Setting the 8-bit Configuration Switch Special Settings The special settings are required for specific actions (normally in a service case). The tables include both settings for modules – with on-board LAN and without on-board N O T E LAN.
- Page 44 Introduction to the Fluorescence Detector Setting the 8-bit Configuration Switch Table 11 Forced Cold Start Settings (without on-board LAN) Mode Select TEST/BOOT No LAN TEST/BOOT Agilent 1260 FLD User Manual...
-
Page 45: Site Requirements And Specifications
Agilent 1260 FLD User Manual Site Requirements and Specifications Site Requirements Physical Specifications Performance Specifications This chapter provides information on environmental requirements, physical and performance specifications. Agilent Technologies... -
Page 46: Site Requirements
Site Requirements and Specifications Site Requirements Site Requirements A suitable environment is important to ensure optimal performance of the instrument. Power Considerations The module power supply has wide ranging capability. It accepts any line voltage in the range described in Table 12 on page 49. - Page 47 Never operate your instrumentation from a power outlet that has no ground connection. ➔ Never use a power cord other than the Agilent Technologies power cord designed for your region. Use of unsupplied cables WA R N I N G Using cables not supplied by Agilent Technologies can lead to damage of the electronic components or personal injury.
- Page 48 Site Requirements and Specifications Site Requirements Beanch Space The module dimensions and weight (see Table 12 on page 49) allow you to place the module on almost any desk or laboratory bench. It needs an additional 2.5 cm (1.0 inches) of space on either side and approximately 8 cm (3.1 inches) in the rear for air circulation and electric connections.
-
Page 49: Physical Specifications
Site Requirements and Specifications Physical Specifications Physical Specifications Table 12 Physical Specifications Type Specification Comments Weight 11.5 kg (26 lbs) Dimensions (height × 140 x 345 × 435 mm (7 x 13.5 × 17 inches) width × depth) Line voltage 100 –... -
Page 50: Performance Specifications
Site Requirements and Specifications Performance Specifications Performance Specifications Table 13 Performance Specifications Agilent 1260 Infinity Fluorescence Detector Type Specification Comments Detection type Multi-signal fluorescence detector with rapid on-line scanning capabilities and spectral data analysis Performance Single wavelength operation: see note below this table Specifications •... - Page 51 Site Requirements and Specifications Performance Specifications Table 13 Performance Specifications Agilent 1260 Infinity Fluorescence Detector Type Specification Comments Timetable up to 4 signal wavelengths, response time, PMT programing: Gain, baseline behavior (append, free, zero), spectral parameters Spectrum acquisition: Excitation or Emission spectra Scan speed: 28 ms per datapoint (e.g.
- Page 52 Site Requirements and Specifications Performance Specifications Table 13 Performance Specifications Agilent 1260 Infinity Fluorescence Detector Type Specification Comments GLP features Early maintenance feedback (EMF) for continuous tracking of instrument usage in terms of lamp burn time with user-settable limits and feedback messages. Electronic records of maintenance and errors.
-
Page 53: Installing The Module
Unpacking the Module Optimizing the Stack Configuration One Stack Configuration Two Stack Configuration Installing the Module Flow Connections to the Module This chapter gives information about the preferred stack setup for your system and the installation of the module. Agilent Technologies... -
Page 54: Unpacking The Module
Unpacking the Module Damaged Packaging If the delivery packaging shows signs of external damage, please call your Agilent Technologies sales and service office immediately. Inform your service representative that the instrument may have been damaged during shipment. "Defective on arrival" problems C A U T I O N If there are signs of damage, please do not attempt to install the module. - Page 55 For parts identification please check the illustrated parts breakdown in “Parts for Maintenance” on page 197. Please report any missing or damaged parts to your local Agilent Technologies sales and service office. Table 14 Detector Checklist...
-
Page 56: Optimizing The Stack Configuration
Installing the Module Optimizing the Stack Configuration Optimizing the Stack Configuration If your module is part of a complete Agilent 1260 Infinity Liquid Chromatograph, you can ensure optimum performance by installing the following configurations. These configurations optimize the system flow path, ensuring minimum delay volume. -
Page 57: One Stack Configuration
Installing the Module Optimizing the Stack Configuration One Stack Configuration Agilent 1260 FLD User Manual... - Page 58 Installing the Module Optimizing the Stack Configuration Figure 21 Recommended Stack Configuration (Front View) Figure 22 Recommended Stack Configuration (Rear View) Agilent 1260 FLD User Manual...
-
Page 59: Two Stack Configuration
Installing the Module Optimizing the Stack Configuration Two Stack Configuration To avoid excessive height of the stack when the autosampler thermostat is added to the system it is recommended to form two stacks. Some users prefer the lower height of this arrangement even without the autosampler thermostat. - Page 60 Installing the Module Optimizing the Stack Configuration Figure 24 Recommended Two Stack Configuration for 1260 (Rear View) Agilent 1260 FLD User Manual...
-
Page 61: Installing The Module
Installing the Module Installing the Module Installing the Module Parts required Description Power cord For other cables see “Cable Overview” on page 204. Software required Agilent Data System and/or Instant Pilot G4208A. Preparations Locate bench space Provide power connections Unpack the detector Module is partially energized when switched off, as long as the power cord is WA R N I N G plugged in. - Page 62 Installing the Module Installing the Module 3 Ensure the line power switch at the front of the detector is OFF. Figure 25 Front View of Detector 4 Connect the power cable to the power connector at the rear of the detector. 5 Connect the CAN cable to other modules.
- Page 63 Installing the Module Installing the Module 9 Turn ON power by pushing the button at the lower left hand side of the detector. The status LED should be green. Figure 26 Rear View of Detector The detector is turned ON when the line power switch is pressed and the green indicator N O T E lamp is illuminated.
-
Page 64: Flow Connections To The Module
Installing the Module Flow Connections to the Module Flow Connections to the Module Tools required Two wrenches 1/4 – 5/16 inch for capillary connections Parts required Description G1321-68755 Accessory kit Preparations Detector is installed in the LC system. Toxic, flammable and hazardous solvents, samples and reagents WA R N I N G The handling of solvents, samples and reagents can hold health and safety risks. - Page 65 Installing the Module Flow Connections to the Module Press the release buttons and remove the front cover to Locate the flow cell. gain access to the flow cell area. Assemble the column detector capillary from the Assemble the waste tubing from the accessory kit. accessory kit.
- Page 66 Installing the Module Flow Connections to the Module Insert the flow cell and install the capillaries to the flow N O T E cell (top is outlet, bottom is inlet). The fluorescence detector should be the last module in the flow system. An additional detector should be installed before the fluorescence detector to prevent any overpressure to the quartz cell (maximum 20 bar).
- Page 67 Installing the Module Flow Connections to the Module Replace the front cover. The installation of the detector is now complete. The detector should be operated with the front cover in place to protect the flow cell area N O T E against strong drafts from the ouside.
- Page 68 Installing the Module Flow Connections to the Module Agilent 1260 FLD User Manual...
-
Page 69: Using The Fluorescence Detector
Step 1: Check the LC System for Impurities Step 2: Optimize Limits of Detection and Selectivity Step 3: Set up Routine Methods Example: Optimization for Multiple Compounds This chapter guides you how to start the work with the detector. Agilent Technologies... -
Page 70: Before You Start
Using the Fluorescence Detector Before You Start Before You Start Your normal LC grade solvents usually give good results most of the time. But experience shows that baseline noise can be higher (lower signal-to-noise ratio) when impurities are in the solvents. Flush your solvent delivery system for at least 15 minutes before checking sensitivity. -
Page 71: Getting Started And Checkout
Using the Fluorescence Detector Getting Started and Checkout Getting Started and Checkout This chapter describes the check out of the Agilent 1260 Infinity Fluorescence Detector using the Agilent isocratic checkout sample. Starting Your Detector When If you want to checkout the detector... -
Page 72: Setting The Chromatographic Conditions
Using the Fluorescence Detector Getting Started and Checkout Setting the Chromatographic Conditions 1 Set up the system with the following chromatographic conditions and wait until the baseline gets stable. Table 15 Chromatographic Conditions Mobile phases A = water = 35 % B = Acetonitrile = 65 % Column OSD-Hypersil column, 125 mm x 4 mm i.d. - Page 73 Using the Fluorescence Detector Getting Started and Checkout In this example additional excitation wavelenghts (B, C, D) are used. This will increase the scan time and may lower the performance. Figure 27 FLD Parameters 3 Start the run. The resulting chromatograms are shown below : Figure 28 Biphenyl Peak With Different Excitation Wavelengths The excitation maxima are around 250 nm.
-
Page 74: Observe The Maxima Via The Isoabsorbance Plot
Using the Fluorescence Detector Getting Started and Checkout Observe the Maxima via the Isoabsorbance Plot = 246 nm, λ 1 Load the data file (λ = 317 nm) and open the isoabsorbance plot. 2 The maximum λ will be found around 250 nm. Figure 29 Isoabsorbance Plot Agilent 1260 FLD User Manual... -
Page 75: Method Development
Thorough method development, including spectra acquisition, is fundamental to achieve good results. This chapter describes three different steps that can be taken with the Agilent 1260 Infinity Fluorescence Detector. Table 16 on page 75 gives an overview of how to benefit from the operation modes during these steps. -
Page 76: Step 1: Check The Lc System For Impurities
Using the Fluorescence Detector Method Development Step 1: Check the LC System for Impurities A critical issue in trace level fluorescence detection is to have an LC system free of fluorescent contamination. Most contaminants derive from impure solvents. Taking a fluorescence scan is a convenient way to check the quality of the solvent in a few minutes. - Page 77 Using the Fluorescence Detector Method Development Stray light acts in the same way as impurities in that it simulates background noise. In both cases, a higher noise level and therefore a higher limit of detection are obtained. This indicates that high sensitivity measurements should be done away from wavelength settings that have a high stray light background.
-
Page 78: Step 2: Optimize Limits Of Detection And Selectivity
Using the Fluorescence Detector Method Development Step 2: Optimize Limits of Detection and Selectivity To achieve optimum limits of detection and selectivity, analysts must find out about the fluorescent properties of the compounds of interest. Excitation and emission wavelengths can be selected for optimum limits of detection and best selectivity. - Page 79 This is done preferably with a manual FLD cuvette when pure compounds are available. Procedure II - Use two LC runs with the Agilent 1260 Infinity Fluorescence Detector to separate the compound mix under known conditions and acquire emission and excitation spectra separately.
- Page 80 Using the Fluorescence Detector Method Development Details for Figure 32 on page 81: All excitation and emission spectra of Quinidine (1 µg/ml) are shown in graphic. Fluorescence intensity is plotted vs excitation and emission wavelengths. Detector settings: step size 5 nm, PMT 12 , Response time 4 s Agilent 1260 FLD User Manual...
- Page 81 Using the Fluorescence Detector Method Development Figure 32 Characterization of a pure compound from a fluorescence scan Agilent 1260 FLD User Manual...
- Page 82 Using the Fluorescence Detector Method Development Procedure II - Take two LC runs with the FLD The conditions for the separation of organic compounds such as polyaromatic nuclear hydrocarbons (PNAs) are well described in various standard methods, including commonly used EPA and DIN methods. Achieving the best detection levels requires checking for the optimum excitation and emission wavelengths for all compounds.
- Page 83 Using the Fluorescence Detector Method Development Table 18 Conditions for Optimization of PNA analysis according to figures below Column Vydac, 2.1 x 200 mm, PNA, 5 µm Mobile phase A = water; B = acetonitrile (50 : 50) Gradient 3 minutes, 60% 14 minutes, 90% 22 minutes, 100% Flow rate...
- Page 84 Using the Fluorescence Detector Method Development This shows the isofluorescence plot of emission spectra for 15 PNAs (5 µg/ml) with a fixed excitation wavelength (260 nm). Figure 33 Optimization of the time-program for the emission wavelength Agilent 1260 FLD User Manual...
- Page 85 Using the Fluorescence Detector Method Development Figure 34 Optimization of the time-program for the excitation wavelength The obtained data are combined to setup the time-table for the excitation wavelength for best limit of detection and selectivity. The optimized switching events for this example are summarized in Table 19 on page 85.
- Page 86 Using the Fluorescence Detector Method Development Procedure III - Make a single run with a DAD/FLD combination For most organic compounds, UV-spectra from diode array detectors are nearly identical to fluorescence excitation spectra. Spectral differences are caused by specific detector characteristics such as spectral resolution or light sources.
- Page 87 Using the Fluorescence Detector Method Development This is an impurity of carbamates. The excitation spectrum in a second run shows the equivalence of UV-spectra and fluorescence excitation spectra. An excitation wavelength at 265 nm was used for taking the emission spectrum and an emission wavelength at 540 nm was used for taking...
- Page 88 Using the Fluorescence Detector Method Development The two upper traces are obtained using two different excitation wavelengths. The lower trace is a pure standard of the known impurities. Figure 36 Qualitive analysis of MBC (2-benzimidazole carbamic acid methylester) and impurities Table 20 Conditions for analysis of DAP and MBC according to figures above Column...
-
Page 89: Step 3: Set Up Routine Methods
Using the Fluorescence Detector Method Development Step 3: Set up Routine Methods In routine analysis, sample matrices can have a significant influence on retention times. For reliable results, sample preparation must be thorough to avoid interferences or LC methods must be rugged enough. With difficult matrices, simultaneous multi-wavelength detection offers more reliability than timetable-controlled wavelength switching. - Page 90 Using the Fluorescence Detector Method Development Table 21 Conditions for simultanoeus multi wavelength detection for PNA-analysis (see figure below) Column Vydac, 2.1 x 250 mm, PNA, 5 µm Mobile phase A = water; B = acetonitrile (50 : 50 ) Gradient 3 min, 60 % 14.5 min, 90 %...
- Page 91 Using the Fluorescence Detector Method Development The upper trace was received with traditional wavelength switching. Figure 37 Simultaneous multi wavelength detection for PNA-analysis Previously, only diode array detectors and mass spectrometric detectors could deliver spectral information on-line to confirm peak identity as assigned by retention time.
- Page 92 Using the Fluorescence Detector Method Development In addition, the purity of a peak can be investigated by comparing spectra obtained within a single peak. When a peak is calculated to be within the user-defined purity limits, the purity factor is the mean purity value of all spectra that are within the purity limits.
-
Page 93: Example: Optimization For Multiple Compounds
Using the Fluorescence Detector Example: Optimization for Multiple Compounds Example: Optimization for Multiple Compounds Example: Optimization for Multiple Compounds Using PNAs as a sample, this example uses the described scanning functions. Agilent 1260 FLD User Manual... - Page 94 Using the Fluorescence Detector Example: Optimization for Multiple Compounds Setting the Chromatographic Conditions This example uses the following chromatographic conditions (the detector settings are shown in Figure 38 on page 95). Table 23 Chromatographic Conditions Mobile phases A = water = 50 % B = Acetonitrile = 50 % Column Vydac-C18-PNA, 250 mm x 2.1 mm i.d.
- Page 95 Using the Fluorescence Detector Example: Optimization for Multiple Compounds Select a Excitation wavelength in the low UV (230...260 nm). This will cover nearly all fluorescence in your sample. DO NOT select additional emission wavelengths (B, C, D). Doing so will increase the scan time and will lower the performance.
- Page 96 Using the Fluorescence Detector Example: Optimization for Multiple Compounds 2 Load the signal. (In this example just the time range of 13 min is displayed). Figure 39 Chromatogram from Emissions Scan Agilent 1260 FLD User Manual...
- Page 97 Using the Fluorescence Detector Example: Optimization for Multiple Compounds 3 Use the isoabsorbance plot and evaluate the optimal emission wavelengths, shown in the table below. Figure 40 Isoabsorbance Plot from Emission Scan Table 24 Peak # Time Emission Wavelength 5.3 min 330 nm 7.2 min 330 nm...
- Page 98 Using the Fluorescence Detector Example: Optimization for Multiple Compounds 4 Using the settings and the timetable (from previous page), do a second run for the evaluation of the optimal excitation wavelength. See Figure 41 page 98. DO NOT select additional excitation wavelengths (B, C, D).
- Page 99 Using the Fluorescence Detector Example: Optimization for Multiple Compounds 6 Load the signal. Figure 42 Chromatogram - Excitation Scan at Reference Wavelength 260/330 nm 7 Use the isoabsorbance plot and evaluate the optimal excitation wavelengths (in this example just in the time range of 13 minutes). Figure 43 Isoabsorbance Plot - Excitation The table below shows the complete information about emission (from...
- Page 100 Using the Fluorescence Detector Example: Optimization for Multiple Compounds Table 25 Peak # Time Emission Wavelength Excitation Wavelength 5.3 min 330 nm 220 / 280 nm 7.3 min 330 nm 225 / 285 nm 7.7 min 310 nm 265 nm 8.5 min 360 nm 245 nm...
- Page 101 Using the Fluorescence Detector Example: Optimization for Multiple Compounds Evaluating The System Background The example below uses water. 1 Pump solvent through your system. 2 Set the fluorescence scan range under FLD special setpoints according to your needs. The scan time will increase when the range is enlarged. With the default values, the scan N O T E takes about 2 minutes.
- Page 102 Using the Fluorescence Detector Example: Optimization for Multiple Compounds 4 Define a data file name and take a fluorescence scan. After the scan is completed, the isoabsorbance scan results appear, see Figure 45 page 102. A low background will improve the signal-to-noise, see also “Reducing Stray Light”...
-
Page 103: Optimizing The Detector
Finding the Best Signal Amplification FLD Scaling Range and Operating Conditions Changing the Xenon Flash Lamp Frequency Lamp Life Savings Selecting the Best Response Time Reducing Stray Light This chapter provides information on how to optimize the detector. Agilent Technologies... -
Page 104: Optimization Overview
Optimizing the Detector Optimization Overview Optimization Overview 1 Setting the right PMT value For most applications a setting of 10 is adequate (see “Finding the Best Signal Amplification” on page 109). The FLD A/D converter exhibits a large linear range making PMT switching unnecessary for most applications. For example, if at high concentrations a peak is cut off;... - Page 105 Optimizing the Detector Optimization Overview 4 Evaluating fluorescence spectra In contrast to diode array based UV detectors where UV spectra are evaluated by taking a spectrum at the peak maximum and selecting a reference spectrum at the baseline, correct fluorescence spectra are obtained by selecting a peak maximum spectrum and a reference around the inflection points.
-
Page 106: Design Features Help Optimization
Check Performance Before You Start Before you start you should check that your detector is performing according to the specifications published by Agilent Technologies. Your normal LC grade solvents may give good results most of the time but our experience shows that baseline noise can be higher with LC grade solvents than with fluorescence grade solvents. -
Page 107: Finding The Best Wavelengths
Optimizing the Detector Finding the Best Wavelengths Finding the Best Wavelengths The most important parameters to be optimized in fluorescence detection are the excitation and emission wavelengths. Generally, it is assumed that the best excitation wavelength can be taken from the excitation spectrum acquired on a spectrofluorimeter. -
Page 108: A Real Example
Optimizing the Detector Finding the Best Wavelengths A Real Example Although an excitation wavelength of 340 nm is quoted in the literature the module scan of orthophthalaldehyde, a derivative of the amino acid alanine, ( Figure 46 on page 108) shows a maximum between 220 nm and 240 nm. Figure 46 Scan Orthophthalaldehyde Derivative of Alanine When you are looking for the wavelength by scanning, scan over the whole... -
Page 109: Finding The Best Signal Amplification
Figure 47 on page 109 the PMTGAIN was gradually raised from 4 up to 11 (the peak is from the Agilent Technologies isocratic sample which was diluted 1000 times). With increasing PMTGAIN there was an improvement in signal-to-noise up to 10. Above 10 the noise increased proportionately to the signal with no improvement in signal-to-noise. -
Page 110: Fld Scaling Range And Operating Conditions
Optimizing the Detector Finding the Best Signal Amplification FLD Scaling Range and Operating Conditions FLD Scaling Range and Operating Conditions When using different FLD • The signal height of individual G1321 FLD modules may exceed the recommended signal range 0 – 100 LU. Under certain circumstances this could lead to clipped peaks. - Page 111 Optimizing the Detector Finding the Best Signal Amplification Figure 48 PMT Gain Behavior In this example the maximum output is around 220 LU and further increase of the PMT (above 9) results in a signal overload (clipping) and drop of signal to noise value.
- Page 112 Optimizing the Detector Finding the Best Signal Amplification 2 Set your Luminescence Units in LU If you are not satisfied with the LU output level of the detector or if you want to align the output of multiple instruments with different output levels you can scale each instrument output.
- Page 113 Optimizing the Detector Finding the Best Signal Amplification Visualization of ADC Limits A new firmware (A.06.11) for the Fluorescence Detector G1321A/B has been released that includes a new feature, the "Visualization of ADC Limits". Up to firmware A.06.10, an "ADC overflow" was not visible in the chromatogram under certain method conditions.
- Page 114 Optimizing the Detector Finding the Best Signal Amplification Raw ADC counts The measured light intensity is limited by the max range of the ADC-converter. A filter smoothes the peak making it not clearly visible that the max intensity is reached. Also peak area and peak height are distorted which leads to poor linearity performance.
-
Page 115: Changing The Xenon Flash Lamp Frequency
Optimizing the Detector Changing the Xenon Flash Lamp Frequency Changing the Xenon Flash Lamp Frequency Modes The lamp flash frequency can be changed into the following modes: Table 26 Flash Lamp Modes Positioning 296 Hz (Standard), 560 V 63 mJ (18.8 W) 74 Hz (Economy), 560 V 63 mJ (4.7 W) Rotation (Multi Ex/Em) -
Page 116: Lamp Life Savings
Optimizing the Detector Changing the Xenon Flash Lamp Frequency Lamp Life Savings There are three ways to save lamp life: • switch to “lamp on during run” without loss of sensitivity. • switch to “economy” mode with a certain loss of sensitivity. •... -
Page 117: Selecting The Best Response Time
Optimizing the Detector Selecting the Best Response Time Selecting the Best Response Time Selecting the Best Response Time Data reduction using the RESPONSETIME function will increase your signal-to-noise ratio. For example, see Figure 50 on page 117. 1 sec Figure 50 Finding Best Response Time LC fluorescence detectors typically work with response times of 2 or 4 s. - Page 118 Optimizing the Detector Selecting the Best Response Time Figure 51 Separation of Peaks using Responsetime Agilent 1260 FLD User Manual...
- Page 119 Optimizing the Detector Selecting the Best Response Time Peakwidth Settings Do not use peak width shorter than necessary. N O T E Peakwidth enables you to select the peak width (response time) for your analysis. The peak width is defined as the width of a peak, in minutes, at half the peak height.
-
Page 120: Reducing Stray Light
Optimizing the Detector Reducing Stray Light Reducing Stray Light Cut-off filters are used to remove stray light and 2 order or higher stray light by allowing complete transmission above the cut-off and little or no transmission below the cut-off point. They are used between excitation and emission gratings, to prevent any stray excitation light from reaching the photomultiplier tube, when it is measuring emission. - Page 121 Optimizing the Detector Reducing Stray Light Figure 52 Reducing Stray Light Agilent 1260 FLD User Manual...
- Page 122 Optimizing the Detector Reducing Stray Light Agilent 1260 FLD User Manual...
-
Page 123: Troubleshooting And Diagnostics
Overview of the Module’s Indicators and Test Functions Status Indicators Power Supply Indicator Module Status Indicator User Interfaces Agilent Lab Advisor Software This chapter gives an overview about the troubleshooting and diagnostic features and the different user interfaces. Agilent Technologies... -
Page 124: Overview Of The Module's Indicators And Test Functions
Troubleshooting and Diagnostics Overview of the Module’s Indicators and Test Functions Overview of the Module’s Indicators and Test Functions Status Indicators The module is provided with two status indicators which indicate the operational state (prerun, run, and error states) of the module. The status indicators provide a quick visual check of the operation of the module. -
Page 125: Status Indicators
Troubleshooting and Diagnostics Status Indicators Status Indicators Two status indicators are located on the front of the module. The lower left indicates the power supply status, the upper right indicates the module status. Figure 53 Location of Status Indicators Power Supply Indicator The power supply indicator is integrated into the main power switch. -
Page 126: Module Status Indicator
Troubleshooting and Diagnostics Status Indicators Module Status Indicator The module status indicator indicates one of six possible module conditions: • When the status indicator is OFF (and power switch light is on), the module is in a prerun condition, and is ready to begin an analysis. •... -
Page 127: User Interfaces
Troubleshooting and Diagnostics User Interfaces User Interfaces Depending on the user interface the available tests vary. All test descriptions are based on the Agilent ChemStation as user interface. Some descriptions are only available in the Service Manual. Table 28 Test Functions avaible vs. User Interface Test ChemStation Instant Pilot G4208A... -
Page 128: Agilent Lab Advisor Software
Troubleshooting and Diagnostics Agilent Lab Advisor Software Agilent Lab Advisor Software The Agilent Lab Advisor software is a standalone product that can be used with or without data system. Agilent Lab Advisor software helps to manage the lab for high quality chromatographic results and can monitor in real time a single Agilent LC or all the Agilent GCs and LCs configured on the lab intranet. -
Page 129: Error Information
Flash Trigger Lost Wavelength Calibration Failed Wavelength Calibration Lost Flow Cell Removed No Peaks Motor Errors This chapter describes the meaning of error messages, and provides information on probable causes and suggested actions how to recover from error conditions. Agilent Technologies... -
Page 130: What Are Error Messages
Error Information What Are Error Messages What Are Error Messages Error messages are displayed in the user interface when an electronic, mechanical, or hydraulic (flow path) failure occurs which requires attention before the analysis can be continued (for example, repair, or exchange of consumables is necessary). -
Page 131: General Error Messages
Error Information General Error Messages General Error Messages General error messages are generic to all Agilent series HPLC modules and may show up on other modules as well. Timeout The timeout threshold was exceeded. Probable cause Suggested actions Check the logbook for the occurrence and The analysis was completed successfully, source of a not-ready condition. -
Page 132: Shut-Down
Error Information General Error Messages Shut-Down An external instrument has generated a shut-down signal on the remote line. The module continually monitors the remote input connectors for status signals. A LOW signal input on pin 4 of the remote connector generates the error message. -
Page 133: Remote Timeout
Error Information General Error Messages Remote Timeout A not-ready condition is still present on the remote input. When an analysis is started, the system expects all not-ready conditions (for example, a not-ready condition during detector balance) to switch to run conditions within one minute of starting the analysis. -
Page 134: Leak
Error Information General Error Messages Leak A leak was detected in the detector. The signals from the two temperature sensors (leak sensor and board-mounted temperature-compensation sensor) are used by the leak algorithm to determine whether a leak is present. When a leak occurs, the leak sensor is cooled by the solvent. -
Page 135: Leak Sensor Open
Error Information General Error Messages Leak Sensor Open The leak sensor in the module has failed (open circuit). The current through the leak sensor is dependent on temperature. A leak is detected when solvent cools the leak sensor, causing the leak-sensor current to change within defined limits. -
Page 136: Compensation Sensor Open
Error Information General Error Messages Compensation Sensor Open The ambient-compensation sensor (NTC) on the main board in the module has failed (open circuit). The resistance across the temperature compensation sensor (NTC) on the main board is dependent on ambient temperature. The change in resistance is used by the leak circuit to compensate for ambient temperature changes. -
Page 137: Fan Failed
Error Information General Error Messages Fan Failed The cooling fan in the module has failed. The hall sensor on the fan shaft is used by the main board to monitor the fan speed. If the fan speed falls below a certain limit for a certain length of time, the error message is generated. -
Page 138: Detector Error Messages
Error Information Detector Error Messages Detector Error Messages These errors are detector specific. Lamp Cover Open The lamp cover in the optical compartment has been removed. The lamp cannot be turned on while this message is on. Probable cause Suggested actions Please contact your Agilent service Lamp cover removed. -
Page 139: Adc Not Calibrated
Error Information Detector Error Messages ADC Not Calibrated The analog-to-digital converter located on the FLF board cannot calibrate. Probable cause Suggested actions Please contact your Agilent service Defective ADC or other FLF electronics. representative. A/D Overflow This message is not implemented in firmware revision A.03.66 and below. It indicates an overload situation of the A/D converter (sample signal). -
Page 140: Flash Lamp Current Overflow
Error Information Detector Error Messages Flash Lamp Current Overflow The lamp current of the xenon flash lamp is monitored constantly. If the current gets too high, an error is generated and the lamp is turned OFF. Probable cause Suggested actions Please contact your Agilent service Shortage of trigger pack assembly or representative. -
Page 141: Wavelength Calibration Failed
Error Information Detector Error Messages Wavelength Calibration Failed This message may show up during a wavelength calibration. If the expected deviation is larger than the specified wavelength accuracy, the “Wavelength Calibration Failed” message is displayed and the instrument stays in a Not Ready condition. -
Page 142: Flow Cell Removed
Error Information Detector Error Messages Flow Cell Removed The detector has an automatic cell recognition system. When the flow cell is removed, the lamp is turned off and a NOT READY condition exists. If the flow cell is removed during an analysis, a SHUT DOWN is generated. Probable cause Suggested actions Insert flow cell and turn on the lamp. -
Page 143: Motor Errors
Error Information Detector Error Messages Motor Errors Monochromator motor errors may show up duringthe initialization or during operation ofthe N O T E detector.There are individual messages for either the excitation or the emissionside.If an error occurs, do a lamp ignition. This will clear the errorand a re-initialization of the motors is performed. - Page 144 Error Information Detector Error Messages Encoder Index Not Found (EX 6707, EM 6708) During initialization of the detector, the excitation- and emission monochromator are activated and the encoder should generate an index. Probable cause Suggested actions Please contact your Agilent service Encoder defective.
- Page 145 Error Information Detector Error Messages Motor Position Not Found (EX 6711, EM 6712) When the wavelength is changed the monochromator should move to the new position. The position could not be found. Probable cause Suggested actions Please contact your Agilent service Defective monochromator assembly.
- Page 146 Error Information Detector Error Messages Motor Speed Unstable (EX 6717, EM 6718) For proper operation the monochromator gratings must run at a certain constant revolution. Probable cause Suggested actions Please contact your Agilent service Defective monochromator assembly. representative. Motor Encoder Index Wrong (EX 6717, EM 6718) The actual encoder pattern is checked against a known pattern.
-
Page 147: Test Functions
Procedure Using the Agilent LabAdvisor Wavelength Verification and Calibration Wavelength Accuracy Test Using the Agilent LabAdvisor Using the Agilent ChemStation (Manually) Wavelength Calibration Procedure D/A Converter (DAC) Test Test Failed Diagnostic Signals This chapter describes the detector’s built in test functions. Agilent Technologies... -
Page 148: Diagram Of Light Path
Test Functions Diagram of Light Path Diagram of Light Path The light path is shown in Figure 54 on page 148. Figure 54 Schematic of the Light Path Agilent 1260 FLD User Manual... -
Page 149: Lamp Intensity Test
Test Functions Lamp Intensity Test Lamp Intensity Test The intensity test scans an intensity spectrum via the reference diode (200 - 1200 nm in 1 nm steps) and stores it in a diagnosis buffer. The scan is displayed in a graphic window. There is no further evaluation of the test. Results of this test are stored as lamp history (date code, intensity). -
Page 150: Lamp Intensity History
Test Functions Lamp Intensity Test Lamp Intensity History Results of the lamp intensity test (if the last one is older than one week) are stored as lamp history (date code, intensity of four different wavelengths, 250 nm, 350 nm, 450 and 600 nm) in a buffer. The data/plot can be retrieved via the diagnostics and provides intensity data over a length of time. -
Page 151: Dark-Current Test
Test Functions Dark-Current Test Dark-Current Test The dark-current test measures the PMT signal with maximum and minimum gain while the lamp is OFF. It also reads the signal of the reference diode. The resulting values (two via reference diode and two from PMT) are shown in a table and checked against reasonable limits (see below) Figure 57 Dark-Current Test (Agilent LabAdvisor) -
Page 152: Test Failed
Test Functions Dark-Current Test Test Failed Probable cause Suggested actions Exchange the PMT. Defective PMT. Exchange the FLF board. Defective reference diode or A/D converter. Agilent 1260 FLD User Manual... -
Page 153: Excitation And Emission Grating Resistance History
Test Functions Excitation and Emission Grating Resistance History Excitation and Emission Grating Resistance History This test runs automatically when the instrument is turned on (not accessible as an external test). It provides the resistance history of the excitation and the emission grating drives. -
Page 154: Motor Error
Test Functions Excitation and Emission Grating Resistance History Motor Error Probable cause Suggested actions Exchange the monochromator assembly. Friction too high. Exchange the monochromator assembly. Defective monochromator assembly. Agilent 1260 FLD User Manual... -
Page 155: Raman Astm Signal-To-Noise Test
Test Functions Raman ASTM Signal-to-Noise Test Raman ASTM Signal-to-Noise Test These tests verify the Raman ASTM signal-to-noise for • single wavelength (at signal) (EX=350 nm, EM=397 nm) or • single wavelength (at background) (Ex=350 nm, Em=397 nm, dark value 450 nm) or •... - Page 156 Test Functions Raman ASTM Signal-to-Noise Test Table 30 Settings for Single Wavelength Specifications (at signal) Time Baseline Free 20.30 Free Table 31 Settings for Single Wavelength Specifications (at background) Time Baseline Free 20.30 Free Table 32 Settings for Dual Wavelength Specifications (Multi-EM Scan) Time EM_A EM_B Spectra From Step PMT Baseline...
- Page 157 Test Functions Raman ASTM Signal-to-Noise Test Formula for the Raman ASTM S/N value (see Figure 60 on page 157 for details): Figure 60 Raman ASTM signal/noise calculation Agilent 1260 FLD User Manual...
-
Page 158: Procedure Using An Agilent Labadvisor
Test Functions Raman ASTM Signal-to-Noise Test Procedure using an Agilent LabAdvisor 1 Set up the HPLC system and the LabAdvisor. 2 Flush the flow cell with clean bi-distilled water. 3 Start the test in the LabAdvisor. Figure 61 Raman ASTM Signal-to-Noise Test (Agilent LabAdvisor) Agilent 1260 FLD User Manual... - Page 159 Test Functions Raman ASTM Signal-to-Noise Test Figure 62 Raman ASTM Signal-to-Noise Test (Agilent LabAdvisor) In case of failing this test (as shown above) see “Interpretation of the Results” on page 161. Agilent 1260 FLD User Manual...
-
Page 160: Procedure Using An Agilent Chemstation
Test Functions Raman ASTM Signal-to-Noise Test Procedure using an Agilent ChemStation Procedure using an Agilent ChemStation The Agilent ChemStation should be used for the verification of the Dual Wavelength Check only. 1 Set up the HPLC system and the Agilent LabAdvisor. 2 Flush the flow cell with clean bi-distilled water. -
Page 161: Interpretation Of The Results
Test Functions Raman ASTM Signal-to-Noise Test Interpretation of the Results If the test shows low Raman values, check for: ✔ correctly positioned flow cell, ✔ clean flow cell (flush with clean bi-distilled water), ✔ no air bubble(s) (check via fluorescence scan or visual check of cell/cuvette), ✔... -
Page 162: Using The Built-In Test Chromatogram
Test Functions Using the Built-in Test Chromatogram Using the Built-in Test Chromatogram This function is available from the Agilent ChemStation, LabAdvisor and Instant Pilot. The built-in Test Chromatogram can be used to check the signal path from the detector to the data system and the data analysis or via the analog output to the integrator or data system. - Page 163 Test Functions Using the Built-in Test Chromatogram 6 To start a test chromatogram enter in the command line: STRT Figure 63 Test Chromatogram with Agilent LabAdvisor 7 To stop the test chromatogram enter in the command line: STOP The test chromatogram is switched off automatically at the end of a run. N O T E Agilent 1260 FLD User Manual...
-
Page 164: Wavelength Verification And Calibration
Test Functions Wavelength Verification and Calibration Wavelength Verification and Calibration The wavelength calibration is based on a Glycogen solution, which acts as a strong elastic light scatterer (refer to ASTM Test Method E388-72-1993 “Spectral Bandwidth and Wavelength Accuracy of Fluorescence Spectrometers”). - Page 165 Test Functions Wavelength Verification and Calibration The duration of the wavelength calibration is about 15 minutes plus setup time for the N O T E calibration sample and system. Depending on the maximum intensity found during this scan, the PMT gain will be changed automatically and requires an additional 1 minute per scan.
- Page 166 Test Functions Wavelength Verification and Calibration Table 34 Wavelength Calibration Steps Step Description Duration Preparation max 30 s Excitation rotation scan, full circle 60 s Excitation rotation scan, high resolution 44 s Excitation position scan, low resolution 55 s variable Excitation position scan, high resolution 260 s variable Emission rotation scan, full circle (# of scans depends on the required PMT gain, 1...
-
Page 167: Wavelength Accuracy Test
Test Functions Wavelength Accuracy Test Wavelength Accuracy Test Using the Agilent LabAdvisor 1 Set up the HPLC system and the Agilent LabAdvisor. 2 Flush the flow cell with clean bi-distilled water. 3 Turn on the FLD lamp. 4 Run the Wavelength Accuracy Test. 5 The FLD will change into the multi-excitation mode with emission wavelength at 397 nm and scan in the range of the expected maximum of 350 nm ±20 nm. - Page 168 Test Functions Wavelength Accuracy Test If the limits are not met, check for “Interpretation of the Results” on page 161 or perform N O T E “Wavelength Calibration Procedure” on page 173. The below figures show an example of a failed test. The excitation scan did not find a maximum (just an up-slope).
- Page 169 Test Functions Wavelength Accuracy Test Figure 67 Wavelength Accuracy Test (Agilent LabAdvisor) Agilent 1260 FLD User Manual...
-
Page 170: Using The Agilent Chemstation (Manually)
Test Functions Wavelength Accuracy Test Using the Agilent ChemStation (Manually) 1 Create the methods WLEMTEST and WLEXTEST as listed Table 35 page 170. Table 35 Method Settings Setting Check of EM WL 397 nm Check of EX WL 350 nm WLEMTEST WLEXTEST Peak Width... - Page 171 Test Functions Wavelength Accuracy Test Figure 69 Settings for EM / EX Scan Agilent 1260 FLD User Manual...
- Page 172 Test Functions Wavelength Accuracy Test 2 Load the method WLEXTEST. The FLD will change into the multi-emission mode and scan in the range of the expected maximum of 397 nm ±20 nm. 3 Start the pump and flush the cell with water for a few minutes to assure a clean flow cell.
-
Page 173: Wavelength Calibration Procedure
Test Functions Wavelength Calibration Procedure Wavelength Calibration Procedure When If application requires, or see Table 34 on page 166. Tools required Laboratory balance Parts required Description 5063-6597 Calibration Sample, Glycogen 9301-1446 Syringe 9301-0407 Needle 5061-3364 Filter regen Cellulose 30/45 luer 100/pk 0100-1516 Fitting male PEEK, 2/pk 1 Preparation of the Glycogen Calibration Sample. - Page 174 Test Functions Wavelength Calibration Procedure g Add the filter to the syringe and fit the needle to filter. Figure 70 Syringe with Sample Filter h Lift the needle tip and carefully eject approximately 0.5 ml to remove air out of the syringe and to flush the needle. i Add the PEEK fitting to the needle tip and fix both at the flow cell inlet.
- Page 175 Test Functions Wavelength Calibration Procedure b If a deviation is displayed, press Yes (LabAdvisor) to adjust to new values or Adjust and OK (ChemStation, see next page). The history table will be updated. Figure 71 Wavelength Calibration (Agilent LabAdvisor) Agilent 1260 FLD User Manual...
- Page 176 Test Functions Wavelength Calibration Procedure Figure 72 Calibration History (Agilent LabAdvisor) Figure 73 Wavelength Calibration (Agilent ChemStation) Agilent 1260 FLD User Manual...
- Page 177 Test Functions Wavelength Calibration Procedure To look at the history table (ChemStation) start a wavelength calibration and abort N O T E immediately. No changes are made to the calibration at this time. Rinse the flow cell with pure water at a minimum of 1.5 ml/min to get rid of the Glycogen N O T E from the cell and the capillaries.
-
Page 178: D/A Converter (Dac) Test
Test Functions D/A Converter (DAC) Test D/A Converter (DAC) Test The detector provides analog output of chromatographic signals for use with integrators, chart recorders or data systems. The analog signal is converted from the digital format by the digital-analog-converter (DAC). The DAC test is used to verify correct operation of the digital-analog-converter by applying a digital test signal to the DAC. -
Page 179: Test Failed
Test Functions D/A Converter (DAC) Test Figure 75 D/A Converter (DAC) Test – Example of Integrator Plot Running the Test with Instant Pilot The test can be started via the command line. 1 To start the test TEST: DAC 1 RA 00000 TEST:DAC 1 Reply: 2 To stop the test... -
Page 180: Diagnostic Signals
Test Functions Diagnostic Signals Diagnostic Signals The detector has several signals (internal temperatures, voltages and currents of lamps) that can be used for diagnosing problems. These can be • baseline problems deriving from lamp • wander / drift problems due to temperature changes Figure 76 Board Temperature (Agilent LabAdvisor) Agilent 1260 FLD User Manual... -
Page 181: Maintenance
Exchanging a Flow Cell How to use the Cuvette Flow Cell Flushing Correcting Leaks Replacing Leak Handling System Parts Replacing the Interface Board Replacing Module Firmware Tests and Calibrations This chapter provides general information on maintenance of the detector. Agilent Technologies... -
Page 182: Introduction To Maintenance
Maintenance Introduction to Maintenance Introduction to Maintenance The module is designed for easy maintenance. Maintenance can be done from the front with module in place in the system stack. There are no serviceable parts inside. N O T E Do not open the module. Agilent 1260 FLD User Manual... -
Page 183: Warnings And Cautions
Maintenance Warnings and Cautions Warnings and Cautions Toxic, flammable and hazardous solvents, samples and reagents WA R N I N G The handling of solvents, samples and reagents can hold health and safety risks. ➔ When working with these substances observe appropriate safety procedures (for example by wearing goggles, safety gloves and protective clothing) as described in the material handling and safety data sheet supplied by the vendor and follow good laboratory practice. - Page 184 Maintenance Warnings and Cautions Personal injury or damage to the product WA R N I N G Agilent is not responsible for any damages caused, in whole or in part, by improper use of the products, unauthorized alterations, adjustments or modifications to the products, failure to comply with procedures in Agilent product user guides, or use of the products in violation of applicable laws, rules or regulations.
-
Page 185: Overview Of Maintenance
Maintenance Overview of Maintenance Overview of Maintenance The following pages describe maintenance (simple repairs) of the detector that can be carried out without opening the main cover. Table 36 Simple Repairs Procedure Typical Frequency Notes Flow cell exchange If application requires a different flow cell type or if Complete Assembly defective. -
Page 186: Cleaning The Module
Maintenance Cleaning the Module Cleaning the Module The module case should be kept clean. Cleaning should be done with a soft cloth slightly dampened with water or a solution of water and mild detergent. Do not use an excessively damp cloth as liquid may drip into the module. Liquid dripping into the electronic compartment of your module. -
Page 187: Exchanging A Flow Cell
Maintenance Exchanging a Flow Cell Exchanging a Flow Cell When If an application needs a different type of flow cell or the flow cell is defective (leaky). Tools required Two 1/4 inch wrenches for capillary connections Parts required Description G1321-60005 Standard flow cell, 8 µL, 20 bar G1321-60007 FLD Cuvette Kit, 8 µL, 20 bar... - Page 188 Maintenance Exchanging a Flow Cell Unscrew the thumb screws and pull the flow cell out of N O T E the compartment. The label attached to the flow cell provides information on part number, cell volume and maximum pressure. The cell type will be automatically detected. There are no parts that can be replaced on the flow cell.
- Page 189 Maintenance Exchanging a Flow Cell Replace the front cover. N O T E To check for leaks, establish a flow and observe the flow cell (outside of the cell compartment) and all capillary connections. N O T E Perform a wavelength verification to check the correct positioning of the flow cell, as described in chapter “Wavelength Verification and Calibration”...
-
Page 190: How To Use The Cuvette
Maintenance How to use the Cuvette How to use the Cuvette The cuvette is used for off-line measurements (no flow system required) and is basically a standard flow cell with a few changes: • wide bore capillary connections for easier injections with a syringe •... -
Page 191: Flow Cell Flushing
Maintenance Flow Cell Flushing Flow Cell Flushing When If flow cell is contaminated Tools required Glass syringe, adapter Parts required Description Bidistilled water, nitric acid (65 %), tubings to waste Dangerous concentration of nitric acid WA R N I N G The nitric acid flushing procedure is not an infallible remedy for a dirty cell. -
Page 192: Correcting Leaks
Maintenance Correcting Leaks Correcting Leaks When If a leakage has occurred in the flow cell area or at the capillary connections Tools required Tissue Two 1/4 inch wrenches for capillary connections 1 Remove the front cover. 2 Use tissue to dry the leak sensor area and the leak pan. 3 Observe the capillary connections and the flow cell area for leaks and correct, if required. -
Page 193: Replacing Leak Handling System Parts
Maintenance Replacing Leak Handling System Parts Replacing Leak Handling System Parts When If the parts are corroded or broken Parts required Description 5041-8389 Leak funnel 5061-3356 Leak funnel holder 5042-9974 Leak tubing (1.5 m, 120 mm required) 1 Remove the front cover. 2 Pull the leak funnel out of the leak funnel holder. -
Page 194: Replacing The Interface Board
Maintenance Replacing the Interface Board Replacing the Interface Board When For all repairs inside the detector or for installation of the board Parts required Description G1351-68701 Interface board (BCD) with external contacts and BCD outputs G1369A or LAN Communication Interface board G1369-60001 1 To replace the interface board unscrew the two screws, remove the board, slide in the new interface board and fix it with the board’s screws. -
Page 195: Replacing Module Firmware
Maintenance Replacing Module Firmware Replacing Module Firmware When The installation of newer firmware might be necessary • if a newer version solves problems of older versions or • to keep all systems on the same (validated) revision. The installation of older firmware might be necessary •... -
Page 196: Tests And Calibrations
Maintenance Tests and Calibrations Tests and Calibrations The following tests are required after maintenance of lamps and flow cells: • “Lamp Intensity Test” on page 149. • “Wavelength Verification and Calibration” on page 164 Agilent 1260 FLD User Manual... -
Page 197: Parts For Maintenance
Agilent 1260 FLD User Manual Parts for Maintenance Overview of Maintenance Parts Cuvette Kit Accessory Kit This chapter provides information on parts for maintenance. Agilent Technologies... -
Page 198: Overview Of Maintenance Parts
Parts for Maintenance Overview of Maintenance Parts Overview of Maintenance Parts Description G4208-67001 Instant Pilot G4208A (requires firmware B.02.08 or above) G1321-60005 Standard flow cell, 8 µL, 20 bar G1321-60007 FLD Cuvette Kit, 8 µL, 20 bar 9301-0407 Needle 9301-1446 Syringe 5067-4691 Front Cover... -
Page 199: Cuvette Kit
Parts for Maintenance Cuvette Kit Cuvette Kit Description G1321-60007 FLD Cuvette Kit, 8 µL, 20 bar includes: 5062-2462 Teflon Tubing flexible i.d. 0.8 mm, o.d. 1.6 mm, 2 m, re-order 5 m (flow cell to waste) 79814-22406 SST Fitting 0100-0043 SST front ferrule 0100-0044 SST back ferrule... -
Page 200: Accessory Kit
Parts for Maintenance Accessory Kit Accessory Kit Accessory kit (p/n G1321-68755) contains some accessories and tools needed for the installation and repair/calibration of the detector. Item p/n Description 5062-2462 Teflon Tubing flexible i.d. 0.8 mm, o.d. 1.6 mm, 2 m, re-order 5 m (flow cell to waste) 0100-1516 Fitting male PEEK, 2/pk... - Page 201 Parts for Maintenance Accessory Kit Figure 80 Waste Tubing Parts This end is pre-installed Figure 81 Inlet Capillary (Column-Detector) Parts Agilent 1260 FLD User Manual...
- Page 202 Parts for Maintenance Accessory Kit Agilent 1260 FLD User Manual...
-
Page 203: Identifying Cables
Agilent 1260 FLD User Manual Identifying Cables Cable Overview Analog Cables Remote Cables BCD Cables CAN/LAN Cables External Contact Cable Agilent Module to PC This chapter provides information on cables used with the 1290 series of HPLC modules. Agilent Technologies... -
Page 204: Cable Overview
Identifying Cables Cable Overview Cable Overview Never use cables other than the ones supplied by Agilent Technologies to ensure proper N O T E functionality and compliance with safety or EMC regulations. Analog cables Description 35900-60750 Agilent module to 3394/6 integrators... - Page 205 Identifying Cables Cable Overview CAN cables Description 5181-1516 CAN cable, Agilent module to module, 0.5 m 5181-1519 CAN cable, Agilent module to module, 1 m LAN cables Description 5023-0203 Cross-over network cable, shielded, 3 m (for point to point connection) 5023-0202 Twisted pair network cable, shielded, 7 m (for point to point connection) RS-232 cables...
-
Page 206: Analog Cables
Identifying Cables Analog Cables Analog Cables One end of these cables provides a BNC connector to be connected to Agilent modules. The other end depends on the instrument to which connection is being made. Agilent Module to 3394/6 Integrators p/n 35900-60750 Pin 3394/6 Pin Agilent Signal Name... - Page 207 Identifying Cables Analog Cables Agilent Module to BNC Connector p/n 8120-1840 Pin BNC Pin Agilent Signal Name module Shield Shield Analog - Center Center Analog + Agilent Module to General Purpose p/n 01046-60105 Pin 3394/6 Pin Agilent Signal Name module Not connected Black Analog -...
-
Page 208: Remote Cables
Identifying Cables Remote Cables Remote Cables One end of these cables provides a Agilent Technologies APG (Analytical Products Group) remote connector to be connected to Agilent modules. The other end depends on the instrument to be connected to. Agilent Module to 3396A Integrators... - Page 209 Identifying Cables Remote Cables Agilent Module to 3396 Series III / 3395B Integrators p/n 03396-61010 Pin 33XX Pin Agilent Signal Name Active module (TTL) 1 - White Digital ground 2 - Brown Prepare run 3 - Gray Start 4 - Blue Shut down 5 - Pink Not connected...
- Page 210 Identifying Cables Remote Cables Agilent Module to General Purpose p/n 01046-60201 Pin Universal Pin Agilent Signal Name Active module (TTL) 1 - White Digital ground 2 - Brown Prepare run 3 - Gray Start 4 - Blue Shut down 5 - Pink Not connected 6 - Yellow Power on...
-
Page 211: Bcd Cables
Identifying Cables BCD Cables BCD Cables One end of these cables provides a 15-pin BCD connector to be connected to the Agilent modules. The other end depends on the instrument to be connected to Agilent Module to General Purpose p/n G1351-81600 Wire Color Pin Agilent Signal Name... - Page 212 Identifying Cables BCD Cables Agilent Module to 3396 Integrators p/n 03396-60560 Pin 3396 Pin Agilent Signal Name BCD Digit module BCD 5 BCD 7 BCD 6 BCD 4 BCD0 BCD 3 BCD 2 BCD 1 Digital ground + 5 V Agilent 1260 FLD User Manual...
-
Page 213: Can/Lan Cables
Identifying Cables CAN/LAN Cables CAN/LAN Cables Both ends of this cable provide a modular plug to be connected to Agilent modules CAN or LAN connectors. CAN Cables Description 5181-1516 CAN cable, Agilent module to module, 0.5 m 5181-1519 CAN cable, Agilent module to module, 1 m LAN Cables Description 5023-0203... -
Page 214: External Contact Cable
Identifying Cables External Contact Cable External Contact Cable One end of this cable provides a 15-pin plug to be connected to Agilent modules interface board. The other end is for general purpose. Agilent Module Interface Board to general purposes External contact cable - Color Pin Agilent Signal Name... -
Page 215: Agilent Module To Pc
Identifying Cables Agilent Module to PC Agilent Module to PC Description G1530-60600 RS-232 cable, 2 m RS232-61600 RS-232 cable, 2.5 m Instrument to PC, 9-to-9 pin (female). This cable has special pin-out, and is not compatible with connecting printers and plotters. It's also called "Null Modem Cable"... - Page 216 Identifying Cables Agilent Module to PC Agilent 1260 FLD User Manual...
-
Page 217: Appendix
Agilent 1260 FLD User Manual Appendix General Safety Information The Waste Electrical and Electronic Equipment (WEEE) Directive (2002/96/EC) Lithium Batteries Information Radio Interference Sound Emission UV-Radiation (UV-lamps only) Solvent Information Agilent Technologies on Internet This chapter provides safetey and other general information. Agilent Technologies... -
Page 218: General Safety Information
Appendix General Safety Information General Safety Information Safety Symbols Table 37 Safety Symbols Symbol Description The apparatus is marked with this symbol when the user should refer to the instruction manual in order to protect risk of harm to the operator and to protect the apparatus against damage. - Page 219 Appendix General Safety Information General Safety Information The following general safety precautions must be observed during all phases of operation, service, and repair of this instrument. Failure to comply with these precautions or with specific warnings elsewhere in this manual violates safety standards of design, manufacture, and intended use of the instrument.
- Page 220 Appendix General Safety Information Some adjustments described in the manual, are made with power supplied to the instrument, and protective covers removed. Energy available at many points may, if contacted, result in personal injury. Any adjustment, maintenance, and repair of the opened instrument under voltage should be avoided whenever possible.
-
Page 221: The Waste Electrical And Electronic Equipment (Weee) Directive (2002/96/Ec)
Appendix The Waste Electrical and Electronic Equipment (WEEE) Directive (2002/96/EC) The Waste Electrical and Electronic Equipment (WEEE) Directive (2002/96/EC) Abstract The Waste Electrical and Electronic Equipment (WEEE) Directive (2002/96/EC), adopted by EU Commission on 13 February 2003, is introducing producer responsibility on all Electric and Electronic appliances from 13 August 2005. -
Page 222: Lithium Batteries Information
Appendix Lithium Batteries Information Lithium Batteries Information Lithium batteries may not be disposed-off into the domestic waste. Transportation of WA R N I N G discharged Lithium batteries through carriers regulated by IATA/ICAO, ADR, RID, IMDG is not allowed. Danger of explosion if battery is incorrectly replaced. ➔... -
Page 223: Radio Interference
Appendix Radio Interference Radio Interference Cables supplied by Agilent Technologies are screened to provide optimized protection against radio interference. All cables are in compliance with safety or EMC regulations. Test and Measurement If test and measurement equipment is operated with unscreened cables, or... -
Page 224: Sound Emission
Appendix Sound Emission Sound Emission Manufacturer’s Declaration This statement is provided to comply with the requirements of the German Sound Emission Directive of 18 January 1991. This product has a sound pressure emission (at the operator position) < 70 dB. •... -
Page 225: Uv-Radiation (Uv-Lamps Only)
Appendix UV-Radiation (UV-lamps only) UV-Radiation (UV-lamps only) Emissions of ultraviolet radiation (200-315 nm) from this product is limited such that radiant exposure incident upon the unprotected skin or eye of operator or service personnel is limited to the following TLVs (Threshold Limit Values) according to the American Conference of Governmental Industrial Hygienists: Table 38... -
Page 226: Solvent Information
Appendix Solvent Information Solvent Information Flow Cell To protect optimal functionality of your flow-cell: • Avoid the use of alkaline solutions (pH > 9.5) which can attack quartz and thus impair the optical properties of the flow cell. • If the flow cell is transported while temperatures are below 5 °C, it must be assured that the cell is filled with alcohol. - Page 227 Appendix Solvent Information • Chromatographic grade ethers, which can contain peroxides (for example, THF, dioxane, di-isopropylether) such ethers should be filtered through dry aluminium oxide which adsorbs the peroxides, • Solvents containing strong complexing agents (e.g. EDTA), • Mixtures of carbon tetrachloride with 2-propanol or THF. Agilent 1260 FLD User Manual...
-
Page 228: Agilent Technologies On Internet
Appendix Agilent Technologies on Internet Agilent Technologies on Internet For the latest information on products and services visit our worldwide web site on the Internet at: http://www.agilent.com Select Products/Chemical Analysis It will provide also the latest firmware of the modules for download. - Page 229 Index Index connecting APG remote 8-bit configuration switch D/A converter connecting CAN on-board LAN connecting GPIB without On-Board LAN Agilent LabAdvisor connecting LAN Instant Pilot connecting the ChemStation dark current test connecting the power defect on arrival accessory kit parts external contact degradation UV accuracy of wavelength...
- Page 230 Index compensation sensor open definition of compensation sensor short feedback general error messages Flash Trigger Lost overview GLP features leak sensor open replacing firmware glycogen leak sensor short message leak A/D Overflow Motor Encoder Index Wrong ADC Not Calibrated motor friction too high How the Detector Operates encoder index not found motor or encoder not found...
- Page 231 Index range standards symbols power supply indicator non-operating altitude selecting power consideration non-operating temperature peakwidth power consumption response time power cords serial number off-line measurements information operating Altitude settings radio interference operating temperature peakwidth Raman S/N test operation of the detector response time Raman optical unit overview...
- Page 232 Index test function xenon flash lamp D/A converter test functions test chromatogram test function test functions tests dark current functions lamp intensity history lamp intensity PMT gain test Raman AST S/N resistance of monochromators test chromatogram timeout troubleshooting error messages 124, status indicators 124,...
- Page 234 In This Book This manual contains technical reference information about the Agilent 1260 Infinity Fluorescence Detector G1321B. • introduction and specifications, • installation, • using and optimizing, • troubleshooting and diagnose, • maintenance, • parts identification, • safety and related information.