
Subscribe to Our Youtube Channel
Related Manuals for Omega OM-DAQLINK-TEMP


Summary of Contents for Omega OM-DAQLINK-TEMP
- Page 1 ® Extended Warranty User’ s Guide Program OM DAQLINK TEMP Shop online at omega.com ® e-mail: info@omega.com or latest product manuals: omegamanual.info OM DAQLINK TEMPRH OM-D QLINK-TEMP ND OM-D QLINK-TEMPRH Data Loggers...
- Page 2 Online Service Internet e-mail ® omega.com info@omega.com Servicing North merica: U.S.A.: Omega Engineering, Inc., One Omega Drive, P.O. Box 4047 Stamford, CT 06907-0047 USA ISO 9001 ertified Toll Free: 1-800-826-6342 TEL: (203) 359-1660 FAX: (203) 359-7700 e-mail: info@omega.com Canada: 976 Bergar...
- Page 3 OM-DAQLINK Series Data Loggers...
-
Page 4: Table Of Contents
OM-DAQLINK-TEMP and OM-DAQLINK-TEMPRH 4.3. Data Logger Sensor Overview 4.3.1. Internal Sensor Types 4.3.2. External Sensor Types 4.3.3. Sensor Connection 4.3.4. Programming Limitations for OM-DAQLINK-TEMP and OM-DAQLINK-TEMPRH 4.3.5. External Alarm Output 4.3.6. Polarity 4.3.7. Frequency/Pulse Counter 4.3.8. User Defined Sensors 4.3.9. - Page 5 4.5. Power Supply 4.5.1. OM-DAQLINK-TEMP and OM-DAQLINK-TEMPRH Data Loggers 4.5.2. Power Adapter 4.5.3. Data Logger Battery Life 4.6. USB Communication Cable 4.7. OM-DAQLINK Keypad Overview 4.7.1. OM-DAQLINK-TEMP and OM-DAQLINK-TEMPRH Keypad 4.8. Operating the OM-DAQLINK-TEMP and OM-DAQLINK-TEMPRH 4.8.1. Turning on the Unit 4.8.2.
- Page 6 5.17.3. Performing a Two-point Calibration 5.17.4. Performing an Offset Calibration 5.17.5. Setting the Offset to a Specific Input 5.17.6. Calibrating the Internal Temperature Sensor on the OM-DAQLINK-TEMP 5.17.7. Calibrating the External PT-100 Sensor Input 5.17.8. Saving Calibration Settings 5.17.9. Loading Calibration Settings...
- Page 7 Manual Firmware Update via Map View Icon 6.2.4. Cancelling Firmware Update 6.2.5. Interrupted Firmware Update APPENDIX A: OM-DAQLINK SPECIFICATIONS A.1. Data Logger Input Types A.2. OM-DAQLINK-TEMP and OM-DAQLINK-TEMPRH Outputs A.3. Logger Input Specifications OM-DAQLINK-TEMP and OM-DAQLINK-TEMPRH A.4. General Specifications A.5. System Requirements APPENDIX B: SAFETY INFORMATION...
-
Page 8: Chapter 1: Introduction
The software also enables you to configure, calibrate or update the firmware of OM-DAQLINK units via direct USB connection. DataSuite provides one software platform for a wide range of Omega products in addition to the OM-DAQLINK data loggers, such as the OM-DATANET wireless system and OM-MICROLITE and OM-MICROLOGPRO portable, standalone loggers. - Page 9 DataSuite key benefits include: Software GUI based on proven Omega platforms Multiple data view features Map view displaying unit location, signal path and strength Alarm features with 4 alarm levels sending email and SMS notifications ...
-
Page 10: Chapter 2: Om-Daqlink Overview
When not transmitting or recording data the units are in sleep mode and they wake up when needed. The battery for the OM-DAQLINK-TEMP and OM-DAQLINK-TEMPRH is rechargeable and can run up to several months on one charge, depending on the logger configuration. -
Page 11: Hardware Accessories
2.1.2. Hardware Accessories The OM-DAQLINK system includes the following accessories: Mini-USB cable for connecting data logger to PC Power adapter to power the data logger... -
Page 12: Chapter 3: Om-Daqlink Implementation Guide
Chapter 3: OM-DAQLINK Implementation Guide Omega recommends first time users of the OM-DAQLINK system read this chapter before drilling down into the many features of the system described later in the user guide. The Implementation Guide will give you a clear understanding of the basic aspects of setting up the system, and getting the data logger up and running. -
Page 13: Connecting The Logger
1. Only once the DataSuite software and USB driver have been installed, connect the OM- DAQLINK data logger (OM-DAQLINK-TEMP or OM-DAQLINK-TEMPRH) to the Omega- supplied power adapter. Note: Only use adapters provided by Omega. Use of the wrong adapter could damage your OM-DAQLINK units. 2. Turn on the unit by pressing the Scroll button on the front keypad. -
Page 14: Charging Om-Daqlink Loggers
Charging OM-DAQLINK Loggers This section refers to charging the OM-DAQLINK-TEMP or OM-DAQLINK-TEMPRH loggers. Note: Only use adapters provided by Omega. Use of the wrong adapter could damage your OM-DAQLINK units. If the loggers will run from the battery supply make sure to first charge each of the loggers for 16 hours before use in order maximize the battery life. -
Page 15: Configuring The Logger
Right-click the Map View background and two options will be available: Load Wallpaper and Reset Wallpaper, which resets to the default Omega wallpaper. 3.6. Configuring the Logger Once the software has detected the OM-DAQLINK logger, you must configure the unit in order to start acquiring data. -
Page 16: Viewing Data
Alarm delay Alarm pre delay 3. Select the Memory State, Online or Optimized Memory Modes. 4. Select the sensors you wish to connect to the logger for data acquisition. It doesn’t matter which order you select the sensors. You may only have Input 4 selected, for example, and Inputs 1 to 3 left unselected. -
Page 17: Logger Tooltip
Figure 5: Online data – Table view Figure 6: Online data – Statistics view 3.7.2. Logger Tooltip Close the online data window and return to Map View. Scroll over the Logger icon and you will see a tooltip displaying the relevant logger information, including real-time data. Figure 7: Logger tooltip This tool-tip is updated with every newly recorded sample. -
Page 18: Downloading Data
Figure 8: Sensor view If the sensor is in alarm, the sensor box will change color from green to red (just as the Logger icon would). Double-clicking the individual sensor box will open the data in the online Graph view. 3.8. -
Page 19: Chapter 4: Om-Daqlink Hardware Overview
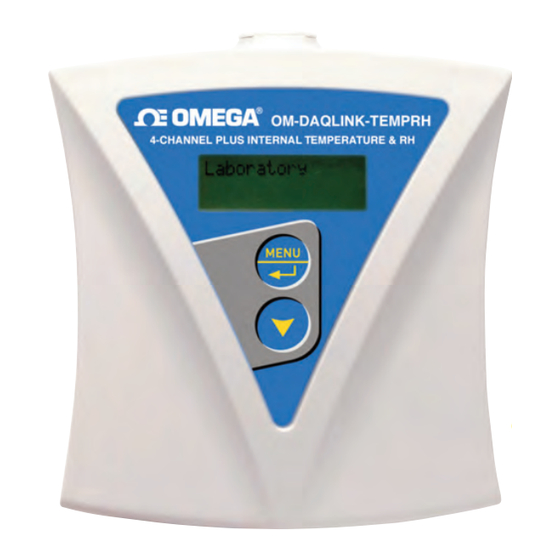
This chapter details the hardware features of the OM-DAQLINK data loggers. 4.1. Data Logger Front Panel Layout 4.1.1. OM-DAQLINK-TEMP and OM-DAQLINK-TEMPRH Apart from the color scheme, the OM-DAQLINK-TEMP and OM-DAQLINK-TEMPRH data logger models have the same front panel design. LCD screen Menu/Enter button Scroll button... -
Page 20: Data Logger Sensor Overview
Data Logger Sensor Overview This section provides an overview of the hardware specifications of the OM-DAQLINK data loggers. 4.3.1. Internal Sensor Types The OM-DAQLINK-TEMP and OM-DAQLINK-TEMPRH loggers include internal sensors, depending on the logger model. Sensor Measurement Accuracy Logger Model Range ±3% (in DataSuite... -
Page 21: External Sensor Types
PT100 ºC TEMP 4.3.2. External Sensor Types OM-DAQLINK-TEMP and OM-DAQLINK-TEMPRH Each of the four input channels of these data logger models are multi-purpose and can be individually configured to any of the following types and ranges. Sensor Measurement Range Accuracy... -
Page 22: Sensor Connection
Sensors do not have to be added successively. You may only configure In-4, or configure In-1 and In-3, for example, when setting up the logger via the software. 4.3.4. Programming Limitations for OM-DAQLINK-TEMP and OM- DAQLINK-TEMPRH The standard sampling rate for all sensors on all inputs is from a maximum of one sample every second to a minimum of one sample every 18 hours. -
Page 23: External Alarm Output
Once there is no alarm status, the external alarm will be deactivated. Data Logger External Alarm In-1 of the OM-DAQLINK-TEMP and OM-DAQLINK-TEMPRH serves either as a standard sensor input or as an external alarm output. Ensure the logger is connected to AC power if connected to an external alarm. -
Page 24: Polarity
Load inputs of the Relay go to the Alarm device e.g. siren, lights, etc. - of the battery goes to – of OM-DAQLINK unit. Note: Maximum load of the Relay is 50 mA, 3 V. Refer to A ppendix A: OM-DAQLINK Specifications for the full external alarm output specification. -
Page 25: Unit Serial Number And Comment
OM-DAQLINK-TEMP and OM-DAQLINK-TEMPRH Data Loggers The OM-DAQLINK-TEMP and OM-DAQLINK-TEMPRH data loggers run from an internal NiMh rechargeable battery as well as from external AC power supply. Depending on the logger configuration, from a fully charged battery, the data logger can run for up to several months. -
Page 26: Power Adapter
4.5.2. Power Adapter The OM-DAQLINK power adapter is used to power the OM-DAQLINK-TEMP and OM- DAQLINK-TEMPRH units. The mains adaptor (AC/DC adaptor) converts mains power (from a wall outlet) to a voltage suitable to the OM-DAQLINK hardware unit. -
Page 27: Om-Daqlink Keypad Overview
4.7.1. OM-DAQLINK-TEMP and OM-DAQLINK-TEMPRH Keypad The OM-DAQLINK-TEMP and OM-DAQLINK-TEMPRH units each have two buttons on the keypad, which are used to navigate through the LCD menu options, as well as turn on the units. Refer to section 4 .8 to learn how to operate the data loggers. -
Page 28: Display Shutdown
4.8.2. Display Shutdown If the logger screen is inactive for thirty seconds it will turn off. However the logger will continue to operate in the background. Press the Scroll button to enable the LCD screen again. The screen will not turn off during firmware upgrade. 4.8.3. -
Page 29: Status Menu
Logger Version This menu informs the user of the logger firmware version. This is helpful when you need to upgrade the system firmware, to check the current version. Or when contacting Omega technical support, with any technical issues. Logger version: 2.03.00.02.38.00... -
Page 30: Additional Logger Screens
Cyclic mode – for continuous logging. The logger will continue to log once the memory is full by writing over the first recorded samples. The memory mode is toggled in the Setup dialog, using the Cyclic Mode checkbox. When the logger memory is full, the LCD will display Memory Full. Press Menu to pause logger (when logger is in Run mode) By pressing the Menu button, the logger will cease to log data until the Menu button is pressed again from the same screen. - Page 31 Loading firmware Progress: 55% Note: Logger must be in Stop mode before firmware can be updated.
-
Page 32: Chapter 5: Using The Datasuite Software
5.1.3. Installation Procedure Note: If you are planning to use more than one Omega system e.g. OM-DAQLINK and OM- DATANET, only one DataSuite software installation is required. Each product is managed by a specific product module within the DataSuite modular application. - Page 33 1. Insert the DataSuite software CD into your computer’s CD drive. The DataSuite Installation Wizard automatically starts running. 2. The Wizard first downloads and installs Microsoft .NET Framework 2.0, if not already detected on the computer. The DataSuite software requires this platform in order to run. Follow the installation instructions to install the .NET Framework on your PC.
- Page 34 The installation of the driver could take up to one minute or more, depending on the system. Figure 17: Installing Silicon Labs USB driver – Step 4 8. Once installed click Finish to close the USB driver Install Wizard dialog. 9.
- Page 35 13. Select Start trial to commence the free 30-day trial and click Next. The module registration can be completed at a later stage. For more details refer to section 5 .2. 14. Once the Trial period has started, DataSuite will detect the connected loggers. To detect more than one product module at the same time, you must ensure that each module is either in Trial mode or activated using the unique software Serial Number.
-
Page 36: Working With Multiple User Accounts
When the initial 30 day Trial period is over, the user will not be able to operate the OM- DAQLINK via the software until a valid serial number is registered. Note: The software activation feature protects Omega’s intellectual property for both its software and hardware. -
Page 37: Software Registration Process
1. Locate the DataSuite module serial number (SN). The SN label is found on the DataSuite box as well as on the software CD case. Note: If you cannot locate your serial number, contact Omega Customer Support directly. 2. Launch DataSuite. The registration wizard will open. - Page 38 Activation via the Internet 1. After entering the software serial number, click Next. 2. DataSuite will now establish communication with the Omega server to complete the registration process. If successful, a confirmation message will appear. In the event of any problem in the registration process, please contact your Omega Customer Support.
- Page 39 3. Record the License Key obtained from the Web registration form. Enter it into the License Key field in Step 3 and click Unlock. 4. DataSuite will now establish communication with the Omega server to complete the registration process. If successful, a confirmation message will appear. In the event of any problem in the registration process, please contact Omega Customer Support.
-
Page 40: System Password
In addition, the Map View can be printed. Icons are used to represent each of the Omega devices, and using the mouse the user can select specific actions to be performed on the unit. Name tags can also be displayed for each OM-DAQLINK icon on the Map View. -
Page 41: Sensor View
Figure 18: Main window - Map View desktop Refer to section 5 .14 for more details on working in Map View. 5.4.2. Sensor View Clicking the Sensor View button in the main toolbar switches the main DataSuite window to a display where sensor data is represented in individual windows. All sensors which are currently online will be displayed in this view. - Page 42 There are two modes for viewing the sensor data, which may be toggled by going to Tools > Switch Sensor View Mode in the main menu. Expanded view In this view, the logger comment, sensor type and sensor data is displayed. ...
-
Page 43: History View
Downloading data indication (when relevant) 5.4.3. History View Note: In History View you can view data from multiple Omega products in the same view. For example, compare data from OM-DATANET loggers side-by-side with OM-DAQLINK loggers. Clicking the History View button in the main toolbar will switch the main window to view archived, offline data stored in the DataSuite directory on the workstation. -
Page 44: Data Map
In History View, the user may view the data in graph or table format by clicking the relevant tabs, as well as view a number of Statistics taken from the data set. To learn the functionality of the lower graph toolbar, refer to section 5 .4.5 below. Note: Users of Windows 7 using right to left language settings e.g. -
Page 45: Map View Icons
Map view - Switches main window to Map view, where the units connected to the computer are represented Sensor view - Switches main window to Sensor view, where data from each running sensor is displayed in a simple view ... -
Page 46: Graph (Lower) Toolbar Icons
OM-DAQLINK Icons Logger which has received its Setup but is in Stop mode. Running from internal battery supply. Logger which has received its Setup but is in Stop mode. Running from external power supply. Logger in Run mode and running on ... -
Page 47: Data Map Icons
Zoom in – Zooms in on the graph data. Pan graph – Pans the graph along the x or y axis. Select first cursor – Adds a cursor to the designated plot on the graph Select second cursor – Adds a second cursor to the ... -
Page 48: File Menu Items
Logger data set. Click to expand or collapse the data set containing all measured inputs of the specific logger. Parent node for all custom graph views. Click to expand or collapse all child nodes. Displayed custom graph view. When ... -
Page 49: Print Map View
5.5.7. Print Map View Prints the current Map View with all unit icons, including their network paths and name tags. 5.5.8. Exit Exits the DataSuite application. 5.6. Tools Menu Items 5.6.1. Define Sensor DataSuite enables the user to define custom sensors. This is a useful tool for when the data logger is communicating with many sensor types from different vendors. -
Page 50: Switch Sensor View Mode
5. Enter two calibration values (two real values and the corresponding output values of the sensor). 6. Click Save. 7. To make any changes to the existing sensor definitions, stand on the sensor name and click Edit. Otherwise, click New to define additional sensors or click Close to exit the dialog. To use the custom defined sensor: 1. -
Page 51: Firmware Update Center
5.6.8. Firmware Update Center The Firmware Update Center is where the logger firmware updates are managed. Please refer to section 6 .2 for more details. 5.7. Tools > Options Menu Items The Options dialog is divided into four main tabs: ... - Page 52 The default path for saving all data recorded by the data loggers is: Default path on WinXP: C:\Documents and Settings\All Users\Application Data\Omega\DataSuite\Data Files\ Default path on Windows 7: C:\Users\Public\Omega\DataSuite\Data Files\ Click Browse to change this path e.g. to a network path. Save text data files Select this checkbox if you would like DataSuite to also save the logger data to a text file.
- Page 53 Default path on WinXP: C:\Documents and Settings\All Users\Application Data\Omega\DataSuite\Text Files. Default path on Windows 7: C:\Users\Public\Omega\DataSuite\Text Files Click Browse to change this path e.g. to a network path. Note: The text file cannot be updated with logger data as long as it is open. Make sure to close the file when you finish inspecting the data, or copy the file to another location and view it from there.
-
Page 54: Device Settings Tab
5.7.2. Device Settings Tab Download data on application startup Select this checkbox if you want to have automatic download of data when the DataSuite software is launched. If there are many loggers in the system with fast sampling rates, then the download could burden the network. - Page 55 DataSuite includes a Default Profile – this is a Omega-configured email account, embedded into the software. This means that even if you don’t configure any email account, you are still able to send Email alarm notifications and Boomerang data reports using Omega’s own email account.
-
Page 56: Sms Settings Tab
3. When finished, click OK to return to the main Email Settings window, displaying the list of profiles. 4. To remove a profile from the Profile List, click Remove from the Email Profile Manager window. Note that the default profile cannot be removed. Note: DataSuite supports SMTP and MIME encoding, and POP3 mail protocols. -
Page 57: Analysis Menu Items
Figure 26: Options > SMS Settings tab Note: Once the GSM modem is online you will see the green GSM icon appear in the DataSuite upper toolbar. Sending a Test SMS To send a test SMS to verify the SMS configuration is correct: 1. - Page 58 The Analysis options available are: Functions Parameters Dew Point FO Pasteurization Histogram Export to Excel Export to CSV MKT (Mean Kinetic Temperature) Mean Kinetic Temperature or MKT is used for calculating temperature stress of perishable stock goods such as medicines or food, during storage and distribution cycles.
-
Page 59: Devices Menu Items
Export to Excel You may export offline data to Excel by selecting this menu item or by clicking the Export to Excel icon in the lower graph toolbar in History View. The data is opened in an Excel worksheet and includes pertinent information such as logger name, SN, sensor names, alarm levels as well as the actual data readings. -
Page 60: Stop All
The search criteria are: Device Serial Number e.g. 7002354 Device Comment e.g. Lab 1/F Device Type e.g. OM-DAQLINK-TEMP Enter the relevant search criteria in the text window and all relevant matching devices will appear in the Search Results box. -
Page 61: Data Recovery
As soon as a logger starts to record data the software creates a data file to which it writes the logger data. In Windows XP, for example, logger data files are stored in the following default location: C:\Documents and Settings\All Users\Application Data\Omega\DataSuite\Data Files In Windows 7, the data files are stored here: C:\Users\Public\Omega\DataSuite... -
Page 62: Viewing Archived (Offline) Data
A folder is created for each data logger and is named according to the logger Serial Number. In this folder is stored the data files. A file is created for each day that the logger is recording data. The file name format is the date followed by the file extension e.g. 2007-12-30.dat. The data is saved automatically by the software. - Page 63 Figure 28: Open Data Files dialog 4. In the Sync Data dialog, you can select the sampling rate at which you wish to display the data. The default option is the original rate. Click OK. Figure 29: Sync Data dialog The data is opened in History View.
-
Page 64: Viewing Online Data
5.13. Viewing Online Data You can view the data from any of your loggers in real-time, as the data is being recorded and transmitted to the PC. OM-DAQLINK loggers must be connected via USB cable to the DataSuite software to enable online data view. ... -
Page 65: Working In Map View
In the screenshot above you can see two labels, Internal Digital Temperature and Int RH. At present, each label is active meaning the sensor data corresponding to the label is shown on the graph. By clicking any of the sensor labels, you can hide the data from the graph. The label will then be grayed out. -
Page 66: Printing The Map View
5.14.2. Printing the Map View To print the Map View go to File > Print Map View. This will also print the icon name tags and network paths, if enabled. The Map View maintains its aspect ratio when printed. 5.14.3. Displaying Icon Name Tags You can display a name tag for each device on the Map View. -
Page 67: Configuring The Logger
Note: This feature works only if there are no other commands in the queue following the Download process. Reset Alarm When the logger is in a state of alarm, this option will reset the alarm state to normal on both the logger and the software. - Page 68 The main logger configuration is performed on the Device Setup tab. Any alarm levels you wish to configure is performed on the Alarm Setup tab. Figure 31: OM-DAQLINK Device Setup tab Comment This is the name of the logger. It is advisable to name the logger according to the location in the facility.
-
Page 69: Temperature Units
Online Mode: For working with logger connected to PC. Data will be transmitted in real- time i.e. at the same time as the sampling rate. Optimized Memory Mode: For working with the logger as a standalone device, not connected to the PC. -
Page 70: Om-Daqlink Alarm Setup Tab
Note: On the OM-DAQLINK-TEMPRH you cannot run the humidity sensor without running the temperature sensor in parallel. This is because when using the OM-DAQLINK-TEMPRH data logger and selecting the internal humidity sensor in the Device Setup dialog, the internal digital temperature sensor will automatically be selected as well. - Page 71 Using the Pre Alarms gives the user ample warning of a possible breach of real alarm levels, so necessary measures can be taken to prevent such a breach. Simply select the check box for the type of alarm you wish to be notified. You can select all alarms too.
-
Page 72: Alarm Notifications Setup
Sound Alarm during Pre-alarm You also have the option to sound the alarm in the software during a pre-alarm scenario, not just for a standard alarm. Once you have configured your alarms, you may return to the Device Setup tab or click one of the Setup buttons at the bottom of the tab. -
Page 73: Contacts Tab
The Email/SMS Notifications dialog is divided into the following tabs: Notifications Setup Contacts tab Groups tab 5.16.1. Contacts Tab The first step is to create the contacts who shall be receiving the notifications. The ability to manage contacts is possible from both the Email and SMS Notifications dialogs. 1. -
Page 74: Groups Tab
Title: Corporate position Phone number: The number the DataSuite software will use to send the SMS notification. Note: The phone number field supports the following characters: 0-9, # , *, -, ( ), + Email: The address the DataSuite software will use to send the Email notification. ... -
Page 75: Notifications Setup Tab
5.16.3. Notifications Setup Tab 1. Once the contacts have been created you may start defining which contacts should receive the alarm notifications. 2. The pane on the left-hand side of the Notifications Setup tab displays all of the units and their serial numbers. -
Page 76: Calibration
5.17. Calibration All Omega data loggers are shipped fully calibrated either with a calibration certificate or a Declaration of Accuracy certificate. However, DataSuite does provide a simple and efficient process for users wishing to calibrate their data loggers themselves. The process itself is performed with the OM-DAQLINK unit connected via USB cable. - Page 77 OM-DAQLINK Sensor Inputs Sensor Type Calibration Method 4 – 20 mA Current Two-point calibration Humidity Digital Two-point calibration (Internal) Temperature Digital Two-point calibration (Internal) Temperature Two-point calibration and PT-100 (Internal) offset Two-point calibration and Temperature PT-100 2-wire offset Temperature Thermocouple J Offset calibration Temperature Thermocouple K...
-
Page 78: Calibrating The Data Logger
5.17.2. Calibrating the Data Logger Figure 36: Calibration dialog 1. From the Map View, open the Logger context menu and select Stop. 2. Select Calibration > Calibrate and enter the password in the Password dialog. 3. Select the sensor you wish to calibrate from the Sensor drop-down menu. 4. -
Page 79: Performing A Two-Point Calibration
5. If the values are still not accurate enough, you can perform Offset calibration to tweak with values further. Note: Omega strongly recommends calibrating using the default Reference values that appear in the two Reference value text boxes for each sensor. -
Page 80: Calibrating The Internal Temperature Sensor On The Om-Daqlink-Temp
3. You can repeat the procedure for every input. 5.17.6. Calibrating the Internal Temperature Sensor on the OM- DAQLINK-TEMP The OM-DAQLINK-TEMP internal temperature sensor is a PT-100 sensor. Calibration of this sensor is performed by calibrating the external PT-100 input i.e. two-point calibration followed by offset calibration. -
Page 81: Analyzing The Data
5.18. Analyzing the Data When in offline (History View) or online data displays, you have a number of features for analyzing the on-screen data. The features for analyzing data while in the graph display are practically the same when in offline or online mode. 5.18.1. - Page 82 Figure 38: Example of using two cursors When using two cursors, the Statistics feature will calculate statistics according to the data set between the two cursors. To display the first cursor: Click 1 Cursor on the graph toolbar. You can drag the cursor with the mouse onto any other point on the plot, or onto a different plot.
- Page 83 Show/Hide Time Stamps This feature is not supported by the OM-DAQLINK. By default, the Time Stamp icon enabled to display in the online or offline graph, any time stamp marked using the OM- MICROLITE or OM-MICROLOGPRO data loggers. Add Custom View Whenever the graph in History View is modified, either by using the Zoom tool, changing the scale, panning the graph, etc.
-
Page 84: Manual Scaling
6. To restore the default formatting, select the Use system line properties checkbox again. Manual Scaling 1. Click Graph properties on the graph toolbar. 2. Select the Axis Scaling tab and with the Group plots by units checkbox unselected, select the axis to manually scale from the drop-down menu e.g. -
Page 85: Changing The Graph, Table Or Statistics View Header
5.18.2. Changing the Graph, Table or Statistics View Header Each Graph, Table or Statistics tab has a header located above the specific view. The default headers are: DataSuite - Graph DataSuite - Table DataSuite - Statistics The header will also be included when printing the graph. To change the header: 1. -
Page 86: Printing The Data
DataSuite will then open a new Excel workbook displaying the data as well as other pertinent information such as logger comment, serial number and the alarm level setup. Data that exceeds any of the alarm levels will be indicated. Figure 42: Example of data exported to Excel Only offline data opened in History View can be exported to CSV and is available under the Analysis menu. -
Page 87: Reports Module
Each report can be sent via e-mail to a selected distribution list, at pre-defined time intervals, in PDF and Excel format. All reports are saved in the default directory: C:\Program Files\Omega\DataSuite\Reports To change this path go to the Preferences tab in Tools > Options. 5.21.1. Creating a Report Profile The first step when creating a report is to create a new Report Profile. - Page 88 8. Each report created in PDF format contains a header. To change the report’s header, select the PDF Header Image checkbox and click Browse to locate the relevant image. The default Omega header is: Note: The recommended header dimensions are 525 x 50 pixels, 72 dpi. If a header with different dimensions is loaded, then the software will automatically resize the header dimensions.
-
Page 89: Report Types
c. The user can also select a report according to a specific time period. Select the User Defined option, choose the period and click Generate to manually generate the report according to the defined parameters. 16. Use the Units pane to select which loggers should be included on the report itself. a. - Page 90 Average Number of samples Sent Email Log Logs all emails that were sent during the report time frame. The details in the Sent Emails Log are: Message that was sent Date Time To whom the message was sent (groups will be displayed as groups) Sent SMS Log Logs all SMS’s that were sent during the report time frame.
-
Page 91: Removing A Report Profile
The alarm levels will be marked according to the alarm color and the alarm limit value will be indicated on the Y- axis The graph dimensions will be 7.5 cm x 10.5 cm Sensor Histogram Unit comment and S/N indicated as the graph header ... -
Page 92: Chapter 6: Updating Datasuite Software And Firmware
Omega’s Uptodata client. This client checks for updated software and firmware files located on the Omega server, and if any have been detected they are downloaded and updated on the user’s computer. The user can also have DataSuite automatically update the network units’... - Page 93 5. The files will be downloaded to your default application directory. Click Finish to close the dialog once the download is complete. 6. Click the Options icon in the main Uptodata dialog for further options such as: Checking for updates on startup (select Further Configurations menu item to modify frequency of update checking) ...
-
Page 94: Updating Device Firmware
There are two ways to obtain the OM-DAQLINK firmware file. 1. Using the Uptodata client to download from the Omega server. Refer to section 6 .1. 2. Downloading the latest firmware version directly from the Omega Download Center at www.omega.com... - Page 95 Figure 47: Firmware Update Center dialog 5. If the unit status is Requires an update, then select the checkbox in the Update column adjacent to the unit you wish to update. You may select as many units as you like to update, but only two units can be updated at a time.
-
Page 96: Manual Firmware Update Via Map View Icon
Unit Status Options Offline – unit is offline and firmware status can’t be determined. No update required – Unit has latest firmware installed. Uploading firmware file – Firmware file is being uploaded to the unit. Progress is displayed in percentages. -
Page 97: Cancelling Firmware Update
6.2.4. Cancelling Firmware Update To cancel a firmware update, right-click the unit’s icon in the Map View and select the Cancel Firmware Update option. If a data logger was in Run mode prior to the firmware update, when cancelling it the logger will resume operation in Stop mode. -
Page 98: Appendix A: Om-Daqlink Specifications
Appendix A: OM-DAQLINK Specifications A.1. Data Logger Input Types OM-DAQLINK-TEMP and OM-DAQLINK-TEMPRH External Inputs Internal Inputs Four external inputs with selectable sensor OM-DAQLINK-TEMP type for each input: PT-100 Temperature 4 to 20 mA OM-DAQLINK-TEMPRH 0 to 1 V ... -
Page 99: Om-Daqlink-Temp And Om-Daqlink-Temprh Outputs
(transducers usage) 12 VDC @ 2 A Open collector Reset fuse overload protection Close position resistance: 50 Ù Max. Load: 50 mA, 3 V DC A.3. Logger Input Specifications OM-DAQLINK-TEMP and OM-DAQLINK-TEMPRH Internal PT-100 Internal Digital Internal Digital Temperature Temperature... -
Page 100: General Specifications
~59,000 samples in Optimized Memory Mode Sampling rate: Once per sec to once every 18 hours Sampling resolution: 16-bit Channel separation: 80 dB OM-DAQLINK-TEMP and OM-DAQLINK-TEMPRH Hardware Specifications Display 2-row LCD 16 character display Power Supply ... -
Page 101: System Requirements
AC Power: External 12 V DC input @ 300 mA 3.6 VA Center Negative Operating Temperature Range -20 to 50 ˚C Water and dust proof: IP54 Man Machine Interface Full keyboard operation Standards Compliance CE, FCC, IC Canada A.5. -
Page 102: Appendix B: Safety Information
Safety Information The OM-DAQLINK system complies with relevant safety regulations for data processing devices. Please contact Omega with any questions regarding OM-DAQLINK safety issues. Note: The manufacturer is not responsible for any radio or TV interference caused by unauthorized modifications to this equipment. Such modifications could void the user’s authority to operate the equipment. - Page 103 W RR NTY/DISCL IMER OMEG ENGINEERING, INC. warrants this unit to be free of defects in materials and workmanship for a period of 13 months from date of purchase. OMEG ’s W RR NTY adds an additional one (1) month grace period to the normal one (1) year product warranty to cover handling and shipping time.
- Page 104 Where Do I Find Everything I Need for Process Measurement and Control? OMEG …Of Course! Shop online at omega.com TEMPER TURE Thermocouple, RTD & Thermistor Probes, Connectors, Panels & Assemblies Wire: Thermocouple, RTD & Thermistor Calibrators & Ice Point References Recorders, Controllers &...
Need help?
Do you have a question about the OM-DAQLINK-TEMP and is the answer not in the manual?
Questions and answers