
Subscribe to Our Youtube Channel
Related Manuals for Hantek DSO1000B Series


Summary of Contents for Hantek DSO1000B Series
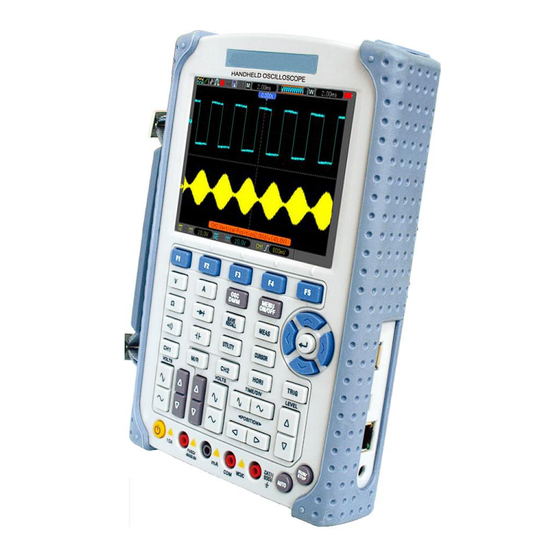
- Page 1 DSO1000B(V) SERIES HANDHELD OSCILLOSCOPE USER’S MANUAL 1062B(V)/1102B(V)/1202B(V) (V1.6)...
-
Page 2: Table Of Contents
Contents Contents Contents ............................i Copyright Declaration ......................... iii Chapter 1 Safety Tips ....................... 1 General Safety Summary ....................1 Safety Terms and Symbols ....................1 Terms on Product ......................2 Symbols on Product ......................2 Product Scrapping ......................2 Chapter 2 Overview ........................ - Page 3 Contents Trigger Controls ......................25 Menu and Option Buttons ....................30 5.5.1 SAVE/RECALL ......................30 5.5.2 MEASURE ......................31 5.5.3 ACQUIRE ........................ 33 5.5.4 UTILITY ........................35 5.5.5 CURSOR ........................ 36 5.5.6 DISPLAY ......................... 36 Fast Action Buttons ......................37 5.6.1 AUTO ........................
-
Page 4: Copyright Declaration
Hantek reserves all rights to modify this document without prior notice. Please contact Hantek for the latest version of this document before placing an order. Hantek has made every effort to ensure the accuracy of this document but does not guarantee the absence of errors. Moreover, Hantek assumes no responsibility in obtaining permission and authorization of any third party patent, copyright or product involved in relation to the use of this document. -
Page 5: Chapter 1 Safety Tips
Safety Tips Chapter 1 Safety Tips 1.1 General Safety Summary Read the following safety precautions to avoid injury and prevent damage to this product or any products connected to it. To evade potential hazards, use this product only as specified. Only qualified personnel should perform maintenance. -
Page 6: Terms On Product
Safety Tips to this product or other property. 1.3 Terms on Product The following terms may appear on the product: DANGER indicates an injury hazard immediately accessible as you read the marking. WARNING indicates an injury hazard not immediately accessible as you read the marking. CAUTION indicates a possible hazard to this product or other property. -
Page 7: Chapter 2 Overview
Overview Chapter 2 Overview 2.1 Brief Introduction to DSO1000B(V) Series Model Channels Bandwidth Sample Rate DSO1062B(V) 60MHz 1GS/s 5.6 inch color DSO1102B(V) 100MHz 1GS/s 5.6 inch color DSO1202B(V) 200MHz 1GS/s 5.6 inch color Table 2-1 Model List of DSO1000B(V) Series DSO1000B(V) Series oscilloscopes cover the bandwidths from 60MHz to 200MHz, and provide the real-time and equivalent sample rates respectively up to 1GSa/s and 25GSa/s. -
Page 8: Chapter 3 Getting Started Guide
Getting Started Guide Chapter 3 Getting Started Guide 3.1 Installation To keep proper ventilation of the oscilloscope in operation, leave a space of more than 5cm away from the top and the two sides of the product. 3.2 Functional Check Follow the steps below to perform a quick functional check to your oscilloscope. -
Page 9: Observe The Waveform
Getting Started Guide 3.2.3 Observe the waveform Press the AUTO button and you should see within a few seconds a square wave of about 2V peak-to-peak at 1kHz in the display. Press the CH1 MENU button and remove Channel 1. Push the CH2 MENU button and repeat Step 2 and Step 3 to observe Channel 2. -
Page 10: Use Of Probe Check Wizard
Getting Started Guide 3.3.2 Use of Probe Check Wizard Every time you connect a probe to an input channel, you should use the probe check wizard to verify that this probe is operating correctly. There are two ways to do this: 1)... -
Page 11: Probe Attenuation Setting
Getting Started Guide 3.5 Probe Attenuation Setting Probes are of various attenuation factors which affect the vertical scale of the signal. The Probe Check function is used to verify if the Probe attenuation option matches the attenuation of the probe. As an alternative method to Probe Check, you can push a vertical menu button (such as the CH 1 MENU button) and select the Probe option that matches the attenuation factor of your probe. -
Page 12: Chapter 4 Main Feature Description
Main Feature Description Chapter 4 Main Feature Description This chapter provides some general information that you need to learn before using an oscilloscope. It contains: 1. Oscilloscope setup 2. Trigger 3. Data acquisition 4. Waveform scaling and positioning 5. Waveform measurement 4.1 Oscilloscope Setup While operating the oscilloscope, you may often use thr feature: Autoset. -
Page 13: Data Acquisition
Main Feature Description two different frequencies. Mainly it uses a specific frequency to switch between two analog channels CH1 and CH2 so that the channels will generate alter trigger signals through the trigger circuitry. Trigger Mode: You can select the Auto or Normal mode to define how the oscilloscope acquires data when it does not detect a trigger condition. -
Page 14: Waveform Scaling And Positioning
Main Feature Description the input signal over each sample interval and uses these values to display the waveform. In this way, the oscilloscope can acquire and display those narrow pulses that may have otherwise been missed in Normal mode. However, noise will appear to be higher in this mode. Average: In this acquisition mode, the oscilloscope acquires several waveforms, averages them, and displays the resulting waveform. -
Page 15: Waveform Measurement
Main Feature Description 4.5 Waveform Measurement The oscilloscope displays graphs of voltage versus time and can help to measure the displayed waveform. There are several ways to take measurements, using the graticule, the cursors or performing an automatic measurement. Graticule: This method allows you to make a quick, visual estimate and take a simple measurement through the graticule divisions and the scale factor. -
Page 16: Chapter 5 Basic Operation
Basic Operation Chapter 5 Basic Operation The front panel of the oscilloscope is divided into several functional areas. In this chapter we will give a quick overview of all control buttons on the front panel as well as the displayed information on the screen and relative testing operations. -
Page 17: Displayarea
Basic Operation 9. TIME/DIV: Decrease or Increase the time base 10. POSITION: Adjust the horizontal trigger position 11. CH2: Shows the CH2 menu 12. VOLTS: Decrease or Increase the voltage/div 13. CH1: Shows the CH1 menu 14. M/R: Shows the Math or REF menu 15. - Page 18 Basic Operation 10 13 12 11 2. Acquisition Mode: Normal, Peak Detect or Average 3. Trigger Status: The oscilloscope is acquiring pretriggered data. All pretriggered data have been acquired and the oscilloscope is ready to accept a trigger. The oscilloscope has detected a trigger and is acquiring the posttrigger information. The oscilloscope works in auto mode and is acquiring waveforms in the absence of triggers.
-
Page 19: Xy Format
Basic Operation 7. Display of window’s position in data memory and data length. 8. Window Time Base 9. Operating Menu shows different information for different function keys. 10. Icon indicates channel coupling. 11. Level Range. 12. Icon indicates whether the waveform is inverted or not. 13. -
Page 20: Horizontal Controls
Basic Operation Time base controls Unusable Trigger controls Unusable 5.2 Horizontal Controls Use the horizontal controls to change the horizontal scale and position of waveforms. The horizontal position readout shows the time represented by the center of the screen, using the trigger time as zero. - Page 21 Basic Operation arrows. Then it positions the window to this mark for further observation. Set or Clear the current Mark. Set/Clear This function is usable in dual-window mode. Push this menu button and auto move it from left to right at a Play/Stop specified speed.
-
Page 22: Scan Mode Display (Roll Mode)
Basic Operation select major or minor window. When the major window is selected, the F1 button provides the same functions as it provides in single-mode window. When the minor window is selected, press TIME/DIV button to scale the waveform whose magnification is up to 1000. 5.2.1 Scan Mode Display (Roll Mode) With the TIME/DIV control set to 80ms/div or slower and the trigger mode set to Auto, the oscilloscope works in the scan acquisition mode. - Page 23 Basic Operation Set the channel vertical postion to the middle of the Reset vertical screen, Ground Coupling Used to display a zero-volt waveform. Internally, the channel input is connected with a zero-volt reference level. Fine Resolution In the fine resolution setting, the vertical scale readout displays the actual VOLTS setting. The vertical scale changes only after you adjust the VOLTS control and set to coarse.
-
Page 24: Math Fft
Basic Operation 5.3.1 Math FFT This chapter elaborates how to use the Math FFT (Fast Fourier Transform). You can use the Math FFT mode to convert a time-domain (YT) signal into its frequency components (spectrum), and to observe the following types of signals: ... - Page 25 Basic Operation 2. Set the Operation option to FFT; 3. Select the Math FFT Source channel. In many situations, the oscilloscope can also generate a useful FFT spectrum despite the YT waveform not being triggered. This is especially true if the signal is periodic or random (such as noise).
- Page 26 Basic Operation Fundamental frequency component Frequency component 1. Frequency at the center graticule line 2. Vertical scale in dB per division (0dB=1V 3. Horizontal scale in frequency per division 4. Sample rate in number of samples per second 5. FFT window type 5.3.1.3 Selecting FFT Window Using windows can eliminate the spectral leakage in the FFT spectrum.
- Page 27 Basic Operation Applying a window to the YT waveform changes the waveform so that the start and stop values are close to each other, which reduces the discontinuities. The Math FFT function has three FFT Window options. There is a trade-off between frequency resolution and amplitude accuracy for each type of window.
- Page 28 Basic Operation same as no windows. Bartlett Best magnitude, worst Single frequency waveforms, to Blackman frequency resolution. Find higher order harmonics. 5.3.1.4 FFT Aliasing Problems occur when the time-domain waveform acquired by the oscilloscope contains frequency components higher than the Nyquist frequency. The frequency components above the Nyquist frequency will be undersampled and displayed as lower frequency components that ‘fold back’...
-
Page 29: Trigger Controls
Basic Operation When the FFT spectrum is being displayed, the channel vertical keys become the zoom and position controls corresponding to their respective channels. The VOLTS key provides the following zoom factors: X1(default), X2, X5 and X10. The FFT spectrum is magnified vertically to the marker M (math waveform reference point on the left edge of the screen). - Page 30 Basic Operation Options Settings Comments Trigger Type By default the oscilloscope uses the edge trigger which Edge triggers the oscilloscope on the rising or falling edge of the input signal when it crosses the trigger level (threshold). Select the input source as the trigger signal. CH1, CH2: No matter the waveform is displayed or not, a Source certain channel will be triggered.
- Page 31 Basic Operation Note: When you choose Normal Polarity, the trigger always occurs on negative-going sync pulses. If the video signal contains positive-going sync pulses, use the Inverted Polarity option. Pulse Width Trigger You can use it to trigger on aberrant pulses. Options Settings Comments...
- Page 32 Basic Operation or not equal to the specified pulse width. <, >: Triggers the oscilloscope when the source signal pulse width is less than or greater than the specified pulse width. Slope Trigger: Judges trigger according to the time for rising or falling, more flexible and accurate than the Edge trigger.
- Page 33 Basic Operation Noise Reject HF Reject LF Reject Type Video Normal Polarity Inverted NTSC Standard PAL/SECAM All Lines Line Number Choose a proper video sync. When selecting Line Number Sync Odd Field for the Sync option, you may use the User Select it to Even Field specify a line number.
-
Page 34: Menu And Option Buttons
Basic Operation Auto Mode Normal Overtime Selects the components of the trigger signal applied to the Coupling Noise Reject trigger circuitry. HF Reject LF Reject Holdoff: To use Trigger Holdoff, push the HORI button and set the Holdoff Time option. The Trigger Holdoff function can be used to generate a stable display of complex waveforms (such as pulse trains). -
Page 35: Measure
Basic Operation Default Recall default setup. Save Save the screen picture. Wave Options Settings Comments Wave Source Select a waveform display to store. Media Flash Select media. Location 0-1000 Save Save the source waveform to the selected reference location. Recall Display the reference waveform on the screen. - Page 36 Basic Operation Click the MEAS key then the following menu appears. Options Settings Comments Source Select the measure source. Measurement Type Frequency Calculate the waveform frequency by measuring the first cycle. Period Calculate the time of the first cycle. Calculate the arithmetic mean voltage over the entire Mean waveform.
-
Page 37: Acquire
Basic Operation The time between the first rising edge of source 1 and the last rising edge of source 2. The time between the first falling edge of source 1 and the first rising edge of source 2. The time between the first rising edge of source 1 and the first falling edge of source 2. - Page 38 Basic Operation LongMem 4K, 40K, 512K, 1M Select the memory depth for different board models. (Real Time) Normal: For the oscilloscope model with the bandwidth of 100MHz, the maximum sample rate is 1GS/s. For time base with insufficient sample rate, you may use the Sine Interpolation Algorithm to interpolate points between sampled points to produce a complete waveform record (4K by default).
-
Page 39: Utility
Basic Operation Input repeated signals First Acquisition Second Acquisition Third Acquisition Fourth Acquisition As shown above, acquire input signals (cycle repeatable) for more than once at a slow sample rate, arrange the sample points by the time they appear, then recover waveforms. 5.5.4 UTILITY Push the UTILITY key to display the Utility Menu as follows. -
Page 40: Cursor
Basic Operation 5.5.5 CURSOR The Cursor Menu. Options Settings Comments Select a measurement cursor and display it. Type Voltage Voltage measures amplitude while Time measures time and Time frequency. Select a waveform to take the cursor measurement. Source MATH Use the readouts to show the measurement. REFA REFB S indicates Cursor 1. -
Page 41: Fast Action Buttons
Basic Operation Options Settings Comments Vectors fills up the space between adjacent sample Vectors Type points in the display; Dots only displays the sample Dots points. Sets the time length to display each displayed Persistency 0.2S-8S selectable sample point. Infinite YT format shows the vertical voltage in relation to time (horizontal scale);... - Page 42 Basic Operation TIME/DIV Adjusted Trigger Coupling Adjusted to DC, Noise Reject or HF Reject Trigger Holdoff Minimum Trigger Level Set to 50% Trigger Mode Auto Trigger Source Adjusted Trigger Slope Adjusted Trigger Type Edge Trigger Video Sync Adjusted Trigger Video Standard Adjusted Vertical Bandwidth Full...
-
Page 43: Signal Connectors
Basic Operation 5.7 Signal Connectors See the figure below to find the two signals connectors and a pair of metal electrodes at the bottom of the oscilloscope panel. 1. CH1, CH2: Input connectors for waveform display, through which to connect and input the signal to be measured. -
Page 44: Chapter 6 Application Examples
Application Examples Chapter 6 Application Examples This chapter unfolds a further description on main features of the oscilloscope by giving eleven simplified application examples for reference to help solve your own test problems. Taking simple measurements Using AUTO Using the Measure menu to take auto measurements Taking cursor measurements Measuring ring frequency and ring amplitude Measuring pulse width... - Page 45 Application Examples the waveform meets your particular requirement. Taking Auto Measurements The oscilloscope can display most signals by automatic measurements. To measure such parameters as the signal frequency, period, peak-to-peak amplitude, rise time and positive width, follow the steps below. Push the MEAS button to see the Measure menu.
-
Page 46: Example 2: Taking Cursor Measurements
Application Examples 6.2 Example 2: Taking Cursor Measurements You can use the cursor to quickly measure the time and amplitude of a waveform. Measuring Ring Time (convertible to Frequency) and Amplitude on Rising Edge of Pulse To measure the ring time on the rising edge of the pulse, follow the steps below. Push the CURSOR button to view the Cursor menu. - Page 47 Application Examples Measuring Pulse Width To analyze a pulse signal and to know its width, follow the steps below. Push the CURSOR button to view the Cursor menu. Push F1 the Type option button and select Time. Push F2 the Source option button and select CH1. Select a cursor.
-
Page 48: Example 3: Analyzing Input Signals To Eliminate Random Noise
Application Examples measure the rise time between the 10% and 90% levels of the pulse waveform. To do so, follow the steps below. Click the TIME/DIV key to display the rising edge of the waveform. Click the VOLTS and Vertical Position keys to adjust the waveform amplitude to about 5 divisions. - Page 49 Application Examples Observing Noisy Signal Enter the Acquire menu. Push the Type option button and select Real Time. Push the Peak Detect option button. If necessary, enter the DISPLAY menu and set the Contrast option to view the noise more clearly.
-
Page 50: Example 4: Capturing Single-Shot Signal
Application Examples change in the waveform display. Note: Averaging reduces random noise and let you view the signal details more easily. See the figure below for better understanding 6.4 Example 4: Capturing Single-shot Signal You may refer to the following example to easily capture some aperiodic signals like pulses and glitches. -
Page 51: Example 5: Using X-Y Mode
Application Examples 6.5 Example 5: Using X-Y Mode Viewing Phase Differences between Two Channel Signals For example, you need to measure the change in a phase across a circuit network. Connect the oscilloscope with circuitry and view the input and output of the circuit in XY mode. Follow the steps below. -
Page 52: Example 6: Triggering On Pulse Width
Application Examples should be in the first and fourth quadrants, i.e. within (0~π/2) or (3π/2~2π). If the principal axes of the ellipse are in the second and fourth quadrants, the phase difference angle should be in the second and third quadrants, i.e. within (π/2~π) or (π-3π/2). See the figure below for better understanding. -
Page 53: Example 7: Triggering On Video Signal
Application Examples condition, the oscilloscope will trigger. For example, the signal contains such aberrant pulses as shown below, you may select ‘≠’ or ‘<’ to trigger on the pulse. As shown in the above figure, you can get a stable waveform display if inputting a square wave at the frequency of 1KHz, with pulse width set to 500μs. - Page 54 Application Examples Triggering on Video Lines To trigger on the video lines, follow the steps below. Push the TRIG MENU button to see the Trigger menu. Select Video for the Type option. Push the Source option button to select CH1; push the Polarity option button to select Normal; push the Standard option button to select NTSC;...
-
Page 55: Example 8: Using Slope Trigger To Capture Particular Slope Signal
Application Examples 6.8 Example 8: Using Slope Trigger to Capture Particular Slope Signal In many occasions, we are not only concerned about the edge of the signal, but also want to know the rise and fall times of the signal. To better observe this kind of signals, we bring in the slope trigger. -
Page 56: Example 10: Using Math Functions To Analyze Waveforms
Application Examples Click the Trigger Level key to adjust the trigger level and stabilize video signals. Adjust the line number (NTSC: 0-525 lines). Clck the horizontal TIME/DIV and the vertical VOLTS keys to display on the screen a complete video signal triggering on a video line. See the figure below. Note: The difference between the overtime and the delay triggers is that the overtime trigger can identify the pulse you need according to your set time and trigger on any point of the pulse. - Page 57 Application Examples refer to Chapter 5.3.1 Math FFT. Note: You should compensate both probes before performing the math operation; otherwise, differences in probe compensation will appear as errors in the differential signal. As illustrated in the above figure, input a 1KHz sine wave from CH1 and a 1KHz square wave from CH2.
-
Page 58: Example 11: Measuring Data Propagation Delay
Application Examples 6.11 Example 11: Measuring Data Propagation Delay When you doubt that there appear instabilities in a serial data propagation control circuit, you can set the oscilloscope to measure the propagation delay between the enable signal and the transfer data. -
Page 59: Example 12: Play Video
Application Examples DATA 6.12 Example 12: Play Video Note: The video function is only applied to DSO1000BV. The video playing function supports playing mpg,avi,flv ,mp3 ,vob,wmv,swf,mp4 ect. file formats.The video coder supports MPEG1 or MPEG2.The audio coder supports MP2 or MP3.The playing resolution is no more than 640x480(the best resolution is512x360).The frame number of every second is less then 18. -
Page 60: Example 13: Setting Net Ip
Application Examples Press the Arrow key to select the U disk or the oscilloscope inner storage card file.(Press the left key then the U disk is selected and press the right key then the oscilloscope is selected and press the up key or the down key to select the file to display.F2:Copy the selected file from U disk to the Oscilloscope inner storage card. -
Page 61: Example 14: Charging
Application Examples 2. Select Device IP or Device Port you want to set and press ENTER key.Then there pushes up the Input panel dialog. 3. Modify the parameter by the soft keyboard. 6.14 Example 14: Charging Your battery has been partially charged at the factory, but you may need to recharge it before you can switch on your device for the first time. -
Page 62: Example 15: Back Light Control
Application Examples 6.15 Example 15: Back light control 1. Press the UTILITY button, entering the UTILITY menu. 2. Press F5 to page down. 3. After reaching the page four, then press F3 to enter the Display menu. 4. Press F5 button to page 3 of display menu, press F3. 5. -
Page 63: Chapter 7 Multimeter
Multimeter Chapter 7 Multimeter About this chapter This chapter provides an introduction to the multimeter functions of DSO1000B(V) Series. The introduction gives guides to show how to use the menus and perform basic measurements. Connecting the Meter Use the 4-mm safety banana jack inputs for the Meter functions: 10A , mA, COM,V/Ω/C. Multimeter Operation Window Figure 7-1 Multimeter operation window Description... - Page 64 Multimeter Operating the Multimeter If you are in the oscilloscope window, press OSC/DMM key, the oscilloscope will switch to the multimeter mode window.Then the screen will display the measure mode window that was in use the last time before you quit multimeter measure. When you switch to the multimeter measurement the first time, the default measure mode is DC voltage mode.
- Page 65 Multimeter Figure 7-3 Diode Measurement Making an On-off Measurement To perform an On-off test, do the following: 1) Press the On-off key and then On-off indictor appears on the top of the screen. 2) Insert the black lead into the COM banana jack input and the red lead into the V/O/C banana jack input.
- Page 66 Multimeter To measure a capacitance, do the following: 1) Press the C key and a capacitor symbol appears on the top of the screen. 2) Insert the black lead into the COM banana jack input and the red lead into the V/O/C banana jack input.
- Page 67 Multimeter Figure 7-6 DC voltage Measurement Making an AC Voltage Measurement To measure the AC voltage, do the following: 1) Press the V key and DC appears on the screen. 2) Press the F1 key and AC appears on the screen. 3) Insert the black lead into the COM banana jack input and the red lead into the V/O/C banana jack input.
- Page 68 Multimeter Making a DC Current Measurement To measure a DC current which is less than 600 mA , do the following: 1) Press the A key and then DC appears on the screen. The unit on the main reading screen is mA. Press F2 to switch the measurement between mA and 10A.
- Page 69 Multimeter Figure 7-9 DC Current Measurement for 10A Making an AC Current Measurement To measure an AC current which is less than 600 mA, do the following: 1) Press the A key and then DC appears on the screen. The unit on the main reading screen is mA,and mA will display on the bottom of the screen, press F2 to switch the measurement between mA and 10A.
- Page 70 Multimeter Figure 7-10 AC Current Measurement for 600 mA To measure an AC current which is larger than 600 mA, do the following: 1) Press the A key and then DC appears on the screen. The unit on the main reading screen is mA. 2) Press F2 key to switch to10A measurement, the unit on the main reading screen is A.
- Page 71 Multimeter Taking a Relative Measurement A currently measured result relative to the defined reference value is displayed in a relative measurement. The following example shows how to take a relative measurement. At first, it is required to acquire a reference value. 1) Press the Okey.
- Page 72 Multimeter Attention: capacitance measurement without manual range mode. Then,the screen will look like the following figure 7-13. Figure 7-13 The Manual Range Mode DSO1000B(V) Series HandHeld Oscilloscope User Manual...
-
Page 73: Chapter 8 Troubleshooting
Troubleshooting Chapter 8 Troubleshooting 8.1 Problem Settlement 1. If the oscilloscope does not start up at power on, follow these steps: 1) Check the power cord to verify it has been connected properly; 2) Check the power on/off button to ensure it has been pushed; 3)... -
Page 74: Chapter 9 Specifications
General Care and Cleaning Chapter 9 Specifications 9.1 Technical Specifications All specifications herein mentioned apply to the DSO1000B(V) series oscilloscopes. Before checking an oscilloscope to see if it complies with these specifications, make sure it meets the following conditions: The oscilloscope must have been operating continuously for twenty minutes under the specified operating temperature. - Page 75 General Care and Cleaning Vertical 8-bit resolution, A/D Converter each channel sampled simultaneously VOLTS Range 2mV/div to 5V/div at input BNC 2mV/div to 200mV/div, ± 2V Position Range >200mV/div to 5V/div, ± 50V Analog Bandwidth in 2mV/div to 20mV/div, ± 400mV Normal and Average 50mV/div to 200mV/div, ±...
- Page 76 General Care and Cleaning 1.5div from 10MHz to 2div from 100MHz Full to Full Attenuates signals below 10Hz HF Reject Attenuates signals above 80kHz Same as the DC-coupled limits for frequencies above LF Reject 150kHz; attenuates signals below 150kHz Source Range Trigger Level Range CH1, CH2...
- Page 77 General Care and Cleaning Equal: The oscilloscope triggers when the waveform slope is equal to the set slope. Not Equal: The oscilloscope triggers when the waveform slope is not equal to the set slope. Slope Trigger Point Less than: The oscilloscope triggers when the waveform slope is less than the set slope.
- Page 78 General Care and Cleaning Inputs Inputs Input Coupling DC, AC or GND Input Impedance, 1MΩ±2% in parallel with 20pF±3pF DC coupled Probe Attenuation 1X, 10X Supported Probe Attenuation 1X, 10X, 100X, 1000X Factors Overvoltage Category Maximum Voltage 300V (10×), Installation CAT I and CAT II Category CAT III...
- Page 79 General Care and Cleaning Environmental Operating: 32℉ to 122℉ (0℃ to 50℃) Temperature Nonoperating: -40℉ to 159.8℉ (-40℃ to +71℃) Cooling Method Convection +104℉ or below (+40℃ or below): ≤90% relative humidity Humidity 106℉ to 122℉ (+41℃ to 50℃): ≤60% relative humidity Altitude Operating and Nonoperating 3,000m (10,000 feet)
- Page 80 Supported File system Yaffs, Fat32 Sound Driver, Buzzer Driver, FPGA Driver, SPI Driver, USB Drivers Host Driver, LCD Driver, USB massstorage、gadget Driver Linux Applications busybox1.18.4, mplayer, watchdog, gnupg1.4.11 U_boot Version u-boot-1.1.6 Sourcecode download website www.hantek.com./download/handscope.zip DSO1000B(V) Series HandHeld Oscilloscope User Manual...
-
Page 81: Accessories
General Care and Cleaning 9.2 Accessories All the following accessories are available by contacting your local HANTEK distributor. Standard Accessories Sketch Description X1, X10 two passive probes. The passive probes have a 6MHz bandwidth (rated 100Vrms CAT III) when the switch is in the X1 position, and a maximum bandwidth (rated 300Vrms CAT II) when the switch is in the X10 position. -
Page 82: Chapter 10 General Care And Cleaning
General Care and Cleaning Chapter 10 General Care and Cleaning 10.1 General Care Do not put or leave the device in a place where the LCD display will be exposed to direct sunlight for long periods of time. Note: To avoid damage to the oscilloscope or probes, do not expose them to sprays, liquids, or solvents. -
Page 83: Chapter 11 Services And Support
General Care and Cleaning Chapter 11 Services and Support Thank you for choosing HANTEK. Please contact us through the following ways should you have any inquiry regarding our products. We shall do our best to help you. 1. Contact your local HANTEK distributor;... -
Page 84: Appendix A Harmful And Poisonous Substances Or Elements
General Care and Cleaning Appendix A Harmful and Poisonous Substances or Elements Harmful and poisonous substances or elements Component Cr(Vi) PBDE Shell and Chassis Display Module Circuit Board Power Supply Electric Wire and Cable Assembly Connector Fastener and Installed Hardware Other Accessories (including probes) Others...
Need help?
Do you have a question about the DSO1000B Series and is the answer not in the manual?
Questions and answers