Sonel PQM-702 Quick Manual
Power quality analyzers
Hide thumbs
Also See for PQM-702:
- Operating manual (179 pages) ,
- User manual (138 pages) ,
- User manual (112 pages)
Table of Contents
Advertisement
Quick Links
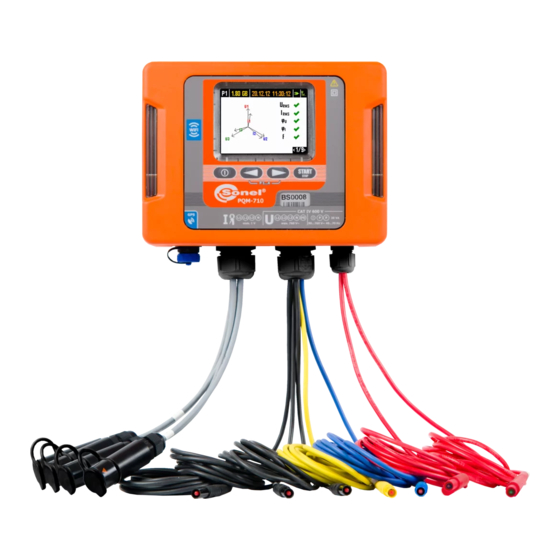
Sonel PQM-702 / 702T / 703 / 710 / 711
Power Quality Analyzers ● Quick Guide
v1.02 | 29.03.2023
Number of active measurement configuration
Available space on the memory card
Date and time (DD:MM:YY, HH:MM:SS)
or
Voltage - 5 inputs
L1, L2, L3, N, PE
MAX. 760 V
1000 V
AC:
or
RMS
DC:
±760 V
or
±1000 V
referred to ground
Current - 4 inputs
Flexible probes:
F-xA1: 1...1500 A AC
F-xA: 3...3000 A AC
F-xA6: 6...6000 A AC
Hard clamps:
C-4A: 0.1...1000 A AC
C-5A: 0.5...1000 A AC/DC
C-6A: 0.01...10 A AC
C-7A: 0.1...100 A AC
PQM-702 ● PQM-702T
PQM-710 ● PQM-711
PQM-703
PQM-703 ● PQM-711
Power supply indicator
GSM signal indicator
RMS
PQM-702T
3.7 V
4.4 Ah
External DC power
MAX. 127...760 V
External AC power
MAX. 90...760 V AC
MAX. 40...70 Hz
Advertisement
Table of Contents

Related Manuals for Sonel PQM-702


Summary of Contents for Sonel PQM-702
- Page 1 Sonel PQM-702 / 702T / 703 / 710 / 711 Power Quality Analyzers ● Quick Guide 3.7 V PQM-702 ● PQM-702T PQM-710 ● PQM-711 4.4 Ah PQM-703 PQM-703 ● PQM-711 PQM-702T v1.02 | 29.03.2023 External DC power MAX. 127…760 V...
- Page 2 Three steps to get results Getting started | Connecting the analyzer Prepare measurement configuration and send it to the meter ►page 2 Method 1. Choose a function requiring analyzer connection Install the analyzer and start the measurement ►page 6 Analyzer connection window will appear. ▪...
- Page 3 Getting started | Creating a measurement configuration Enter main settings. Measured network parameters Nominal voltage Nominal frequency Mains system Choice of probes and transducers Choice of current probes Voltage transducers settings Current transducers settings Measurement parameters Additional recording of U and I N-PE Averaging period Measurement triggering Events detection hysteresis (typical 2%) Current limit Enter recording parameters.
- Page 4 Getting started | Choosing the mains system Single-phase Split-phase ►U2 3-phase 4-wire (WYE with a neutral conductor) ►U2 ►U3 3-phase 3-wire (Delta) ►U23 ►U31 page 4 / 12...
- Page 5 Getting started | Adjusting transducer settings Measurement with transducers Activate Voltage trans- Depending on the type of measured network (WYE with neutral / Delta), enter transducers' parameters and the ducers, if the measure- nominal level of exceedings control. ment will not be carried out in a direct way. Mains type: WYE with neutral conductor For WYE+N type mains, tolerances, harmonics and Activate Current trans- exceedings are controlled according to phase-to-neu- ducers for connection:...
-
Page 6: Verify The Configuration
≥1 s. information on preset network parameters and analyzer status. Choose the desired con- figuration by pressing the assigned button use Sonel Analysis software (Control menu). Connect the analyzer to the measured mains Verify mains status and analyzer connection Voltage angles - phase succession (clockwise) angles of the range of ±30% of the theoretical values RMS voltages 0º, 120º, 240º... -
Page 7: Finish Recording
▪ security, Time synchronization status: GSM antenna ▪ reverse current direction on the probe. Tone notice sounds: ▪ according to GPS Power status use Sonel Analysis software. 3 short signals. ▪ according to RTC GSM modem status: ▪ ready (GPRS, EDGE, HSUPA, UMTS) ▪ off After each change, confirmation ▪... -
Page 8: Data Analysis
Data analysis Download data from the analyzer Choose the recording for analysis Analyze the data There are four menu options to help you analyze the data: ▪ General - general information on the On the top bar choose the time range if necessary. ▪ Connect the analyzer. measurements, ▪ Select menu Analysis. ▪ Measurements - analyze the measure- ments, generate reports and plots, ▪... -
Page 9: General Menu
Data analysis "General" menu "Measurements" menu The top screen is the view of the whole recording. Recording time Filter phases from which Choose data for analysis. and values. you want to analyze data. Choose the parameters for analysis. Choose the form of graph under menu Plots: Choosing a point in Events View event's details by line will cause the oscillo- ▪... -
Page 10: Harmonics And Interharmonics
Data analysis Time plot Creating reports Choose the plot form. The If the recording was made graph will open in a new to verify compliance with a window. particular standard, choose Report according to standard, to create appro- priate report. Harmonics and interharmonics Data export to CSV file Choose appropriate plot You can also export data to analyze harmonics or directly to CSV file. -
Page 11: "Events" Menu
Data analysis "Events" menu "Configuration" menu This menu contains the list of events that occurred during the recording. View, how the analyzer was set for the analysed recording. Using Plots button select the type of data presentation: ▪ value/duration, ▪ in the context of ANSI/CBEMA toleration curves, Under tab Recorder settings find ▪ waveform for oscillograms and analyzer details such as: plots. ▪ model, ▪ serial number, ▪ firmware version. Find the list of events marked in "General"... - Page 12 Find more information in the user manual and on our website www.sonel.pl/en...
Need help?
Do you have a question about the PQM-702 and is the answer not in the manual?
Questions and answers