Sonel PQM-702 User Manual
Power quality analyzers
Hide thumbs
Also See for PQM-702:
- Operating manual (179 pages) ,
- Quick manual (13 pages) ,
- User manual (112 pages)
Table of Contents
Advertisement
Quick Links
Download this manual
See also:
Operating Manual
Advertisement
Table of Contents
Troubleshooting

Related Manuals for Sonel PQM-702


Summary of Contents for Sonel PQM-702
- Page 1 USER MANUAL POWER QUALITY ANALYZERS PQM-702 PQM-702T PQM-703 PQM-710 PQM-711 SONEL SA Wokulskiego 11 St. 58-100 Świdnica, Poland Version 1.25 12.12.2017...
- Page 2 Due to continuous product development, the manufacturer reserves the right to make changes to functionality, features and technical parameters of the analyzers. This manual describes the firm- ware version 1.25 and the Sonel Analysis v4.1.0 software.
-
Page 3: Table Of Contents
Buttons ......................19 Switching the analyzer ON/OFF ..............19 Auto-off ......................19 Screens ......................20 Verifying the connection ................25 "Sonel Analysis" software ................25 PC connection and data transmission ............26 2.7.1 USB communication ................... 27 2.7.2 Radio communication via OR-1 .......... - Page 4 2.14 Notification of analyzer changed location ............. 60 2.15 Key lock ......................61 2.16 Sleep mode ....................61 2.17 Temperature protection ................61 2.18 Emergency time setting ................61 Design and measurement methods ............ 63 Voltage inputs ....................63 Current inputs ....................63 Digital integrator ...................
- Page 5 5.5.1 Total Interharmonic Distortion ................99 Mains signalling ..................100 Unbalance ....................101 Voltage dips, swells and interruptions ............103 Transients and overvoltages............... 105 5.10 CBEMA and ANSI curves ................107 5.11 Averaging the measurement results ............109 Technical data ..................112 Inputs ......................
- Page 6 Other Information ................137 Cleaning and maintenance ................. 137 Storage ....................... 137 Dismantling and utilization ................137 Manufacturer ....................137...
-
Page 7: General Information
1 General Information 1 General Information The icon with the analyzer name is placed next to sections of the text that refer to specific features of the analyzer, particularly to availabil- ity/unavailability of a given function. All other parts of the text relate to all types of the analyzer. The following international symbols are used on the analyzer and in this manual: Warning;... -
Page 8: Safety
PQM-702(T), PQM-703, PQM-710, PQM-711 User Manual Safety Warning To avoid electric shock or fire, you must observe the following guidelines: Before you proceed to operate the analyzer, acquaint yourself thoroughly with the pre- sent manual and observe the safety regulations and specifications provided by the pro- ducer. -
Page 9: General Characteristics
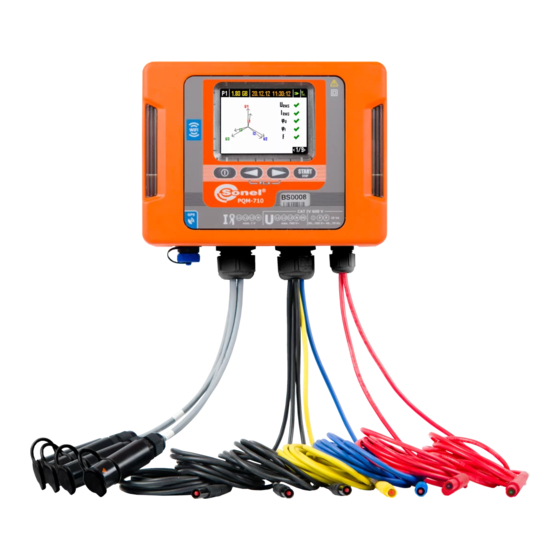
1 General Information General characteristics Power Quality Analyzers PQM-702(T), PQM-703, PQM-710 and PQM-711 (Fig. 1) are high- tech devices providing their users with a comprehensive features for measuring, analyzing and re- cording parameters of 50/60 Hz power networks and power quality in accordance with the European Standard EN 50160. - Page 10 The terminal for connecting the probe is in the pass together with current probe terminals and it is marked with the letter "T". Unless stated otherwise, in the following part of the manual, all sections referring to PQM-702 analyzer also apply to PQM-702T.
- Page 11 The user interface includes a color 3.5" LCD display with a resolution of 320x240 pixels and a keypad with four buttons. The full potential of the device may be released by using dedicated PC software "Sonel Analy- sis". The analyzer may communicate with a PC in the following ways: ...
-
Page 12: Power Supply Of The Analyzer
The analyzer is supplied with a dedicated tablet, which is pre-configured to work with the meter. After the tablet is turned on, it activates Sonel Analysis software, which auto- matically finds assigned to the analyzer. The tablet acts as an Access Point, which is used to con- nect the analyzer through wireless transmission (Wi-Fi). -
Page 13: Tightness And Outdoor Operation
Due to the characteristics of the built-in lithium-ion rechargeable battery, the process of charging is blocked when the battery temperature is outside the range of -10C…60C (in such case, Sonel Analysis software indicates charging status as "charging suspended"). Fig. 3. Fasteners for bands (for mounting the analyzer on a pole) -
Page 14: Mounting On Din Rail
PQM-702(T), PQM-703, PQM-710, PQM-711 User Manual Mounting on DIN rail The device is supplied with a bracket for mounting the analyzer on a standard DIN rail. The bracket must be fixed to the back of the analyzer with the provided screws. The set includes also positioning catches (in addition to fasteners for mounting the analyzer on a pole), which should be installed to increase the stability of the mounting assembly. - Page 15 1 General Information mains signaling voltage in the frequency band of 5...3000 Hz. Some of the parameters are aggregated (averaged) according to the time selected by the user and may be stored on a memory card. In addition to average value, it is also possible to record minimum and maximum values during the averaging period, and to record the instantaneous value occurring at the end of aggregation period.
- Page 16 PQM-702(T), PQM-703, PQM-710, PQM-711 User Manual Phase voltage change events Checking the "Phase change" box activates the detection of sudden changes in the voltage waveform phase. The detection algorithm compares the angles of the fundamental voltage compo- nent of two or three neighboring periods. If the difference in angles is greater than the user-defined threshold expressed in degrees, information about the detection of the event is recorded along with the measured value of the phase angle change.
- Page 17 1 General Information Tab. 2. Measured parameters for different network configurations. 3-phase delta Network type, 1-phase split-phase 3-phase wye with N, 3-phase wye without N, channel Ʃ L1/A L2/B L3/C N Ʃ L12/AB L23/BC L31/CA Ʃ Parameter L1/A N L1/A L2/B N ...
-
Page 18: Compliance With Standards
Built-in real time clock, which is set from "Sonel Analysis", RTC accuracy after GPS signal loss - better than ±0.3 s/day Compliant with IEC 61000-4-30 Class A of the measurement method and uncer-... -
Page 19: Operation Of The Analyzer
2 Operation of the analyzer 2 Operation of the analyzer Buttons The keyboard of the analyzer consists of four buttons: ON/OFF , LEFT , RIGHT , START/STOP . To switch-on the analyzer, press ON/OFF button. Directional buttons LEFT and RIGHT are used primarily to change the information screens. The screens change circu- larly, i.e. -
Page 20: Screens
PQM-702(T), PQM-703, PQM-710, PQM-711 User Manual Screens Note Screens count is device dependent. PQM-702 and PQM-703 have 9 screens, whereas PQM-710 and PQM-711 have 10 screens. Fig. 5 presents the first screen displayed by the analyzer. The bar in the upper part is a perma- nent element, shown independent of the selected screen. - Page 21 2 Operation of the analyzer Screen 2 is shown in Fig. 6. It shows the measured values of RMS voltages and currents within the tested system and the mains frequency. The frequency value is displayed in orange when there is no PLL synchronization or when the analyzer is working on the internal generator (e.g.
- Page 22 PQM-702(T), PQM-703, PQM-710, PQM-711 User Manual Screen 5 (Fig. 9) indicates THD factors in voltage and current. The factors shown on this screen are related to the fundamental component. Fig. 9. Screen 5 with THD factors. On screen 6 (Fig. 10) Power Factors (PF) are presented along with tan (i.e. the ratio of reactive power to active power).
- Page 23 2 Operation of the analyzer Fig. 12. Screen 8. start-time of the last recording, or the start-time of the next scheduled recording interval in the scheduled recording mode, end-time of the last recording (when recording is in progress dashes are displayed), or the end- time of the next scheduled recording interval in the scheduled recording mode, ...
- Page 24 PQM-702(T), PQM-703, PQM-710, PQM-711 User Manual Fig. 13. Screen 9 with information on the measurement point settings. Screen 10 displays the current status of the wireless Wi-Fi connection. Using this screen, you can read: radio signal level – indicated by icon , where the number of green fields represents the signal level from 0 –...
-
Page 25: Verifying The Connection
) – the icon channels I and I indicates an error in current vectors. "Sonel Analysis" software "Sonel Analysis" is an application required to work power analyzers of PQM series. It enables the user to: configure the analyzer,... -
Page 26: Pc Connection And Data Transmission
upgrade the software and the device firmware to newer versions. Detailed manual for "Sonel Analysis" is available in a separate document (also downloadable from the manufacturer's website www.sonel.pl). PC connection and data transmission The analyzer provides three ways of communication with a PC. They are as follows: ... -
Page 27: Usb Communication
USB is an interface that is continuously active and there is no way to disable it. To connect the analyzer, connect USB cable to your PC (USB slot in the device is located on the left side and is secured with a sealing cap). Before connecting the device, install "Sonel Analysis" software with the drivers on the computer Transmission speed is 921.6 kbit/s. -
Page 28: Communication Via Gsm Network
2.12.2. If the analyzer is configured correctly it will attempt to connect to the GSM network and then to the Internet. The analyzer will now be visible on the Internet with assigned IP number. The device will wait for incoming connections using port 4001. Such connection may be established by "Sonel Analysis"... -
Page 29: Taking Measurements
2 Operation of the analyzer Connecting to the analyzer via the Internet requires a Wi-Fi router properly configured by the network administrator. The analyzer, which has no access point within its range, remains in scanning mode of 2.4 GHz Wi-Fi band. Note Connecting to the analyzer via the Internet requires a Wi-Fi router properly configured by the network administrator. -
Page 30: Start / Stop Of Recording
Before you start recording, it is necessary to configure the selected measurement point, to per- form the recording process according to your requirements. The configuration is carried out using Sonel Analysis software. The analyzer is supplied from the factory with sample configurations, which are described in details in the manual for Sonel Analysis. - Page 31 2 Operation of the analyzer recording acc. to user configuration, recording for compliance with the standard (EN 50160 or other), dual recording, allowing user to perform parallel measurement according to user configuration and regardless of compliance with the standard. Recording by user configuration provides flexibility in selecting parameters to be recorded.
-
Page 32: Approximate Recording Times
PQM-702(T), PQM-703, PQM-710, PQM-711 User Manual 2.8.4 Approximate recording times The maximum recording time depends on many factors such as the size of the allocated space on a memory card, averaging time, the type of system, number of recorded parameters, waveforms recording, event detection, and event thresholds. -
Page 33: Measuring Circuits
2 Operation of the analyzer Measuring circuits The analyzer may be connected directly to the following types of networks: 1-phase (Fig. 16) 2-phase (split-phase) with split-winding of the transformer (Fig. 17), 3-phase 4-wire wye with a neutral conductor (Fig. 18), ... - Page 34 It may be verified by conducting an active power measurement - in most types of passive receivers active power is positive. When probes are incorrectly connected, it is possible to change their polarity using "Sonel Analysis" software. When measuring overvoltages (transients) is also required, remember that the analyzer measures them in relation to PE input.
- Page 35 2 Operation of the analyzer Fig. 16. Wiring diagram – single phase. Fig. 17. Wiring diagram – split-phase.
- Page 36 PQM-702(T), PQM-703, PQM-710, PQM-711 User Manual Fig. 18. Wiring diagram – 3-phase wye with a neutral conductor. Fig. 19. Wiring diagram – 3-phase wye without neutral conductor.
- Page 37 2 Operation of the analyzer Fig. 20. Wiring diagram – 3-phase delta. Fig. 21. Wiring diagram – 3-phase delta (current measurement using Aron method).
- Page 38 PQM-702(T), PQM-703, PQM-710, PQM-711 User Manual Fig. 22. Wiring diagram – 3-phase wye without neutral conductor (current measurement using Aron method). Fig. 23. Wiring diagram – indirect system with transducers – wye configuration.
-
Page 39: Example Of Use
('step by step'): from connecting the device to generating the measurement report. It provides guidelines how to quickly start to operate the analyzer and Sonel Analysis software. It is assumed that Sonel Analysis software is already installed. The example assumes the use of PQM-703 analyzer. - Page 40 Run "Sonel Analysis" program. Step 4a: If after launching Sonel Analysis the Startup window is displayed, select Set up and recording and then Advanced analyzer settings - move to 4c (below). Step 4b: When Startup window is not displayed, click "Analyzer settings" button on the toolbar of Sonel Analysis or select AnalyzerSettings from the menu.
- Page 41 2 Operation of the analyzer tree). The following items should be displayed after expanding: Standard, Voltage, Current, Power and energy, Harmonics, Interharmonics. Fig. 25. Main settings of the measurement point. To change the main settings of the measurement point, single-click Configuration1 1 at Local panel.
- Page 42 PQM-702(T), PQM-703, PQM-710, PQM-711 User Manual Adjust settings at Voltage card and Basic tab, as shown in Fig. 26. Fig. 26. Settings for 'Voltage' card in scenario 1. At Additional card select only the average value for the frequency, and uncheck other boxes.
- Page 43 2 Operation of the analyzer Step 11: Stop recording and upload data for the analysis. Display Control window (if not open yet). Click red button Stop. Click Analysis icon on the toolbar (or select AnalyzerAnalysis from the menu), to open the window for loading previously recorded data for analysis. The window shows four bars of memory used for each of the measurement points.
-
Page 44: Time Synchronization
PQM-702(T), PQM-703, PQM-710, PQM-711 User Manual settings, therefore when the analyzer detects any event, the last column of the table (with Waveform header) should include a graph icon. Click it to display the graphs. 2.11 Time Synchronization 2.11.1 Requirements of IEC 61000-4-30 The analyzer has a built-in GPS receiver, whose main purpose is to synchronize the analyzer clock with an atomic clock signal distributed via GPS satellites. -
Page 45: Time Resynchronization
2 Operation of the analyzer 2.11.4 Time resynchronization As the availability of the GPS signal cannot be guaranteed on a permanent basis, it is necessary to ensure proper management of internal time when the GPS signal becomes available and when it differs from the internal time of the analyzer. -
Page 46: Modem Configuration
Internet. "Sonel Analysis" software while searching for analyzers, tries to connect to those analyzers that have IP number configured in the data base (additionally the user must enable "TCP/IP over GSM" in program settings). Only port 4001 of a remote host is checked by default. - Page 47 2 Operation of the analyzer To configure missing parameters required to perform GSM transmission, the user must re- connect PC to the analyzer via USB and choose OptionsAnalyzer database from the program. In the analyzer database enter the option for editing the analyzer settings (click the line with the serial number of appropriate analyzer and click Edit).
-
Page 48: Checking Gsm Connection
If status screen <8/9> shows the status of GSM modem as "Ready, <connection type>", it means that a connection from a remote PC may be performed via Internet. The user may perform a test connection to verify the connectivity with "Sonel Analysis”: ... -
Page 49: Wi-Fi Communication Mode
2 Operation of the analyzer Problem: When a SIM card is inserted into the analyzer, message "Invalid IP" is displayed. Possible cause: IP number assigned by the network is different than the one configured in the analyzer. Solution: Check whether the analyzer database includes the correct IP number, as specified by the provider. - Page 50 PQM-702(T), PQM-703, PQM-710, PQM-711 User Manual The tablet may work with multiple analyzers. This requires adding them to the analyzer data- base, see chapter 2.13.4 and chapter 2.13.5. Fig. 28. Factory configuration. Direct connection: tablet analyzer. Fig. 29. Direct connection: tablet multiple analyzers.
- Page 51 The analyzer, which has no access point within its range, remains in scanning mode of 2.4GHz Wi-Fi band. Remote connection of Sonel Analysis software via Wi-Fi is possible, when this mode is active in software settings (Software Configuration Active Media, Fig. 32).
-
Page 52: Factory Configuration
IP assigned automatically by the access point: 192.168.173.X (where X is in the range of 2…254), gateway 192.168.173.1. WPA encryption is active, the key is the same as SSID Sonel Analysis software (tablet version) is installed on the tablet and starts automatically after turning it on. Fig. 32. Choosing active connection types 2.13.3 Enabling / disabling / configuring the Wi-Fi access point in the tablet. - Page 53 Wi-Fi. changing the software actions at the startup. Sonel Analysis may operate in one of two modes. Default setting is: Paired. This automatically connects the program with the factory paired analyzer after the program is started. Paired device field shows the serial number of the paired analyzer.
-
Page 54: Configuring Wi-Fi Connection Via Usb Connection
PQM-702(T), PQM-703, PQM-710, PQM-711 User Manual Note In order to enable the connection between the analyzer and the access point in the tablet, the analyzer needs the same name SSID and Key en- tered, see chapter 2.13.4. 2.13.4 Configuring Wi-Fi connection via USB connection To properly configure the connection, the following elements will be required: ... - Page 55 2 Operation of the analyzer Fig. 35. Example configuration of Wi-Fi connection for direct or local network communication Select the method for assigning IP address. In case of manual mode – enter appropriate values into fields: IP Address , Net Mask and Gateway. In automatic mode, select DHCP. ...
-
Page 56: Editing The Wi-Fi Settings In The Analyzer Database In The Absence Of Usb Connection
PQM-702(T), PQM-703, PQM-710, PQM-711 User Manual Fig. 36. Example Wi-Fi configuration for communicatin via Internet 2.13.5 Editing the Wi-Fi settings in the analyzer database in the absence of USB connection The following procedure applies to cases when the analyzer was previously configured, and there is a need to add it to the database or to edit Wi-Fi parameters that identify the device. -
Page 57: Checking Wi-Fi Connection
If status screen <10> shows the Wi-Fi status as "Ready", it means that a connection may be performed from a remote PC (tablet). The user may perform a test connection to verify the connec- tivity with "Sonel Analysis": In the program settings, check whether the search of the analyzers via Wi-Fi is enabled: select OptionsProgram configurationMedia settingsActive media. - Page 58 PQM-702(T), PQM-703, PQM-710, PQM-711 User Manual IP addresses of the analyzer do not match the address entered into the database of ana- lyzers (Internet connection). Fields External IP Address and External Port are active in the database of analyzers, in case of direct connection tablet ...
-
Page 59: Transferring Data From The Tablet To A Desktop Computer
2 Operation of the analyzer Too much interference in the channel used for the transmission. Solution: Connect the analyzer via USB cable or GSM network and enable Wi-Fi transmission in the analyzer (Fig. 34) Turn on a Wi-Fi access point and wait until the analyzer connects to it. On screen <10> Wi- Fi status is "Ready". -
Page 60: Notification Of Analyzer Changed Location
100 m. SMS message contains the actual coordinates of the analyzer. Also "Sonel Analysis" enables user to connect user to the ana- lyzer via GSM to check the analyzer current location on the status screen (even when the analyzer is turned off - see below). -
Page 61: Key Lock
Li-Ion battery. When the battery is discharged after activation of the meter, the time will be reset. To allow further work in the absence of access to a computer with Sonel Analysis software when it is impossible to synchronize the time with GPS time, the analyzer after starting detects the wrong time and enables its manual setting. - Page 62 PQM-702(T), PQM-703, PQM-710, PQM-711 User Manual - hh - hour - mm - minutes - ss - seconds To set the time: - use buttons you can change the value of the selected parameter (holding down the button will automatically increase the value) - use button you can scroll successive parameters;...
-
Page 63: Design And Measurement Methods
3 Design and measurement methods 3 Design and measurement methods Voltage inputs The voltage input block is shown in Fig. 40. Two measurement blocks are shown: on the right side of terminals main voltage circuits are presented - they are used for majority of voltage meas- urements. -
Page 64: Signal Sampling
PQM-702(T), PQM-703, PQM-710, PQM-711 User Manual decade. The phase shift is constant over the entire frequency range and is equal to 90°. Theoretically infinite gain for DC signal, when present at integrator input, causes the input sat- uration close to the supply voltage and prevents its further work. In practical systems, a solution is introduced to limit the gain for DC signals to some fixed value. -
Page 65: Frequency Measurement
3 Design and measurement methods the reference frequency required to clock the ADC. The need for the phase-locked loop results directly from the requirements of IEC 61000-4-7 standard, which describes the methodology and acceptable errors when measuring harmonics. This standard requires that the measuring window (which is the basis for a single measurement and evaluation of the harmonics) is equal to the duration of 10 mains cycles for 50 Hz systems and 12 cycles for 60 Hz systems. -
Page 66: The Method For Measuring Interharmonics
PQM-702(T), PQM-703, PQM-710, PQM-711 User Manual The analyzer collects 2048 samples per measurement window (for 50 Hz and 60 Hz), thus it fulfills the requirement for FFT stating that the number of samples subject to transformation equals a power of 2. -
Page 67: Measurement Of Ripple Control Signals
3 Design and measurement methods Fig. 42. Determining interharmonics subgroups (50 Hz system) Each interharmonic subgroup is the sum of RMS for seven (for 50 Hz mains) or nine (for 60 Hz mains) spectral lines obtained by Fourier transform. The exception is zero subgroup, i.e. sub-har- monic subgroup that contains one line more - 5Hz. - Page 68 (recording of these channels will end up at the same time as the recording in the first channel triggered by the first event), "Sonel Analysis" software marks these events as "Transient *". Waveforms for the channel that triggered the first event, they will always appear with the other channels that triggered later event.
-
Page 69: Threshold Method
3 Design and measurement methods 3.10.1 Threshold method Threshold method is chosen by selecting Threshold (in voltage settings of the measurement point) and setting the threshold voltage in the range from 50 V to 5000 V. In this method, the ana- lyzer detects a transient after it exceeds the pre-set amplitude in volts. -
Page 70: Event Detection
PQM-702(T), PQM-703, PQM-710, PQM-711 User Manual power factor and cos , tan and K-factor, current unbalance. Zeroing is highlighted in live mode and in analysis. In order to distinguish between the actual measured value from zeroed value of reset parameter, the following rules apply: ... - Page 71 3 Design and measurement methods (n = 2…50) voltage TID Voltage interharmonics amplitudes ih50 (n = 0…50) current TID Current interharmonics amplitudes ih50 (n = 0…50) K-Factor , UR Mains signalling Voltage transients applies to U voltage N-PE...
-
Page 72: Methods Of Parameter's Averaging
PQM-702(T), PQM-703, PQM-710, PQM-711 User Manual To eliminate repeated event detection, when the value of the parameter oscillates around the threshold value, the analyzer has a function of user-defined event detection hysteresis. It is defined as a percentage value in the following manner: ... -
Page 73: Calculation Formulas
4 Calculation formulas �� ������ = ∑ �� �� �� ��=1 where: X is subsequent parameter value to be averaged, N is the number of values to be averaged. 4 Calculation formulas One-phase network One-phase network Parameter Method of calculation Designa- Name Unit... - Page 74 PQM-702(T), PQM-703, PQM-710, PQM-711 User Manual is fundamental component of current I = √ �� �� − �� − �� Budeanu distortion power �� �� �� ���� = �� Power Factor If PF < 0, then the load is of a generator type If PF >...
- Page 75 4 Calculation formulas ������ | �� �� ������ = �� �������� where the operator ������ | �� | expresses the highest abso- Voltage crest factor �� lute value of voltage U samples i = 2048 for 50 Hz and 60 Hz ������...
-
Page 76: Split-Phase Network
PQM-702(T), PQM-703, PQM-710, PQM-711 User Manual �� ( �� ) ��(��) �� = ∑ �� ����+ ��+ ��=1 ( �� ) ������ �� ( �� ) > 0 �� �� �� �� (��) = { ��+ ( �� ) ≤ 0 0 ������... - Page 77 4 Calculation formulas Total reactive power of �� = �� + �� 1������ 1 �� 1�� 1tot fundamental component �� = �� + �� Total apparent power ������ �� �� Total apparent distortion �� = �� + �� �������� ���� ����...
-
Page 78: 3-Phase Wye Network With N Conductor (3-Phase, 4-Wire)
PQM-702(T), PQM-703, PQM-710, PQM-711 User Manual i is subsequent number of the 10/12-period measure- ment window, (i) represents reactive power Q calculated in i-th 1tot 1tot measuring window, T(i) represents duration of i-th measuring window (in hours) �� ( �� ) ��(��) ��... - Page 79 4 Calculation formulas power �� ������ ���� Total Power Factor ������ �� �� Total displacement cos �� = ������ (cos �� + cos�� + cos�� ������ ������ �� �� °�� power factor �� ������ �������� ������ �� Total tangent ...
-
Page 80: 3-Phase Wye Without N Conductor And Delta Networks
PQM-702(T), PQM-703, PQM-710, PQM-711 User Manual √ 3 ��120° �� = 1�� = − �� √ 3 ��240° �� = 1�� = − − �� �� Voltage zero sequence �� ∙ 100% �� unbalance ratio �� Voltage negative se- ��... - Page 81 4 Calculation formulas �� �� �� (∑ �� �� + ∑ �� �� ������ ������ ���� ������ ���� �� ��=1 ��=1 where: is a subsequent sample of voltage U Total active power is a subsequent sample of voltage U is a subsequent sample of current I is a subsequent sample of current I M = 2048 for 50 Hz and 60 Hz ��...
-
Page 82: Power Quality - A Guide
PQM-702(T), PQM-703, PQM-710, PQM-711 User Manual 5 Power quality - a guide Basic information The measurement methodology is mostly imposed by the power quality standards, mainly IEC 61000-4-30. This standard, introducing precise measurement algorithms, ordered analyzers mar- ket, allowing customers to easily compare the devices and their results between the analyzers from different manufacturers. -
Page 83: Probes For Measuring Alternating And Direct Currents (Ac/Dc)
5 Power quality - a guide This type of current transformer has several distinguishing features. It may be used to measure very high currents and its power consumption is low. Magnetizing current causes a phase shift (tenth of a degree), which may introduce an error in power measurement (especially at low power factor). -
Page 84: Flexible Probes
It is the high precision which results in a relatively high price of such probes. The user may connect the analyzer to the following flexible probes offered by Sonel S.A.: ... -
Page 85: Power Measurement
5 Power quality - a guide that this phenomenon causes discomfort, irritation, sometimes headache, etc. The luminous inten- sity fluctuations must have a specified frequency, they cannot be too slow, as the human pupil is able to adapt to changes in illumination; they cannot be too fast because the filament inertia elimi- nates these fluctuations almost totally. -
Page 86: Reactive Power
PQM-702(T), PQM-703, PQM-710, PQM-711 User Manual The basic formula for calculating the active power is as follows: ��+�� ∫ �� ( �� ) �� ( �� ) ���� �� = �� �� where: u(t) – instantaneous voltage value, i(t) - instantaneous current value, T - period for which the power is calculated. - Page 87 5 Power quality - a guide types of power the standard mentions are active power, apparent power and – attention – non- active power designated as N. Reactive power has been limited only to the fundamental component and marked as Q This standard is the last document of this type issued by recognized organization which was to put the power definition issues in order.
- Page 88 PQM-702(T), PQM-703, PQM-710, PQM-711 User Manual And then, is really D a measure of such distortion? Unfortunately, also in this case the Bude- anu’s power theory fails. It has been proven that the distortion power may be equal to zero in a situation when voltage is distorted in relation to current waveform, and vice versa, the distortion power may be non-zero at total absence of distortion.
-
Page 89: Reactive Power And Three-Wire Systems
5 Power quality - a guide This component explains the situation in which an unbalanced three-phase load of a purely resistive character results in the power factor less than one. Such receiver has no reactive power Q, and still the results from the power triangle S, P, Q are totally different (the Budeanu’s power theory with its distortion power could not explain this situation either –... -
Page 90: Reactive Power And Reactive Energy Meters
PQM-702(T), PQM-703, PQM-710, PQM-711 User Manual marks are justified here, as such virtual zero will provide quite correct results only when the unbal- ance of the receiver is minimal. In any other case, an indication of reactive power from such device should be treated very cautiously. -
Page 91: Apparent Power
5 Power quality - a guide methods. For example, they may measure active and apparent power, and then calculate the reac- tive power from the power triangle (square root from the sum of both such powers squared). In reality, taking into account IEEE 1459-2000 standard, they measure the non-active power, not the reactive power. -
Page 92: Distortion Power D
PQM-702(T), PQM-703, PQM-710, PQM-711 User Manual It is based on the effective values of voltage and current, and the power is called the effective apparent power (for this reason, index "e" is used in marking three-phase systems). Those effective voltage and current values are such theoretical values which represent voltage and current in an energetically equivalent three-phase balanced system. -
Page 93: Power Factor
5 Power quality - a guide the effective voltages of fundamental components are substituted. In single-phase systems to calculate the distortion apparent power, a simpler formula may be used: − ( �� �� = √�� �� �� where U and I are effective values of the fundamental components of phase-to-neutral voltage and current. - Page 94 PQM-702(T), PQM-703, PQM-710, PQM-711 User Manual And everything went well until the appearance of odd harmonic orders which are multiples of 3 (third, ninth, etc.). Suddenly, the neutral conductor began overheating and the measurement showed very high RMS current. Explanation of this phenomenon is quite simple. In this example,...
-
Page 95: Harmonics Active Power
5 Power quality - a guide 5.4.1 Harmonics active power Decomposing receiver voltage and current to harmonic components enables using more de- tailed analysis of energy flow between the supplier and the consumer. We assume that the power quality analyzer is connect between the voltage source and the receiver. -
Page 96: Harmonics Reactive Power
PQM-702(T), PQM-703, PQM-710, PQM-711 User Manual 5.4.2 Harmonics reactive power The harmonics reactive power values may be calculated in a similar manner as the active power values: �� = �� �� sin �� ℎ ℎ ℎ ℎ Knowledge of reactive power harmonics is valuable information used in the development of reactive parallel compensators of reactive power. -
Page 97: Total Harmonic Distortion
5 Power quality - a guide for 'k' being any integer: Sequence Harmonic order positive "+" 3k +1 3k – 1 negative "–" zero "0" The even order harmonics do not appear when a given waveform is symmetrical in relation to its average value, and this is the case in majority of power supply systems. -
Page 98: Interharmonics
PQM-702(T), PQM-703, PQM-710, PQM-711 User Manual from measuring limitations of the device. As the analyzer is capable of measuring the harmonic components up to the 50th order, the harmonics of the 50th or 40th order are used to calculate THD... -
Page 99: Total Interharmonic Distortion
5 Power quality - a guide saturation of magnetic cores by subharmonic components (e.g. transformers, motors, etc.). The interaction of higher harmonics and interharmonics may also lead to unexpected phenom- ena such as beating-in at low frequencies. For example, ninth harmonic (450 Hz) with interharmonic of 460 Hz frequency generates the effect of beating-in at the frequency of 10 Hz, despite the fact that in this frequency spectrum a component of this frequency is not present. -
Page 100: Mains Signalling
PQM-702(T), PQM-703, PQM-710, PQM-711 User Manual Mains signalling Ripple control signals are signals entered into the electricity network in order to control and check of remote control devices connected to the same network. In addition to the transmission of electricity, a distribution network is in this case used as a transmission medium for communication between devices. -
Page 101: Unbalance
5 Power quality - a guide reach a few km, while there is a strong correlation between the type of modulation, bit rate and achieved distances. At the same time, standardization works are in progress to use of higher frequencies (above 148.5 kHz to tens of MHz) for the purpose of short-distance data transmission. - Page 102 PQM-702(T), PQM-703, PQM-710, PQM-711 User Manual These phenomena are particularly dangerous for three-phase motors, in which even a slight voltage unbalance can cause current unbalance that is many times larger. In such situation, the motor torque is reduced, heat losses in windings increase, and mechanical wear is faster. The un- balance also has an unfavorable effect on power supply transformers.
-
Page 103: Voltage Dips, Swells And Interruptions
5 Power quality - a guide A measure of the system unbalance which is widely used in the power generation is the negative sequence and zero sequence unbalance (formulas are for voltage): �� �� ∙ 100% �� �� �� ∙ 100% ��... - Page 104 PQM-702(T), PQM-703, PQM-710, PQM-711 User Manual Fig. 49. Voltage swells, dips and interruptions Interruption is a state during which U voltage is lower than the specified interruption RMS(1/2) threshold. The interruption threshold is usually set much below the voltage dip level, at approx.
-
Page 105: Transients And Overvoltages
5 Power quality - a guide values are determined in 1 period during crossing through zero of the fundamental voltage RMS(1/2) component - they are refreshed every half-period, independently for each voltage channel. It means that these values will be obtained at different times for different channels. Fig. 50 shows the method for determining RMS values at two voltage phases. - Page 106 For example, to be included into measurement category IV 600 V (the category of PQM-702 and PQM-703 analyzers), the devices must be immune to impulses of 1.2 μs/50 μs with 8 kV amplitude, applied directly between test terminals at source impedance of 2 Ω.
-
Page 107: Cbema And Ansi Curves
5 Power quality - a guide often accompanied by the sparking on contacts. The voltage generated at the switch contacts ex- ceeds boundary voltage of the dielectric and spark-over occurs, which may be repeated, until the gap is too big for breakdown. Transients may also be propagated in different ways between network segments, e.g. - Page 108 ANSI (American National Standards Institute). Both curves are pre- sented in Fig. 53. "Sonel Analysis" software provides the ability to modify the characteristic points of the curves allowing user to adjust them to individual requirements.
-
Page 109: Averaging The Measurement Results
5 Power quality - a guide 5.11 Averaging the measurement results Mains monitoring over a longer period means that a significant amount of data needs to be collected. To ensure that such data analysis is possible at all, it is necessary to introduce the mech- anisms for reducing data size to the values acceptable by both, people and machines. - Page 110 PQM-702(T), PQM-703, PQM-710, PQM-711 User Manual Averaging with times less than 10 seconds is somewhat different. Although, they are all ex- pressed in time units (200 ms, 1 s, 3 s, 5 s), in reality they are measured in multiples of the mains period.
- Page 111 5 Power quality - a guide Selecting the right averaging time is not easy. To a large extent it depends on the type of dis- turbance in the system and the user's expectations for the final data analysis. A frequent situation is that we know only that there is a problem in the mains, and the measurements with the analyzer will only help us identify the cause.
-
Page 112: Technical Data
PQM-702(T), PQM-703, PQM-710, PQM-711 User Manual 6 Technical data Specifications are subject to change without prior notice. Recent revisions of technical documen- tation are available at www.sonel.pl. Basic uncertainty is the uncertainty of a measurement instrument at reference conditions specified Tab. -
Page 113: Sampling And Rtc
6 Technical data Sampling and RTC Sampling and RTC A/D converter 16-bit 10.24 kHz for 50 Hz and 60 Hz Sampling rate Simultaneous sampling in all channels Samples per period 204.8 for 50 Hz; 170.67 for 60 Hz PLL synchronization 40..70 Hz Reference channel for PLL L1/A (default;... -
Page 114: Voltage
PQM-702(T), PQM-703, PQM-710, PQM-711 User Manual Example: Basic uncertainty for RMS voltage measurement is ±0.1% U within ambient temp. range of 0C…+45C. at -20C, measurement uncertainty is ±0.18% U (multiplier 1.8) at -10C, measurement uncertainty is ±0.14% U (multiplier 1.4) -
Page 115: Frequency
6 Technical data CT probes C-5(A) 0..1000 A 0.01% I Additional uncertainty (±3600 A 0.5..100 A: ≤ (1.5% + 1 A) 100..800 A: ≤ 2.5% 800..1000 A AC: ≤ 4% 800..1400 A DC: ≤ 4% CT probes C-6(A) Additional uncertainty 0..10 A 0.01% I 0.01..0.1 A: ... -
Page 116: Interharmonics
PQM-702(T), PQM-703, PQM-710, PQM-711 User Manual 6.4.7 Interharmonics Range and condi- Interharmonics Resolution Basic uncertainty tions Harmonic (n) 0..50, grouping: interharmonics subgroups acc. to IEC 61000-4-7 (subharmonic additionally takes into account 5 Hz bin) 0.05% U amplitude 0..200% U 0.01% U if m.v.<1% U... -
Page 117: Estimating Measurement Uncertainty Values For Power And Energy
Tab. 8 shows the phase error between voltage and current harmonics for analyzers (without probes and transducers). Tab. 8. Phase error of PQM-702/703/710/711 analyzers, depending on the frequency. Phase difference error Frequency range 40..70 Hz... - Page 118 PQM-702(T), PQM-703, PQM-710, PQM-711 User Manual Example Calculation of measurement uncertainty of active power fundamental component. Conditions: = 60 = 5% I Basic uncertainty is ± √ 1.0 + �� ��ℎ For the frequency range of 40..70 Hz, phase error of the analyzer is less ...
-
Page 119: Flicker
6 Technical data 6.4.11 Flicker Flicker Range and conditions Resolution Basic uncertainty 0,2…10 5% within the values presented in (10 min.) 0.01 ≥ 80% U (2 h) for U tables of IEC 61000-4-15 standard 6.4.12 Unbalance Unbalance (voltage Range and conditions Resolution Basic uncertainty and current) -
Page 120: Event Detection - Voltage And Current Rms
PQM-702(T), PQM-703, PQM-710, PQM-711 User Manual Event detection - voltage and current RMS voltage Range Resolution Basic uncertainty (swells, dips, interruptions) 0.2% U 0.0%...150.0% U 0.01% U RMS(1/2) Detection thresholds Set by the user in percentage or absolute values. Event detection based (1-period RMS refreshed every ½... -
Page 121: Event Detection Hysteresis
6 Technical data Apparent energy E (max) Depending on the con- Checked every 10/12 cycles figuration 0…100% Total harmonic distortion of voltage Basing on 10/12-cycle value THD-F (max) 0…200% Total harmonic distortion of current Basing on 10/12-cycle value THD-F (max) Voltage harmonic amplitudes 0 ... - Page 122 PQM-702(T), PQM-703, PQM-710, PQM-711 User Manual Instanta- Mean Minimum Maximum Recorded parameters neous value value value value RMS phase/phase-to-phase voltage (depending on the type of system) U RMS phase-to-phase voltage (only 3-phase wye system with N and 2-phase system) U ...
-
Page 123: Power Supply, Battery, Heater
48 VA / 18 W transient measurement enabled, supply voltage 500…690 VAC Rechargeable battery Type Li-Ion 4.4 Ah PQM-702, PQM-710: > 2 h Operating time on battery PQM-703, PQM-711: > 1,5 h Battery charging time (fully discharged bat- < 8 h tery) -10C …+60C... -
Page 124: Supported Networks
NOTE: Clamps with letter 'A' at the end of marking (e.g. F-3A) are clamps with automatic type detection in com- patible devices. Other parameters are the same as in the case of clamps without automatic clamp type detection. Automatic clamp type detection is available in analyzers: PQM-702/703/710/711 with HWg hardware and later and with firmware 1.30 or later. -
Page 125: Environmental Conditions And Other Technical Data
IEC 61000-4-5 Immunity to surges Amplitude 2 kV (L-L), 4 kV (L-PE) IEC 61000-6-3 PQM-702, PQM-710, class B: 30…230 MHz, 30 dB(V/m) at 10 m 230…1000 MHz, 37 dB(V/m) at 10 m Emission of radiated RF disturbances PQM-703, PQM-711, class A: 30…230 MHz, 40 dB(V/m) at 10 m... -
Page 126: Standards
PQM-702(T), PQM-703, PQM-710, PQM-711 User Manual EN 55022 Compliance statement: PQM-703 and PQM-711 are class A products. In a domestic environment these products may cause radio interference in which case the user may be required to take adequate measures (e.g. increasing distance between affected devices). -
Page 127: Equipment
mains plug with banana inputs (L1/A and N) for connecting the analyzer to socket in order to charge the battery – WAADAAZ1, software for data reading and analyzing Sonel Analysis, USB cable – WAPRZUSB, band for mounting the device on a pole (2 pcs) – WAPOZOPAKPL, ... -
Page 128: Optional Accessories
flexible probes (Rogowski coil) F-3A for current up to 3kA AC (length:45cm) – WACEGF3AOKR, – Li-Ion rechargeable battery (replaceable by SONEL after-sale services) WAAKU11, hard case for current probes – WAWALL2, external GPS antenna 10 m – WAPOZANT10GPS, ... - Page 129 7 Equipment Note Currents above 1200 A must not be measured. The measurement time for currents above 1000 A shall be limited as follows: I 1000 A 1000 A I 1200 A Current range Operation mode continuous 15-minute measurement, then 30-minute break For frequency f ...
-
Page 130: A) Current Probe
Make sure the jaws are closed and there is no conductor inside them. Then, connect the probe to the analyzer and launch the “Sonel Analysis” software in the instantaneous val- ues viewing mode (check if the measurement point is correctly configured for measure-... - Page 131 7 Equipment Reference conditions Temperature: +18…+28°C Humidity: 20…75% RH Battery voltage: 9 V ± 0.1 V Conductor position: conductor centered in jaws Current: direct (DC) or sinusoidal (AC) f ≤ 65 Hz Continuous magnetic field: earth field (<40 A/m) ...
-
Page 132: A) Current Probe
PQM-702(T), PQM-703, PQM-710, PQM-711 User Manual Other data insulation type: double, according to IEC 61010-1 measuring category acc. to IEC 61010-1: III 600 V, protection rating acc. to IEC 60529: IP 30 power supply: 9 V battery (6LR61, 6LF22, NEDA 1604) ... -
Page 133: A) Current Probe
7 Equipment Alternating magnetic field: none Conductors in direct vicinity: no flowing current Technical specification Accuracy Basic uncer- Current range Phase error tainty 3% + 1 mA 0.01…0.1 A not specified 2.5% 5 0.1…1 A ... -
Page 134: A), F-2(A), F-3(A) Current Probes
PQM-702(T), PQM-703, PQM-710, PQM-711 User Manual Reference conditions temperature: +18…+28°C relative humidity: <85% (non-condensing) Technical data 0…100 A AC test range frequency range 40 Hz..3 kHz maximum allowable continuous current 100 A AC (50/60 Hz) ... - Page 135 7 Equipment The arrow located on the closing unit indicates the current flow direction. It is assumed that the current is flowing in the positive direction if it is flowing from the source to the receiver. Such probe orientation is required for a correct power measurement. Clamps with letter 'A' at the end of marking (e.g.
-
Page 136: External Active Gps Antenna
PQM-702(T), PQM-703, PQM-710, PQM-711 User Manual 7.3.6 External active GPS antenna frequency: 1575.42 GHz polarization: RHCP LNA gain: 26 dB (3 V) VSWR: <1.2:1 dimensions (without cable): 14.0 × 34.2 × 38.2 mm operating temperature: -40C…+85C... -
Page 137: Other Information
Before the equipment is sent to a collection point, do not dismantle any elements. Observe local regulations concerning disposal of packages, waste batteries and accumulators. Manufacturer The manufacturer of the device and provider of guarantee and post-guarantee services: SONEL SA Wokulskiego 11 St. 58-100 Świdnica Poland... - Page 138 Notes...
Need help?
Do you have a question about the PQM-702 and is the answer not in the manual?
Questions and answers