
Related Manuals for Sonel PQM-707


Summary of Contents for Sonel PQM-707
- Page 1 USER MANUAL POWER QUALITY ANALYZER PQM-707 SONEL S.A. Wokulskiego 11 58-100 Świdnica, Poland Version 1.17.1 05.02.2019...
- Page 2 Thank you for purchasing the PQM-707 power quality analyzer. Please acquaint yourself with this manual to avoid measuring errors and prevent possible prob- lems related to the operation of the meter.
-
Page 3: Table Of Contents
CONTENTS 1 General Information ................... 7 1.1 Safety ........................7 1.2 General characteristics ..................8 1.3 Power supply of the analyzer ................9 1.4 Measured parameters ..................10 1.5 Compliance with standards ................11 2 Operation of the analyzer ................ 13 2.1 Switching the analyzer ON/OFF ................ - Page 4 2.12.4 Phasor diagram ......................74 2.12.5 Harmonics graph/table ....................75 2.13 Operation with PC ..................... 77 2.13.1 "Sonel Analysis" software ..................77 2.13.2 PC connection and data transmission ............... 77 2.14 Wiring diagrams ....................78 2.14.1 Verifying the connection .................... 83 2.15 Example of use ....................
- Page 5 5.1.3 Flexible current probes ................... 106 5.2 Flicker ......................107 5.3 Power measurement ..................107 5.3.1 Active power ......................108 5.3.2 Reactive power ....................... 108 5.3.3 Reactive power and three-wire systems ..............111 5.3.4 Reactive power and reactive energy meters ............112 5.3.5 Apparent power ......................
- Page 6 8 Other Information ................... 147 8.1 Rechargeable battery ..................147 8.2 Replacing rechargeable batteries ..............147 8.3 Positions of the meter’s cover ................. 148 8.4 Cleaning and maintenance................148 8.5 Storage ......................149 8.6 Dismantling and disposal ................149 8.7 Manufacturer ....................149 8.8 Laboratory services ........
-
Page 7: General Information
1 General Information 1 General Information The following international symbols are used on the analyzer and in this manual: Warning; Alternating voltage/ See explanation in Functional earth terminal current manual Conforms to relevant Direct voltage/ Double Insulation European Union direc- current (Protection Class) tives (Conformité... -
Page 8: General Characteristics
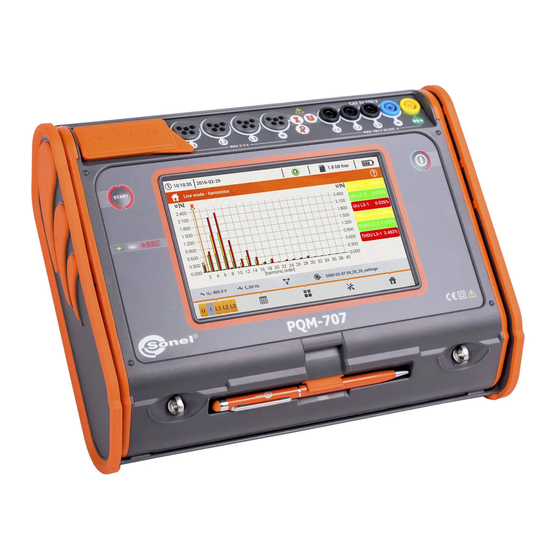
Repairs may be performed only by an authorized service point. General characteristics PQM-707 (Fig. 1) is a mobile, 3-phase Power Quality Analyzer, providing its users with features for measuring, analysing and recording parameters of 50/60 Hz power networks and power quality in accordance with the European Standard EN 50160 and other standards. -
Page 9: Power Supply Of The Analyzer
This type of charging works only when the analyzer is completely switched off (not in sleep mode). Additional or new battery pack used for PQM-707 (Li-Ion 11.1 V, 3.4 Ah) may be purchased at our store or in Sonel distribution network. -
Page 10: Measured Parameters
Event detection may be accompanied by recording waveforms of voltage and current wave- forms and RMS values. These waveforms are recorded at the beginning and end of the event. Tab. 1 presents a summary of parameters measured by PQM-707, depending on the mains type. -
Page 11: Compliance With Standards
1 General Information Total harmonic distortion THD U voltage Total harmonic distortion THD I current Active energy (consumed ... - Page 12 PQM-707 user manual Tab. 2. Summary of selected parameters in terms of their compliance with the standards IEC 61000-4-30 Class S: Basic measurement time for parameters (voltage, current, harmonics, unbal- ance) is a 10-period interval for 50 Hz power supply system and 12-period in-...
-
Page 13: Operation Of The Analyzer
2 Operation of the analyzer 2 Operation of the analyzer Switching the analyzer ON/OFF The analyzer may be switched-on by pressing button . Starting the meter from the completely inactivated status takes about thirty seconds. The screen displays the version of the software and the boot-up progress is indicated by a bar at the bottom part of the screen. -
Page 14: Microsd Memory Card
Before removing the card from the meter (e.g. to read the data by Sonel Analysis by using external card reader) it is recommended to turn the meter off, to save all cached data. -
Page 15: Main Elements Of The Screen
2 Operation of the analyzer Main elements of the screen Fig. 2 shows the default screen of the analyzer after switching on. There you can distinguish several sections: top bar the title and help bar main window ... -
Page 16: The Title Bar And Help
PQM-707 user manual compliance of mains parameters with the measurement configuration. More information can be found in section 2.14.1. Recording status icon . The icon is green when recording is inactive. After starting the re- cording of the icon turns red. -
Page 17: Menu Bar
2 Operation of the analyzer - 3-phase 4-wire system, - 3-phase 4-wire (no U L2) / 2 ½ element (no V L2/B), - transducers: 3-phase 4-wire, - 3-phase 3-wire system, - 3-phase open delta, - transducers: 3-phase 3-wire, - 3-phase 3-wire Aron / 2-elements, - transducers: 3-phase 3-wire Aron (2 PTs, 2-Elements) - DC system, - DC+M system. -
Page 18: Recording Configuration
Configuration changes are performed directly in the analyzer and it is (at the moment) the only possible way to configure the device - Sonel Analysis software in its current version (4.3.0) does not support the configuration of PQM-707 analyzer. - Page 19 2 Operation of the analyzer Menu bar functions To make the desired configuration active, click its line, and then on the bottom bar select icon (activate the configuration). To modify the indicated configuration, in the bottom bar select icon (editing) or double-click the line of this configuration.
- Page 20 PQM-707 user manual Regulation of the Minister of Economy: provisions valid in Poland in four variants depending on the nominal voltage value (low, medium, high 110 kV and 220 kV, high 400 kV) Two variants of an Australian Standard (based on EN 50160 and AS 61000.3.100),...
-
Page 21: Recording Configuration - General Settings
2 Operation of the analyzer 2.7.1 Recording configuration – General settings Screen of General settings is shown in Fig. 6. Fig. 6. Recording configuration – General settings At this point, you may define: AINS TYPE . By clicking the icon from drop-down list, or on the network name, you can select the following types (the names may differ depending on the language selected –... - Page 22 PQM-707 user manual 4-wire). The second value determines the phase-to-phase voltage in such systems and nomi- nal phase-to-phase voltage in systems without neutral conductor (3-phase 3-wire) REQUENCY – mains nominal frequency. There are three positions: 50 H 60 H –...
-
Page 23: Recording Configuration - General Settings Ii
2 Operation of the analyzer 2.7.2 Recording configuration – General settings II Screen of General settings II is shown in Fig. 7. It consists of the following fields: RIGGERING : specifies the method of starting the recording. Immediate – starts recording after pressing START, Threshold –... -
Page 24: Recording Configuration - Voltage Parameters
PQM-707 user manual N-PE voltage – ticking this box results in recording also parameters of voltage chan- nel N-PE (as for other voltage channels). N-conductor current – ticking this box results in recording the current in the neu- tral conductor. It is necessary to connect the probes in channel N. -
Page 25: Recording Configuration - Current Parameters
2 Operation of the analyzer VOLTAGE VOLTAGE (depending on the type of network) - selection boxes for recording RMS voltage phase-to-neutral and phase-to-phase. Minimum and maximum val- ues are searched from RMS values (RMS 1-cycle value refreshed every half-cycle). The user may select the following fields: Minimum Maximum... -
Page 26: Recording Configuration - Powers
PQM-707 user manual – recording current Crest Factor. You may record: REST FACTOR Minimum Average Maximum CURRENT – recording RMS current, Available options: Minimum Average Maximum Minimum and maximum values in the averaging period are searched from all the RMS values, as in the case of the RMS voltage. -
Page 27: Recording Configuration - Energy And Power Factors
2 Operation of the analyzer It is possible to activate the recording of minimum, average and maximum values for the following power types: CTIVE POWER EACTIVE OWER EACTIVE OWER (for IEEE 1459) or (for Budeanu method), ISTORTION POWER ISTORTION POWER (for IEEE 1459) or (for Budeanu method),... -
Page 28: Recording Configuration - Flicker And Unbalance
PQM-707 user manual 2.7.7 Recording configuration – Flicker and unbalance Flicker and unbalance Configuration screen is shown in Fig. 12. On this screen the user may enable the following parameters: – P HORT TERM FLICKER SEVERITY factor is calculated every 10 minutes. -
Page 29: Recording Configuration - Thd, Tdd And Harmonics
2 Operation of the analyzer 2.7.8 Recording configuration – THD, TDD and harmonics The last screen of recording configuration is THD, TDD and harmonics (Fig. 13, Fig. 14). It allows user to activate recording of the following parameters: THD U ... -
Page 30: Configuration Default Settings
PQM-707 user manual Fig. 14. Recording configuration – harmonic powers. 2.7.9 Configuration default settings The default configuration settings ac. to the user are as follows: Mains type: 3-phase 4-wire, Nominal frequency: 230/400 V (phase/phase-to-phase) (120/208 V for US language settings), ... -
Page 31: Start / Stop Of Recording
2 Operation of the analyzer The default configuration settings acc. to standard are as follows: Selected standard: EN50160 low voltage, Mains type: 3-phase 4-wire, Nominal frequency: 230/400 V (phase/phase-to-phase), Nominal frequency: 50 Hz, Current measurements and probes: activated current measurement with automatic probes, ... -
Page 32: Approximate Recording Times
PQM-707 user manual depends e.g. on the averaging time, recording time, mains type and number of measured pa- NALYZER rameters), you must ensure a free space by deleting previous recordings (go to F SETTINGS ILES Recording takes the name of measurement configuration, which is active at the time of its trig- gering and there is no possibility to change it later. -
Page 33: Analyzer Settings
2 Operation of the analyzer Analyzer settings NALYZER SETTINGS After selecting section in the main screen, the screen shown in Fig. 15 will be displayed. In this part of the meter interface, a series of screens is available for configuring many aspects of the analyzer operation. -
Page 34: Analyzer Settings - Settings
PQM-707 user manual Fig. 16. Analyzer settings - Memory. 2.8.2 Analyzer settings – Settings ETTINGS Section is divided as follows: EGIONAL ETTINGS – on this screen (Fig. 17) you may select: Language, Method for marking subsequent phases (L1, L2, L3, or A, B, C), The colours assigned to each voltage and current channel in the interface. - Page 35 2 Operation of the analyzer Fig. 17. Analyzer settings - Regional settings. OWER SAVING – the user can activate the Auto-off mode of the analyzer after a specified period of time (if no recording is on), and specify whether the meter is to be turned off completely or enter suspend mode.
-
Page 36: Analyzer Settings - Managers
PQM-707 user manual 2.8.3 Analyzer settings – Managers ANAGERS Section includes: TANDARDS – after selecting this option, a window is displayed, as shown in Fig. 18. This window shows a list of standards profiles stored in the internal memory of the analyzer that are used to generate the compliance reports. - Page 37 2 Operation of the analyzer Fig. 19. Analyzer settings - File manager. The following elements are specified in next table columns: – the icon representing the file type. It consists of the following types: - recording file acc. to a standard ...
- Page 38 The user should follow the on-screen prompts. The second option of updating is the use of Sonel Analysis software. Fig. 20. Analyzer settings - Update manager.
-
Page 39: Recording Analysis
2 Operation of the analyzer Recording analysis PQM-707 allows user to perform a simplified analysis of the recorded data, using the device itself, without additional software. The scope of the analysis includes: general preview of the recording - start and end time, the number of recorded events, in- cluding their type, average values of voltages and currents, ... -
Page 40: Recording Summary Window
PQM-707 user manual The table columns present: TYPE of recording – the icon indicating recording type: - recording according to user configuration, - recording for compliance with the standard, - inrush recording. NAME of the recording, which is the same as the name of the configuration, according to which the recording was made, ... -
Page 41: Timeplots - Selecting The Time Range
2 Operation of the analyzer The screen of the recording summary (Fig. 22) shows: recording configuration name start and end times of recording and its duration (if recording is still in progress - the end time is not shown), the free space on the memory card and the estimated time to fill the space by the recorded data ... - Page 42 PQM-707 user manual The time range from which the user wants to plot the timeplots of parameters may be determined in two ways: using the sliders . Grasp the corresponding slider and drag it, setting individual the be- ginning and end of the interval;...
-
Page 43: Timeplots - Selecting Data
2 Operation of the analyzer 2.9.4 Timeplots – selecting data After selecting desired time range and clicking the icon for parameter selection window will appear as shown in Fig. 24. Fig. 24. Recording analysis - selecting parameters for the timeplot. The specific parameter is selected in 3 steps: ... - Page 44 PQM-707 user manual (apparent power) cosφ (Displacement Power Factor) (Power Factor) tanφ NERGY (active energy consumed) (active energy supplied) (reactive energy consumed) (reactive energy supplied) (apparent energy) ARMONICS THD U (voltage Total Harmonic Distortion) 1…U (voltage harmonics of 1..50) ...
-
Page 45: Timeplots Of Parameters - Timeplot Window
2 Operation of the analyzer 2.9.5 Timeplots of parameters – timeplot window After clicking icon in the selection screen data, a timeplot is generated showing changes in time of specified parameters (Fig. 25). Fig. 25. Recording analysis - timeplot. On the right side of the chart the following items are shown: - start time of the whole plot, - end time of the whole plot, - time range of the timeplot (total),... -
Page 46: Generating Report On Compliance With Standard
PQM-707 user manual are not unified, only one waveform with unit assigned to the axis is scaled to the indicated scale and its plot is adjusted to the size of the window – other waveforms, even having the same unit, are not scaled. - Page 47 2 Operation of the analyzer Fig. 27. Recording analysis - options of the report according to standard. / 50 – PTIONS HARMONICS HARMONICS : the user indicates the number of harmonics shown in the report. You can select 25 or 50 harmonics. The criterion to meet the require- ments of the standard is in line with the standard guidelines and independent on number of harmonics indicated in this place.
- Page 48 PQM-707 user manual YNCHRONOUS . The standards provide a separate quality criteria on frequencies for these two types of connections. OTES : In this field you can type additional text, which will be included in "Note" section of the report.
-
Page 49: Report According To Standard - Description
Standard EN 50160 divides distribution networks, depending on the nominal voltage into three groups: Low voltage networks (LV) with voltages U ≤ 1 kV (in PQM-707 the profile for such net- works is "EN 50160 (low voltage)"), Medium voltage networks (MV): 1kV < U ≤... -
Page 50: Section General Information
Tab. 4 lists the quality parameters included in standard EN 50160 and the criteria for their evaluation for the low and medium voltage (parameters measured by PQM-707). It should be noted that these criteria relate to the normal operation of the network, excluding periods of power interruptions and other anomalies, e.g. - Page 51 2 Operation of the analyzer Tab. 4. Power quality criteria according to EN 50160 for the low voltage networks (up to 1kV) and medium voltage networks (36 kV). Basic param- Parameter eter meas- Criterion urement time Slow changes in voltage - 10 minutes For LV networks: RMS voltage...
-
Page 52: Section Frequency
PQM-707 user manual To check whether the RMS voltage meets the stated requirements, proceed as follows: 1. all measured voltage samples are sorted from the lowest [1] the highest [N] 2. it is checked whether the maximum value (i.e. percentile 100%, sample with [N] index) is in... -
Page 53: Section Voltage
2 Operation of the analyzer 2.9.7.4 Section VOLTAGE Section VOLTAGE includes detailed statistical information on the criteria for RMS voltage (phase voltage in systems with neutral conductor and phase-to-phase voltage in 3-phase 3-wire systems). The first part of the table, provides the percentage values of samples (percentiles), which meet the criteria (Values within tolerance) for both of the defined tolerance ranges (column Tolerance). -
Page 54: Section Higher Order Harmonics
PQM-707 user manual 2.9.7.8 Section HIGHER ORDER HARMONICS Section HIGHER ORDER HARMONICS includes statistics and measurements for individual harmonics for which the standard defines level limits (usually harmonics of 2..25) and Total Har- monic Distortion factor THD-F. If a value is not within the limits, it is displayed in red with an addi- tional asterisk (*). -
Page 55: Section Additional Information
2 Operation of the analyzer 2.9.7.12 Section ADDITIONAL INFORMATION Section ADDITIONAL INFORMATION is present in reports generated for compliance with the Polish Regulation of the Minister of Economy, when currents and 15-minute power values were measured. In such cases the following additional parameters are also recorded: ... - Page 56 PQM-707 user manual Fig. 29. Recording analysis – list of events. The table contains the following columns: of event: dip, interruption, swell, I > max, I < min, U > max, I > max. OURCE of event: channel where the event occurred, ...
- Page 57 2 Operation of the analyzer example of window for voltage dip waveform is shown in Fig. 30. The right panel shows the data of the event: start time, end time, duration and the values for the cursor. Similarly as for the other charts, the options are available for zooming in/out the chart area (also by double-click) and selection of displayed channels, etc.
- Page 58 PQM-707 user manual Fig. 31. Recording analysis – ANSI graph. - CBEMA graph. It shows the graph of voltage events according to CBEMA criteria. Description of the graph and its properties are similar to ANSI chart (see above). An exam- ple of screen with similar diagram is shown in Fig.
-
Page 59: Energy Cost Calculator
2 Operation of the analyzer 2.9.10 Energy cost calculator When the parameters recorded by the analyzer include active energy E (see energy recording settings, sec. 2.7.6 and Fig. 11), it is possible to calculate the energy costs acc. to the cost calculator set by the user. -
Page 60: Settings Of The Energy Cost Calculator
PQM-707 user manual 2.9.10.1 Settings of the energy cost calculator. The settings of the cost calculator may be easily modified to fit individual needs. The energy cost calculator in the analyzer allows you to calculate costs for two tariffs: ... - Page 61 2 Operation of the analyzer Time intervals of the day corresponding to A, B and C zones are set on the second screen with settings (Fig. 35). Colours of time intervals on the second screen match the colours of billing rates on the first screen.
-
Page 62: Generating Report On Compliance With Standard Nec220.87
PQM-707 user manual 2.9.11 Generating report on compliance with standard NEC220.87 Selecting icon on the recording summary screen, results in moving to the screen for generating report on compliance with the standard NEC220.87. This screen is shown in Fig 36. - Page 63 2 Operation of the analyzer IRCUIT BREAKER RATING IN : nominal breaker current of circuit breaker for existing installation under test. Could be nominal breaker current of circuit breaker which will be used for this installation.. EVICE NOMINAL CURRENT : nominal current of new device in installation After setting the parameters of the report, it may be generated by clicking icon in the bottom...
-
Page 64: Inrush Current
(characteristics and nominal current values) in order to protect the system and its users in the event of a failure, but at the same time to prevent accidental tripping of the breaker during the start-up of the devices. PQM-707 analyzer allows user to quickly and easily measure inrush currents, providing the information about: ... - Page 65 2 Operation of the analyzer – duration of recording from the triggering (exceeding the current thresh- ECORDING TIME old) may be selected from the following times: 5s, 10s, 15s, 20s, 25s, 30s, 60s. Fig. 39. Inrush current configuration screen. ...
-
Page 66: Inrush Current Measurement And Analysis
PQM-707 user manual - entering the list of saved configurations of inrush current and creating a new configuration. Configurations of the inrush current are presented similarly as the measuring configurations (see Fig. 4), they have their own icon . Double-click on a selected configuration will open it automat- ically and the inrush current configuration screen (Fig. - Page 67 2 Operation of the analyzer Fig. 41. Inrush current - waiting for triggering the measurement. After the time elapses, the recording process ends and the analyzer automatically starts the analysis of measured inrush parameters, displaying the timeplot with current waveforms for the entire recording interval.
- Page 68 PQM-707 user manual The window with a waveform of inrush current is similar to windows showing other plots. On the right side you may find the time of starting, ending and duration of the plot, the marker parameters and the buttons of active current channels, which indicate the current value at the marker point and allow user to enable and disable the display of individual channels.
-
Page 69: About Analyzer
2 Operation of the analyzer Fig. 44. Inrush current - characteristic parameters. 2.11 About analyzer After selecting this section, a window is displayed with basic information about the software version of the analyzer and with manufacturer's details. Clicking on icon in the menu bar displays detailed information about the version of the analyzer. -
Page 70: Waveforms Of Voltages And Currents
PQM-707 user manual HOLD In this mode refreshing of the display can be temporarily blocked by using the function (see the top bar description in section 2.6.1). Clicking the button pauses the refreshing (the icon color switches to red). Tapping the button for the second time re-enables refreshing (the icon color switches to black). -
Page 71: Timeplot Of Rms Values
2 Operation of the analyzer - zoom-in icon. Click it to open an additional menu bar with icons for zooming-in the graph horizontally and vertically. Holding the zooming icon for 2 seconds results in the maximum zoom-in/out. - zoom-in horizontally - zoom-out horizontally - zoom-in vertically - zoom-out vertically... -
Page 72: Live Mode - Tabular View
PQM-707 user manual 2.12.3 Live mode – tabular view To view a table with values of mains parameters, select icon in the main screen. After selecting it, the summary table is displayed with the values of the tested mains, refreshed in real time. - Page 73 2 Operation of the analyzer S [VA] – apparent power, SN [VA] D [var] – apparent distortion power or Budeanu distortion power (depending on the method of calculating the reactive power), EP+ [Wh] – active energy consumed, EP- [Wh] – active energy supplied, EQ1+ EQB+ [varh] –...
-
Page 74: Phasor Diagram
PQM-707 user manual 2.12.4 Phasor diagram The view of the phasor diagram is opened when you select icon in the main screen. Phasor graph (e.g. in Fig. 48) shows the basic layout of component vectors of voltages and currents. It may be used to quickly verify the correctness of connecting the analyzer to the network. -
Page 75: Harmonics Graph/Table
2 Operation of the analyzer 2.12.5 Harmonics graph/table The last view of the Live mode presents harmonics. This view is selected by clicking icon from the main screen. This screen allows you to view the harmonics of voltages and currents, angles between the current and voltage harmonics, cosφ... - Page 76 PQM-707 user manual - icon for selecting the view type. It displays the additional menu, where you can change the view type of LIVE mode. - options menu for a chart or table. After selecting it, an additional menu bar is displayed, which provides several new options: - an option of hiding the fundamental harmonic.
-
Page 77: Operation With Pc
2 Operation of the analyzer 2.13 Operation with PC 2.13.1 "Sonel Analysis" software Sonel Analysis is an application used to work with power analyzers of PQM series. When used with PQM-707, it provides the following features: read data from the device, ... -
Page 78: Wiring Diagrams
PQM-707 user manual 2.14 Wiring diagrams The analyzer may be connected directly to the following types of AC networks: single-phase (Fig. 51) split-phase with split-winding of the transformer (Fig. 52), 3-phase 4-wire, 3-phase 4-wire (no U L2) / 2 ½ element (no V L2/B) (Fig. 53), ... - Page 79 2 Operation of the analyzer Fig. 51. Wiring diagram – single phase. Fig. 52. Wiring diagram – split-phase.
- Page 80 PQM-707 user manual Fig. 53. Wiring diagram – 3-phase 4-wire, 3-phase 4-wire (no U L2) / 2 ½ element (no V L2/B) systems. Fig. 54. Wiring diagram – 3-phase 3-wire, 3-phase open delta systems.
- Page 81 2 Operation of the analyzer Fig. 55. Wiring diagram – 3-phase 3-wire Aron, 2-element systems (current measurement using Aron method). Fig. 56. Wiring diagram – indirect measurement of MV in 3-phase 4-wire system.
- Page 82 PQM-707 user manual Fig. 57. Wiring diagram – indirect measurement of MV in 3-phase 3-wire system. Fig. 58. Wiring diagram – DC system.
-
Page 83: Verifying The Connection
2 Operation of the analyzer Fig. 59. Wiring diagram – DC+M system (bipolar). 2.14.1 Verifying the connection After clicking the button that is signalling the correct connection of the analyzer (see Fig. 3) a window is displayed showing some important information on the connection of the analyzer to the tested network. - Page 84 PQM-707 user manual Current vectors - correctness of vector angles is verified for the fundamental components of main currents in relation to the voltage vectors. The following icons are displayed: - vectors are within 55 in relation to angles corresponding to the voltage vec- tors, ...
-
Page 85: Example Of Use
The procedure presented below shows how to make a measurement with the analyzer ('step by step'): from connecting the device to generating the measurement report. It provides guidelines how to quickly start to operate the analyzer and Sonel Analysis software. It is assumed that Sonel Analysis software is already installed. - Page 86 PQM-707 user manual Step 4: Check the correctness of the connection. Go to the main screen (icon ), and then display the window with waveforms . The main window should present the instantaneous voltage waveforms (sine wave), and the button on the right side should indicate the value of the RMS voltage, which should be approximately 230 V i.e.
- Page 87 Analysis option. A window will be displayed with a list of available analyzers - the list should include one item with the detected PQM-707. Double click on the name of the analyzer to connect with it. After connecting, the analyzer screen will show window PC connection.
- Page 88 PQM-707 user manual contains the data recorded in the subsequent 10-minute interval and each column contains the individual parameters (all 10-second frequency values may be viewed after selecting '10s' from Display data list) After pressing Events you may view all the recorded events. In this scenario, the following voltage values were recorded: swell, dip and interruption.
-
Page 89: Design And Measurement Methods
The PQM-707 analyzer firmware includes a digital filter which is to remove totally the DC voltage component. The filtered signal is subjected to digital inte- gration. -
Page 90: Signal Sampling
PQM-707 user manual Ensuring the least possible phase shift between the voltage and current components is very important for obtaining small power measurement errors. It can be proven that approximate power measurement error can be described with the following relationship Power measurement error ≈... -
Page 91: Frequency Measurement
5 Hz. As the PQM-707 analyzer collects 2048 samples per measuring window (for 50 Hz and 60 Hz), this fulfills the requirement of Fast Fourier Transform that the number of samples subjected to trans- formation equals a power of 2. -
Page 92: Event Detection
The resultant amplitude is calculated with the RMS method. Event detection The PQM-707 analyzer gives a lot of event detection options in the tested mains system. An event is the situation when the parameter value exceeds the user-defined threshold. The fact of event occurrence is recorded on the memory card as an entry which includes: ... - Page 93 3 Design and measurement methods Example Event threshold for DC voltage has been set at 100 V. If the measured DC voltage goes below -100V, there will be detected an event of exceed- ing DC voltage value. Two parameter types: RMS voltage and RMS current can generate events for which the user can also have the waveforms record.
-
Page 94: Methods Of Parameter's Averaging
PQM-707 user manual Methods of parameter’s averaging Method of averaging parameter Parameter Averaging method RMS Voltage DC voltage, DC current arithmetic average Frequency arithmetic average Crest Factor U, I arithmetic average Symmetrical components U, I Unbalance factor U, I calculated from average values of symmetrical components... -
Page 95: Calculation Formulas
4 Calculation formulas 4 Calculation formulas Single-phase network Single-phase network Parameter Method of calculation Designa- Name Unit tion �� = √ �� ∑ �� �� �� �� Voltage (True RMS) ��=1 where U is a subsequent sample of voltage U M = 2048 for 50Hz and 60 Hz ��... - Page 96 PQM-707 user manual cos �� = ������ = cos(�� − �� �� �� where is an absolute angle of the fundamental com- Displacement power fac- ponent of voltage U is an absolute angle of the fundamental component of current I ��...
- Page 97 4 Calculation formulas �� �� = ∑ �� (��)��(��) ��+ ��=1 �� ( �� ) ������ �� ( �� ) > 0 �� (��) = { 0 ������ �� ( �� ) ≤ 0 �� �� = ∑ �� (��)��(��) ��−...
-
Page 98: Split-Phase Network
PQM-707 user manual �� = ∑ �� ( �� ) ��(��) �� �� ��=1 where: i is subsequent number of the 10/12-period measure- Apparent energy ment window S(i) represents apparent power S calculated in i-th measuring window T(i) represents duration of i-th measuring window (in... - Page 99 4 Calculation formulas �� �� = ∑ �� (��)��(��) ����+������ ��������+ ��=1 ( �� ) ������ �� ( �� ) > 0 �� �������� �������� �� (��) = { ��������+ ( �� ) ≤ 0 0 ������ �� �������� �� ��...
-
Page 100: 3-Phase 4-Wire Network
PQM-707 user manual 3-phase 4-wire network 3-phase 4-wire network (parameters not mentioned are calculated as for single-phase) Parameter Method of calculation Designa- Name Unit tion �� = �� + �� + �� Total active power ������ �� �� �� Total Budeanu reactive ��... - Page 101 4 Calculation formulas Total reactive energy of Q1+tot fundamental component varh formula same as in split-phase system Q1-tot (consumed and supplied) �� ( �� ) ��(��) �� = ∑ �� �������� �� ��=1 where: i is subsequent number of the 10/12-period measure- Total apparent energy Stot ment window...
-
Page 102: 3-Phase 4-Wire (No U L2) / 2 ½ - Element Network
PQM-707 user manual �� (�� + ���� + �� �� ��1 ��1 ��1 �� = ������(�� RMS value of positive current sequence where I are vectors of fundamental current components I Operator mag() indicates vector module �� (�� + ��... - Page 103 4 Calculation formulas �� = 3�� �� �� �� �� where: �� + �� + �� ���� ���� ���� = √ �� �� Total apparent power �� + �� + �� �� �� �� = √ �� �� Total reactive power (Bu- ��...
-
Page 104: Power Quality - A Short Guide
PQM-707 user manual 5 Power Quality - a short guide Basic Information The measurement methodology is mostly imposed by the energy quality standards, mainly IEC 61000-4-30. This standard, introducing precise measurement algorithms, ordered analyzers mar- ket, allowing customers to easily compare the devices and their results between the analyzers from different manufacturers. -
Page 105: Current Transformer Probes (Ct) For Ac Measurements
Despite such drawbacks, the CT probes are presently the most widely used non-invasive alter- nating current (AC) measurement method. The following CT probes can be used with the PQM-707 analyzers to measure alternating cur- rents: C-4(A), rated range 1000 A AC, ... -
Page 106: Flexible Current Probes
F-3(A), with coil circumference 45 cm. All these probes have identical electrical parameters. The peak current which can be measured after connecting to PQM-707 is about 10 kA (the limitation is due to the properties of the input channels, and not the probe itself). -
Page 107: Flicker
5 Power Quality - a short guide Flicker In terms of power quality, flicker means a periodical changes of the luminous intensity as a result of fluctuations of voltage supplied to light bulbs. The flicker measurement function appeared in the power quality analyzers when it turned out that this phenomenon causes a deteriorated well-being, annoyance, sometimes headache, etc. -
Page 108: Active Power
U is RMS voltage, I is RMS current, and is the phase shift angle between the voltage and the current. The PQM-707 analyzer calculates the active power directly from the integral formula, using sampled voltage and current waveforms: ��... - Page 109 5 Power Quality - a short guide The reactive power formula given above is correct only for one-phase sinusoidal circuits. The question thus arises: how do we calculate the reactive power in non-sinusoidal systems? This ques- tion opens a proverbial Pandora’s box among electrical engineers. It turns out that the reactive power definition in real systems (and not only those idealized) has been subject to controversy and now (2009) we do not have one, generally accepted definition of reactive power in systems with non-sinusoidal voltage and current waveforms, not to mention even unbalanced three-phase sys-...
- Page 110 PQM-707 user manual �� ( �� ) = ���� ( �� − �� ) the voltage is not distorted in relation to the current. In case of sinusoidal voltage and load which is any combination of RLC elements, this condition is always met (for sinusoidal waveforms, these elements maintain linearity).
-
Page 111: Reactive Power And Three-Wire Systems
5 Power Quality - a short guide three-phase systems, the power equation in such systems is as follows: �� = �� + �� + �� + �� �� �� is the scattered power which appears in the system as a result of changing load conductance with frequency. -
Page 112: Reactive Power And Reactive Energy Meters
PQM-707 user manual into such “black box”, there is an infinite number of variants of receiver internal structure which will give us identical measurement results of voltage and current values visible outside the black box. Then, how is it possible that there are reactive power meters intended for measurements in... -
Page 113: Apparent Power
5 Power Quality - a short guide Older, electromechanical meters have characteristics similar to that of a low-pass filter – higher harmonics are attenuated in such meters and the reactive power measurement in the presence of harmonics is very close to the value of reactive power of the fundamental component. Electronic meters which are more and more popular can perform the measurement with various methods. -
Page 114: Distortion Power D
PQM-707 user manual definition give correct value of the power factor. The only definition which did not fail in such a situation, was the definition proposed as early as in 1922 by German physicist F. Buchholz: �� = 3�� ��... -
Page 115: Power Factor
5 Power Quality - a short guide Effective current and effective voltage of the fundamental component (I and U respectively) are calculated similarly to I and U , but instead of RMS phase-to-neutral or phase-to-phase voltages, the effective voltages of fundamental components are substituted: −... - Page 116 PQM-707 user manual phase currents). Such observation has tempted many designers to obtains savings by installing the cabling in such systems with neutral conductor of a smaller cross section than in phase conductors. And everything went well until the appearance of odd harmonic orders which are multiples of 3 (third, ninth, etc.).
-
Page 117: Harmonics Characteristics In Three-Phase Systems
5 Power Quality - a short guide 5.4.1 Harmonics characteristics in three-phase systems In three-phase systems, the harmonics of given orders have a particular feature which is shown in the table below: Order Frequency [Hz] – – – Sequence (+ positive, –... -
Page 118: Thd
– RMS waveform. Limitation of the number of harmonics used to calculate THD is conventional and is caused mainly by measuring limitations of the device. Because the PQM-707 is capable of measuring the harmonic components up to the 50 order, the harmonics up to the 50 order are used to calculate THD. - Page 119 5 Power Quality - a short guide vectors can be resolved to three groups of vectors: positive sequence, negative sequence and zero sequence. Fig. 64. Example of determination of positive sequence component. As an example, let us use the calculation of voltage positive sequence component. ��...
-
Page 120: Detection Of Voltage Dips, Swells And Interruptions
PQM-707 user manual – zero sequence symmetrical component, – positive sequence symmetrical component, – negative sequence symmetrical component. The most convenient method to calculate the symmetrical components and unbalance is using the complex number calculus. The vectors parameters are amplitude of the voltage (current) fun- damental component and its absolute phase shift angle. -
Page 121: Cbema And Ansi Curves
5 Power Quality - a short guide During the interruption, the analyzer remembers the minimum recorded voltage and the average voltage value. Swell is a state of increased voltage. The swell threshold is usually set at the level close to 110% of U The swell starts at the mo- ment when the U... - Page 122 ANSI (American National Standards Institute). Both curves are pre- sented in Fig. 67. "Sonel Analysis" software provides the ability to modify the characteristic points of the curves allowing user to adjust them to individual requirements.
-
Page 123: Averaging The Measurement Results
10 minutes which gives “only” 1008 measurement results. Fig. 68 presents the method according to which the PQM-707 analyzer determines the average values at averaging intervals equal to or greater than 10 seconds with the 10-minute averaging time. - Page 124 PQM-707 user manual Fig. 69. Determining the averaging intervals shorter than 10 seconds (with the 3-second averaging). The method of average values determination for such periods is shown in Fig. 69. Here, we do not have synchronization with the real time clock. When a defined number of 10/12-period meas- urement is collected, the instantaneous averaging period is closed and a new one starts.
-
Page 125: Technical Specification
Technical specification is subject to change without prior notice. The latest revisions of technical documentation are available at www.sonel.pl. Basic uncertainty is uncertainty of a measuring instrument in reference conditions given in Table Given uncertainty values refer to the PQM-707 analyzer without additional transducers and probes. Abbreviations: ... -
Page 126: Sampling And Real Time Clock
PQM-707 user manual Sampling and real time clock Sampling and real time clock A/D converter 16-bit Sampling rate 10.24 kHz for 50 Hz and 60 Hz Simultaneous sampling in all channels Samples per period 204.8 for 50 Hz; 170.67 for 60 Hz PLL synchronization 40..70Hz... -
Page 127: Voltage
6 Technical specification Fig. 70. Basic uncertainty multiplier M as a function of ambient temperature (does not apply to the reference conditions). 6.3.3 Voltage Voltage Ranges and conditions Resolution Basic uncertainty 0.5% U ≤ U ≤ 120% U (AC+DC) 20% U 0.1% U ≥... -
Page 128: Frequency
PQM-707 user manual CT probes C-7(A) 0..100 A 0.01% I Additional uncertainty 0..100 A: (0.5% + 0.02 A) (45..65 Hz) (360 A 0..100 A: (1.0% + 0.04 A) (40..1000 Hz) 5% Crest Factor 1..10 (1… 3.6 for 0.01 ≥... -
Page 129: Estimating The Uncertainty Of Power And Energy Measurements
Tab. 10 presents the phase difference error between the voltage and current harmonics for the PQM-707 analyzer (without probes and transducers). Tab. 10. Phase error in the PQM-707 analyzer depending on the frequency Frequency range 0..200 Hz 200..500 Hz... - Page 130 = 60 = 5% I Fundamental uncertainty equals ± √ 2,5 + �� ��ℎ For the 0..200Hz frequency range, the PQM-707 phase error is < 1 . After substituting to the equation: ������ ( ��+���� ) ������(61°) �� = 100 (1 −...
-
Page 131: Flicker
6 Technical specification 6.3.9 Flicker Flicker Ranges and conditions Resolution Basic uncertainty 10% within the values presented in (10 min), 0.4 ... 10 0.01 ≥ 80% U (2 h) for U tables of IEC 61000-4-15 standard 6.3.10 Unbalance Unbalance Ranges and conditions Resolution Basic uncertainty (voltage and current) -
Page 132: Recording
PQM-707 user manual Recording Recording Averaging time 1 s, 3 s, 10 s, 30 s, 1 min, 10 min, 15 min, 30 min. Averaging min / max for U based on U RMS(1/2) Averaging min / max for I based on I... -
Page 133: Power Supply
6 Technical specification Power supply External power supply Nominal voltage range 100-240 V AC, 50-60 Hz Absolute maximum input voltage 90-264 V AC, 50-60 Hz Overvoltage category II 300 V Output voltage and current 12 V DC 2.5 A Output power 30 W max. -
Page 134: Supported Current Probes
PQM-707 user manual Supported current probes Types of supported current probes Model Ordering code Description F-1A WACEGF1AOKR Flexible probes (Rogowski coil), perimeter: 120 cm, measuring range 3000 A F-2A WACEGF2AOKR Flexible probes (Rogowski coil), perimeter: 80 cm, measuring range 3000 A... -
Page 135: Safety And Electromagnetic Compatibility
5 MHz…30 MHz: 60 dBV EN 55022 Compliance statement: PQM-707 is a class A product. In a domestic environment this product may cause radio interference in which case the user may be required to take adequate measures (e.g. increas- ing the distance between affected products). -
Page 136: Accessories
flexible probes F-3A (with automatic detection feature) for current up to 3kA AC (length:45 cm) (4 pcs) – WACEGF3AOKR, software for data reading and analysing Sonel Analysis, USB cable – WAPRZUSB, magnetic adapter (4 pcs); used to connect voltage wires to overvoltage switches type S and circuit breakers and RCDs in switchboards - WAADAUMAGKPL, ... - Page 137 7 Accessories C-6A CT probes (with automatic de- C-7A Hall effec probes (with automatic detection feature) 100 A AC – tection feature) for low currents in 10 A AC transformers – WACEGC6AOKR WACEGC7AOKR F-1A flexible probe (with automatic de- F-2A flexible probe (with automatic de- tection feature) with current up to 3 kA AC tection feature) with current up to 3 kA AC...
- Page 138 PQM-707 user manual AGT-63P (63A) adapter for 3-phase AGT-16T (16A) adapter for single- sockets – phase industrial sockets – WAADAAGT63P (five-wire version) WAADAAGT16T AGT-32T adapter (32A) for single- phase industrial sockets – WAADAAGT32T Test probe with banana socket - yel- Test probe with banana socket - blue low CAT III 1000V –...
-
Page 139: A) Probes
Probes with letter "A" in their marking (e.g. C-4A) may be auto- matically detected (their type) by compatible devices. PQM-707 operates with probes of this type. Fig. 72. C-4(A) probe. -
Page 140: A) Probes
This orientation of probes is required for the correct Fig. 73. C-5(A) probe. measurement of power and constant components. Probes with letter "A" in their marking (e.g. C-5A) may be automatically detected (their type) by compatible devices. PQM-707 operates with probes of this type. - Page 141 After making sure that the jaws are closed and there is no conductor between them, con- nect them to PQM analyzer and run "Sonel Analysis" software in the current preview mode (pay attention to correctly configure the measurement point for the measurement with probes C-5).
-
Page 142: A) Probes
PQM-707 user manual 1 Hz up to 5 kHz: 0.5 mVp-p (or 0.5 Ap- additional errors: due to current frequency: 65..440 Hz: 440..1000 Hz: -5% 1..5 kHz: -4 dB due to the battery voltage: ≤1A/V due to temperature: ... - Page 143 7 Accessories Probes with letter "A" in their marking (e.g. C-6A) may be automatically detected (their type) by compatible devices. PQM-707 operates with probes of this type. Note! Do not use non-insulated probes for conductors with a potential exceeding 600V with respect to the ground and in systems with the measurement category higher than III.
-
Page 144: A) Probes
This orientation of probes is required for the correct power measurement. Probes with letter "A" in their marking (e.g. C-7A) may be automati- cally detected (their type) by compatible devices. PQM-707 operates with probes of this type. Note! Fig. -
Page 145: Probes F-1(A), F-2(A), F-3(A)
Probes with letter "A" in their marking (e.g. F-3A) may be automatically detected (their type) by compatible devices. PQM-707 supports the probe of this type after selecting "Auto" probe type. Probes without auto-detection feature (e.g. F-3) are selected by choosing them 'manually' in the configuration of the type of connected probes (e.g. - Page 146 PQM-707 user manual Linearity: ±0.2% Additional error due to the position of the conductor: ±1% max. Additional error due to external magnetic field: ±0.5% max. Additional error due to temperature ±0.07% Output impedance: 30 /400 mm ...
-
Page 147: Other Information
8 Other Information Rechargeable battery PQM-707 is equipped with a Li-Ion battery pack 11.1 V 3.4 Ah. The battery pack includes a circuit monitoring its charge status, which provides precise level of battery pack charge and a tem- perature sensor. -
Page 148: Positions Of The Meter's Cover
PQM-707 user manual Fig. 79. Replacing the battery pack Positions of the meter’s cover The movable cover enables using the meter in various positions. 1 – cover as the bottom of the meter, 2 – cover used as a support, 3 –... -
Page 149: Storage
Before the equipment is sent to a collection point, do not dismantle any elements. Observe local regulations concerning disposal of packages, waste batteries and accumulators. Manufacturer The manufacturer of the device and provider of guarantee and post-guarantee service: SONEL S.A. Wokulskiego 11 58-100 Świdnica, Poland tel. +48 74 858 38 60 tel. -
Page 150: Laboratory Services
Institute. According to ILAC-G24 „Guidelines for determination of calibration intervals of measuring instru- ments”, SONEL S.A. recommends periodical metrological inspection of the instruments it manufac- tures no less frequently than once every 12 months. For new instruments provided with the Calibration Certificate or Validation Certificate at the factory, re-calibration should be performed within 12 months from the date of purchase, however, no later than 24 months from the date of purchase. - Page 151 8 Other Information NOTES...
- Page 152 PQM-707 user manual NOTES...
Need help?
Do you have a question about the PQM-707 and is the answer not in the manual?
Questions and answers