Sonel PQM-702 Operating Manual
Power quality analyzer
Hide thumbs
Also See for PQM-702:
- User manual (138 pages) ,
- Quick manual (13 pages) ,
- User manual (112 pages)
Table of Contents
Advertisement
Quick Links
Download this manual
See also:
User Manual
Advertisement
Table of Contents

Related Manuals for Sonel PQM-702


Summary of Contents for Sonel PQM-702
-
Page 1: Operating Manual
OPERATING MANUAL POWER QUALITY ANALYZER PQM-702 SONEL S. A. ul. Wokulskiego 11 58-100 Świdnica POLAND Version 1.03 28.06.2013... - Page 2 PQM-702 Operating manual...
-
Page 3: Table Of Contents
Sleep mode ....................26 Auto-off ......................26 Notification of analyzer changed location ............. 26 Measuring circuits ................28 "Sonel Analysis 2.0" software ............. 33 Minimum hardware requirements ..............33 Software installation ..................33 Starting the program ..................38 Selecting the analyzer .................. 39 Analyzer Configuration ................ - Page 4 PQM-702 Operating manual 5.3.2 <Clamps Phase> card ..................69 5.3.3 <Wireless connection> card ................70 5.3.4 <Additional settings> card ................... 71 Analyzer database ..................72 GSM communication mode ................73 5.5.1 General information about GSM connection ............73 5.5.2 Modem Configuration ..................74 5.5.3...
- Page 5 PLL synchronization ................... 119 Flicker ......................120 Power measurement .................. 120 9.7.1 Active power ..................... 121 9.7.2 Reactive power ....................121 9.7.3 Reactive power and three-wire systems ............124 9.7.4 Reactive power and reactive energy meters ............. 125 9.7.5 Apparent power ....................126 9.7.6 Distortion power D and effective nonfundamental apparent power S...
- Page 6 PQM-702 Operating manual 11.3.9 Power and energy ..................... 164 11.3.10 Flicker ....................... 164 11.3.11 Unbalance ......................164 11.4 Event detection – RMS voltage and RMS current ........165 11.5 Event detection – remaining parameters ............ 165 11.5.1 Event detection hysteresis ................166 11.6...
-
Page 7: General Information
• PQM-702 analyzers must be operated only by appropriately qualified personnel with relevant certificates authorizing the personnel to perform works on electric systems. Operating the analyzer by unauthorized personnel may result in damage to the device and constitute a source of danger for the user. -
Page 8: General Characteristics
PQM-702 Operating manual General characteristics Power Quality Analyzer PQM-702 (Fig. 1) is a high-tech device providing its users with a comprehensive features for measuring, analyzing and recording parameters of 50/60 Hz power networks and power quality in accordance with the European Standard EN 50160. The analyzer is fully compliant with the requirements of IEC 61000-4-30:2008 Class A. - Page 9 GPS receivers may receive satellite signals in the open air; therefore synchronization with a built-in antenna is possible only outside of buildings. When PQM-702 is used indoors, in or- der to ensure the availability of the GPS signal, the device should be connected to an external GPS antenna (cable length: 10m) located outside the building.
-
Page 10: Power Supply Of The Analyzer
Tightness and outdoor operation PQM-702 analyzer is designed to work in difficult weather conditions - it can be installed di- rectly on electric poles. Two bands with buckles and two plastic fasteners are used for mounting the analyzer. The fasteners are screwed to the back wall of the housing, and bands should be... -
Page 11: Mounting On Din Rail
Due to the characteristics of the built-in lithium-ion rechargeable battery, the process of charg- ing is suspended when the battery temperature is outside the range of 0°C…45°C (in such case, "Sonel Analysis" software indicates charging status as "charging suspended"). Mounting on DIN rail The device is supplied with a bracket for mounting the analyzer on a standard DIN rail. - Page 12 PQM-702 Operating manual stalled to increase the stability of the mounting assembly. These catches have special hooks that are supported on the DIN rail. Fig. 4. Rear side of the analyzer with DIN rail bracket and positioning catches.
-
Page 13: Measured Parameters
PQM-702 analyzer an exceptionally useful and powerful tool for measuring and analyzing of all types of mains systems and faults which occur in them. With some unique features, the PQM-702 stands out from other similar analyzers available in the market. - Page 14 PQM-702 Operating manual Table 1. Measured parameters for various mains configurations 3-ph delta Mains type, 1-ph 2-ph 3-ph wye with N 3-ph wye without channel Parameter L1 L2 L12 L23 L31 Σ Σ Σ • • • • • •...
-
Page 15: Conformity To Standards
(1) In three-phase 3-wire mains systems, the total reactive power is calculated as (see discussion on reactive power in section 9.7) Conformity to standards The PQM-702 analyzer has been designed to meet the requirements of the following stand- ards. Standards relating to measurement of mains parameters: •... -
Page 16: Operation Of The Analyzer
PQM-702 Operating manual 2 Operation of the analyzer Buttons The keyboard of the analyzer consists of four buttons: ON/OFF , LEFT , RIGHT , START/STOP . To switch-on the analyzer, press ON/OFF button. Directional but- tons LEFT and RIGHT are used primarily to change the information screens. The screens change circularly, i.e. -
Page 17: Screens
2 Operation of the analyzer Screens Fig. 5 presents the first screen displayed by the analyzer. The bar in the upper part is a per- manent element, shown independent of the selected screen. Fig. 5. Screen 1 with a phasor diagram. The bar includes (from the left): •... - Page 18 PQM-702 Operating manual Note To detect a phase error, the fundamental component of the measured se- quence must be at least equal to 5% of the nominal voltage, or 1% of the nominal current. If this condition is not fulfilled, the correctness of angles is not verified.
- Page 19 2 Operation of the analyzer Fig. 8. Screen 4 with apparent and distortion power values. Screen 5 (Fig. 9) indicates THD factors in voltage and current. The factors shown on this screen are referred to the fundamental component (THD Fig. 9. Screen 5 with THD factors. On screen 6 (Fig.
- Page 20 PQM-702 Operating manual Fig. 11. Screen 7 with light flicker factors. Screen 8 presents the following information: • start-time of the last recording, or the start-time of the next scheduled recording interval in the scheduled recording mode, • end-time of the last recording (when recording is in progress dashes are displayed), or the end-time of the next scheduled recording interval in the scheduled recording mode, •...
-
Page 21: Pc Connection And Data Transmission
2 Operation of the analyzer Fig. 12. Screen 9 with information on the measurement point settings. PC connection and data transmission PQM-702 provides three ways of communication with a PC. They are as follows: • wired communication via USB, •... -
Page 22: Usb Communication
USB cable to your PC (USB slot in the device is located on the left side and is secured with a sealing cap). Before connecting the device, install "Sonel Analysis 2.0" software with the drivers on the computer. -
Page 23: Communication Via Gsm Network
IP address, • SMS option to send alarm messages. In order to configure the SIM card and modem in PQM-702, the user must obtain the following da- ta from the data transmission service provider: • PIN code for SIM card, •... -
Page 24: Start / Stop Of Recording
PQM-702 Operating manual Fig. 13. Selection of the measurement point. To select one of the four points, press the corresponding button indicated by a triangle on the screen: • to select measurement point 1, select • to select measurement point 2, select •... -
Page 25: Approximate Recording Times
2 Operation of the analyzer The measurement point number, which is displayed in the upper left corner of the screen, flashes once per second, while the device is in the recording mode. Stopping the recording process: • recording ends automatically as scheduled (if the end time is set), in other cases the user stops the recording (using button or the software). -
Page 26: Key Lock
PQM-702 Operating manual Key Lock Using the PC program, the user may select an option of locking the keypad after starting the process of recording. This solution is designed to protect the analyzer against unauthorized stop- ping of the recording process. To unlock the buttons, the user must enter a code consisting of 3 digits: •... - Page 27 2 Operation of the analyzer discharging of the battery in the absence of power supply from mains, similarly as during normal operation with the battery power supply. After discharging, the analyzer will switch-off and sending SMS messages will be impossible. Note Anti-theft feature requires the following arrangements for proper opera- tion:...
-
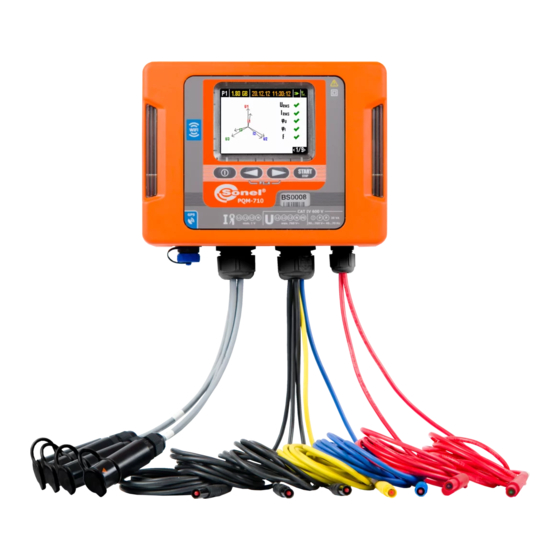
Page 28: Measuring Circuits
PQM-702 Operating manual 3 Measuring circuits The analyzer can be connected to the following mains types: • Single-phase with neutral (Fig. 14) • Split-phase (Fig. 15), • Three-phase 4-wire wye (Fig. 16), • Three-phase 3-wire wye (Fig. 17), Three-phase 3-wire delta (Fig. 18). - Page 29 3 Measuring circuits Fig. 14. Connection diagram – single-phase system. Fig. 15. Connection diagram – split-phase system.
- Page 30 PQM-702 Operating manual Fig. 16. Connection diagram – three-phase wye system with neutral conductor. Fig. 17. Connection diagram – three-phase wye system without neutral conductor.
- Page 31 3 Measuring circuits Fig. 18. Connection diagram – three-phase delta system. Fig. 19. Connection diagram – three-phase delta system (current measurement with Aron’s method).
- Page 32 PQM-702 Operating manual Fig. 20. Connection diagram – three-phase wye system without neutral conductor (current measurement with Aron’s method). Fig. 21. Connection diagram – system with transducers.
-
Page 33: "Sonel Analysis 2.0" Software
4 "Sonel Analysis 2.0" software 4 "Sonel Analysis 2.0" software "Sonel Analysis 2.0" is an application required to work with PQM-702 analyzer. It enables the user to: • configure the analyzer, • read data from the device, • real-time preview of the mains (LIVE mode), •... - Page 34 PQM-702 Operating manual Fig. 22. Installer – starting screen. Click “Next>”. Read the License Agreement and click “I Agree”. On the next screen choose the in- stallation location by clicking "Browse...", or leave default settings of the installation. Click "Next>".
- Page 35 Then click “Next>”. On the next screen choose drivers to install. Check “PQM-701, PQM-702”, and “OR-1” if you plan to use OR-1 wireless receiver. Click “Next>”. Set Start Menu folder for the driver package and...
- Page 36 PQM-702 Operating manual Fig. 26. Driver installer – choosing components. Depending on the operating system, the installation wizard may look slightly different than the one shown in the presented screen-shots. After the installation wizard for drivers is displayed, follow the on-screen instructions. For Windows XP, select "Install the software automatically (recom- mended)".
- Page 37 Fig. 29. Finishing the installation. After rebooting, you can connect the PQM-702 to the computer. The system should automati- cally recognize the connected device. If the installation has been successful, the computer is ready to work with the PQM-702 ana- lyzer.
-
Page 38: Starting The Program
Analysis – the module for data analysis directly from the analyzer or from the memory card, Disconnect – ends the communication session with the analyzer. • Extensions of the files created by "Sonel Analysis" software are as follows: • *.settings – analyzer configuration files (for measurement points), •... -
Page 39: Selecting The Analyzer
Before sending any data from/ to the analyzer, it is necessary to select the analyzer to which "Sonel Analysis” software will connect. In order to establish the connection with the analyzer, se- lect any option that requires an active connection e.g. Settings, Live Mode or Analysis. - Page 40 PQM-702 Operating manual Note When wrong PIN is entered three times in a row, data transmission is blocked for 10 minutes. Fig. 31. Analyzer Selection Window. Notes • Wireless detection of the analyzers is possible only after connecting it to PC using USB link, entering the correct PIN code and selecting op- tion "Store PIN in database"...
- Page 41 4 "Sonel Analysis 2.0" software Fig. 32. PIN code verification. If the "Store PIN in database" option is checked in the authorization window, the serial number and the entered PIN will be associated, to avoid the need to entry it again during the next connec- tion (serial number and analyzer model are automatically added to the analyzer database).
- Page 42 PQM-702 Operating manual Fig. 33. The successful connection with the analyzer. Entering incorrect PIN results displaying window shown in Fig. 34. Note When the transmission is blocked after three unsuccessful attempts to en- ter the PIN, during the next attempt to connect to the analyzer, the win- dow will appear with the following message "Failure to connect to the ana-...
- Page 43 4 "Sonel Analysis 2.0" software Fig. 34. Incorrect PIN. An unsuccessful attempt to connect the analyzer for reasons not attributable to PIN will trigger the error message. Press Retry button to repeat the attempt, or go to the analyzer selection win- dow and select another analyzer, or rescan for available analyzers.
-
Page 44: Analyzer Configuration
PQM-702 Operating manual 5 Analyzer Configuration After selecting option AnalyzerSettings from the main menu (or clicking the icon) "Settings" window will be displayed as shown in Fig. 36. It is the most important part of the analyzer configu- ration. Here the user determines which parameters will be recorded by the analyzer; the mains type and nominal values of the parameters. - Page 45 5 Analyzer Configuration • red - the current configuration is not compatible with the analyzer and not compatible with the one saved to disk. Receive button is used to read the analyzer settings in order to edit them in the computer. If the settings have been previously modified by the user, a warning message will be displayed.
-
Page 46: Analyzer Settings
PQM-702 Operating manual Fig. 38. Programming locked. Analyzer settings The first element to be configured in the left-hand side of the window is Analyzer Settings. This part is divided into three tabs: • Analyzer type: allows the user to choose the analyzer model for which the settings will be modified. -
Page 47: Measurement Point Configuration
5 Analyzer Configuration If the recording process is not active, then the change in the internal time is always immedi- ate. See also chapter 9.16. Fig. 39. Window memory allocation Measurement point configuration To drop down the "tree" of a measurement point, click once on the triangle at the measure- ment point, or double-click on a given measuring point. -
Page 48: Basic Settings
PQM-702 Operating manual 5.2.1 Basic Settings 5.2.1.1 <Basic> Tab Main settings screen of the measurement point and Basic tab is shown in Fig. 40. It is divided into a few sections: the mains-related settings are grouped in the top part, whereas the part locat- ed below relates to recording according to the schedule and time intervals. - Page 49 5 Analyzer Configuration • Voltage transducers – they define the voltage transducers ratio (when used). Please select one of the three possible parameters of the transducer that will be calculated using the other two: • Selecting "Primary" will gray out the primary voltage, which is calculated basing on two other parameters that may be changed by the user: the voltage of the secondary circuit - Secondary and Ratio.
- Page 50 PQM-702 Operating manual device will operate until it is manually stopped or until the memory is filled-up. Time intervals must not overlap - the program does not allow you to configure overlapping ranges. The following time intervals must be set chronologically.
-
Page 51: Analyzer Settings According To En 50160
5 Analyzer Configuration Waveforms and RMS values are recorded both at the beginning and at the end of the event. Pretrigger time defines the portion of the total recorded time that will be assigned as "pre- triggering" period (both for starting and stopping). This time cannot be longer than the recording time. - Page 52 EN 50160 will change. The user will be able to adjust the settings yourself without the need to upgrade Sonel Analysis software. Although the EN 50160 standard does not provide for current measurement or testing the mains parameters associated with the current, because of the frequent need to test 15-minute power and tanϕ...
- Page 53 5 Analyzer Configuration Table 4. Criteria for power quality according to standard EN 50160 for mains voltage up to 1kV (low voltage networks). Basic meas- Parameter Criterion urement time Slow changes in voltage 10 minutes for 95% of the measurements the deviation from the nominal (RMS voltage) voltage shall be within the range of ±10% U for 100% of the measurements: –15%...+10% U...
-
Page 54: Configuring The Analyzer According To User Settings
PQM-702 Operating manual 5.2.3 Configuring the Analyzer according to user settings If the user did not chose recording in accordance with EN 50160, then all available parame- ters may be freely controlled by the user. All settings are included in the main card of the meas- urement point (Basic and Additional tabs) and five other cards (and their tabs): Voltage, Cur- rent, Power and Energy, Harmonics and Interharmonics. -
Page 55: Voltage
5 Analyzer Configuration • start time of the event, • end time of the event, • threshold value, • parameter limit value during the event, • parameter average value during the event. If the recording is interrupted during an event, information about this event is also saved, but only within the following scope: •... - Page 56 PQM-702 Operating manual • Dips: 0.00…-99.90% with a resolution of 0.01% or in volts, • Interruptions: 0.00...-100.00% with a resolution of 0.01% or in volts up to 0.00V (the dip level cannot be lower than the interruption level). For mains with neutral conductor, it is possible to set also the maximum N-PE voltage level - option N-PE over limit.
- Page 57 5 Analyzer Configuration 5.2.4.2 <Additional> tab In this tab (see Fig. 44) the user defines recording parameters for the mains frequency, crest factor, voltage flicker rates and voltage unbalance. Similarly to other parameters, the user may se- lect recording of average, minimum, maximum and instantaneous values. In case of unbalance, recorded parameters include three symmetrical components in volts (zero- positive- and negative- sequence component), and two unbalance factors (in percent): negative and zero sequence un- balance.
-
Page 58: Current
PQM-702 Operating manual 5.2.5 Current Screen with Current settings is shown in Fig. 45. Note This tab is not available if the current measurement was disabled in the main measurement point configuration by selecting None option in Clamps type field The following elements are grouped here: •... -
Page 59: Power And Energy
5 Analyzer Configuration Fig. 45. Current measurement settings. 5.2.6 Power and energy The configuration part relating to the power and energy settings has three tabs: Power, Addi- tional and Energy. Note These tabs are not available if the current measurement was disabled in the main measurement point configuration by selecting None option in Clamps type field 5.2.6.1 <Power>... - Page 60 PQM-702 Operating manual For each of these power types, the user may enable event recording (logging). Two thresh- olds can be set for each power type (minimum and maximum) and the analyzer will detect every case of their exceeding. The setting range is 0.00 W ... 999.9 MW (for active power), 0.00 var ... 999.9 Mvar (for reac- tive power), 0.00 VA ...
- Page 61 5 Analyzer Configuration 5.2.6.2 <Additional> tab Additional tab (Fig. 47) shows parameters related to the power measurements: • Power factor (PF): event threshold setting range 0.00 ... 1.00 in 0.01 steps, • Displacement power factor (cosφ): event threshold setting range 0.00 ... 1.00 in 0.01 steps, •...
-
Page 62: Harmonics
PQM-702 Operating manual Fig. 48. Power and energy: Energy tab. 5.2.7 Harmonics In Harmonics card the user may configure recording method and event detection for voltage and current harmonics and other parameters directly related to them. The card has three tabs: Voltage, Current and Additional. - Page 63 5 Analyzer Configuration • SPACEBAR - used to enter the editing selected harmonic (the user may also immediately start typing the threshold), • ENTER - confirming values • TAB – confirming values and moving to the next harmonics, • UP and DOWN arrow - changing the value of the limit, •...
- Page 64 PQM-702 Operating manual The event threshold setting range is as follows: • for THD: 0.00…200.00% every 0.01%, • for harmonics: in amperes 0.00…I in 0.01A steps, as a percentage value 0.00…200.00% in 0.01% steps. Setting the threshold to zero disables the event detection from the specified harmonic.
-
Page 65: Interharmonics
5 Analyzer Configuration Fig. 51. Additional settings of harmonics. 5.2.8 Interharmonics In Interharmonics tab, the user may configure the manner of recording and event detection for current and voltage interharmonics and interharmonics distortion factor (TID). The card is divided into two tabs: Voltage and Current. 5.2.8.1 <Voltage>... - Page 66 PQM-702 Operating manual Note The level of TID and interharmonics presented as a percentage value is referenced to the fundamental component. Fig. 52. Voltage interharmonics settings. 5.2.8.2 <Current> tab Screen of this tab is shown in Fig. 53. Available options are identical as those in Voltage tab: recording TID (with event detection option) and recording current interharmonics (with setting of event thresholds from individual interharmonics).
-
Page 67: Default Configuration Profiles
5 Analyzer Configuration Fig. 53. Current interharmonics settings. 5.2.9 Default configuration profiles As a standard, after installation the application loads the default analyzer configuration with following measurement points profiles: • Voltage, • Voltage and current, • Power, • Power and harmonics. The names of these profiles are entered in the measurement points names (MP1 –... -
Page 68: Actual Settings
PQM-702 Operating manual Table 5. List of recorded parameters for default profiles of measuring points Voltage Voltage and current Power Power and harmonics (MP1) (MP2) (MP3) (MP4) U RMS U RMS U RMS U RMS U crest factor U crest factor... -
Page 69: Clamps Phase> Card
5 Analyzer Configuration "GOOD" is displayed. In the absence of GPS signal, the icon is gray and message "NO SIGNAL" is shown. Checking Keyboard lock box, results in immediate key locking after the recording is activat- ed. In this case, the user will have to enter the 3-digit code (using three buttons of the analyzer) to unlock the keys. -
Page 70: Wireless Connection> Card
PQM-702 Operating manual Fig. 55. Reversing the clamp phase 5.3.3 <Wireless connection> card Wireless connection (Fig. 56) includes the following elements: • OR-1 communication enabled button – used for enabling/disabling radio interface to communicate with the receiver OR-1. • GSM communication enabled button – used for enabling/disabling the built-in GSM mo- dem. -
Page 71: Additional Settings> Card
5 Analyzer Configuration • SMS Alerts - here the user may enter up to four telephone numbers, to which SMS Alerts will be sent. It is recommended that the phone numbers start with plus sign and the country code (e.g. +44 for UK). SMS will be sent in the following situations: •... -
Page 72: Analyzer Database
PQM-702 Operating manual Analyzer database Select from the main menu OptionsAnalyzer database - here you may add or edit existing analyzers (Fig. 58). Only analyzers entered by the user into the database will be displayed in the selection box when searching analyzers via radio. Serial number entered into the database must match the se- rial number of the analyzer, that you want to connect. -
Page 73: Gsm Communication Mode
5 Analyzer Configuration Clicking Add enables user to add an analyzer - as shown in Fig. 59. Please select a model of analyzer, enter its serial number and optional description. Changing PIN code and GSM settings is possible only after connecting to the analyzer. Remove icon allows the user to delete the selected analyzer from the database (after confirming it by the user). -
Page 74: Modem Configuration
"stand-by" mode waiting for next client connection. 5.5.2 Modem Configuration In order to configure the SIM card and modem in PQM-702, the user must obtain the following data from the data transmission service provider: •... - Page 75 5 Analyzer Configuration means that the SIM card rejected PIN, which was used by the analyzer to attempt the communication. This is normal when you insert a new card into the analyzer. • To configure missing parameters required to perform GSM transmission, the user must reconnect PC to the analyzer via USB and choose OptionsAnalyzer database from the program.
-
Page 76: Checking Gsm Connection
If status screen <8/9> shows the status of GSM modem as "Ready, <connection type>", it means that a connection from a remote PC may be performed via Internet. The user may perform a test connection to verify the connectivity with "Sonel Analysis': •... - Page 77 5 Analyzer Configuration Solution: After connecting the analyzer via USB cable, enter the analyzer database and select Change GSM settings and then Change PIN code of the SIM card. Enter any of the four digits in Previous PIN (this field is ignored in this case), and then enter the same cor- rect SIM code in the two fields below.
-
Page 78: Live Mode
PQM-702 Operating manual 6 Live mode To enter the live mode, click Live mode icon. If the connection to the analyzer has not been previously established, the program goes first to the connection screen (see chapter 4.4). In this mode, the screen is divided into a few tabs: Waveforms –... -
Page 79: Timeplots
6 Live mode The checkboxes above the diagram are used to enable/disable displaying of a chosen voltage/current channel. Buttons next to the boxes are used to change the color of presented waveforms. The graph may be freely expanded in both axes. In the corners of the window there are four buttons , which activate displaying a window thumbnail with actually displayed area... -
Page 80: Measurements
PQM-702 Operating manual Fig. 62. Graph with values in real time (Timeplot). Measurements Measurements tab provides a view of a range of parameters of the measured mains. Fig. 63 presents an example of a screen that shows a summary table of values read from the analyzer and displayed in real time. - Page 81 6 Live mode Fig. 63. Indications of phase and total values Each group may be enabled/disabled independently of the other groups and column back- ground color may be changed using the buttons in the top of the screen. When the program is started for the first time, the following parameters are shown: voltage, current, power and coefficients.
-
Page 82: Phasor Diagrams
PQM-702 Operating manual Note In some mains configurations it is not possible to calculate (measure) the values of some parameters. For example, in a delta three-phase system, it is impossible to calculate the cosφ displacement power factor between current and voltage, as the measured voltage is phase-to-phase voltage, and the measured current is line current which is a vector sum of two phase currents. -
Page 83: Harmonics
6 Live mode Fig. 64. Phasor diagram for wye connection. On the diagram two buttons are present for turning the phasor diagram by 90° clockwise or counter-clockwise. Harmonics Harmonics tab enables user to view harmonic values in voltage and current, active and reac- tive harmonics power, harmonic factors and K-factor. - Page 84 PQM-702 Operating manual Fig. 65. Harmonics view. • a table with numerical values of voltage and current harmonics (in Voltage, Current mode) or values of active and reactive power harmonics (in Harmonics power mode) and the factors of the phase shift between current and voltage harmonics - cosφ and values of angles - φ (in angle degrees).
-
Page 85: Interharmonics
6 Live mode Fig. 66. The screen with values of harmonics power. In the bottom right-hand corner, a button is located for switching between 2D and 3D view. After clicking it, the harmonics are presented as a 3D view. After clicking Any view button, the graph may be freely positioned using a mouse. - Page 86 PQM-702 Operating manual Fig. 67. Interharmonics graph. The user has the access to two settings: • TID and interharmonics values relative to – two options are available: relative to RMS or to the fundamental harmonic (this option is active only after selecting the percent unit – see below), •...
-
Page 87: Data Analysis
7 Data Analysis 7 Data Analysis The analysis block allows the user to read data collected by the analyzer during the recording, view numerical data and graphical visualization. The user may generate reports that in a clear manner describe the tested system. Reading data from the analyzer The fastest way to read data is to use the USB connection and read from the built-in mass storage mode. -
Page 88: Selecting The Time Interval For Analysis
PQM-702 Operating manual During the data read-out, the status bar at the bottom of the window shows the download pro- gress and Cancel button, which may be used for stopping the process. Data may be deleted from the analyzer memory at any time by entering Analyzer menu and choosing the option of AnalyzerData removal. -
Page 89: Analyzing Obtained Data
7 Data Analysis Fig. 69. Selection of time period for the analysis. If the user wants to perform many analyses on the read data, after downloading, save such data on a local disk as a file with the extension *.pqm702. Such file will include an identical copy of the read data that may be used at any moment - then the user may return to the analysis time selection screen (Fig. -
Page 90: Measurements
PQM-702 Operating manual In General view (Fig. 70), the user may access a quick preview of waveform and/or event, but the view of the measurements is not available. After pointing the cursor on an event point and left-clicking the mouse, the screen displays information about this event and the wave- form (when recorded with the event). - Page 91 7 Data Analysis Below the graph, a summary table is displayed with recorded values of the parameters. The table shows only the data for the selected time interval. The checkboxes on the left side are used to include/ exclude some parameters from the table.
- Page 92 PQM-702 Operating manual channel for PLL circuit). Parameter values measured in such conditions may be uncertain. The user may generate several types of graphs. This activity may be performed by using "Plot" button. The possibilities are as follows: • Time plot – when Time column is selected along with any other column(s) (as in Fig. 72) and this option is chosen, a new window appears with a diagram showing the indicated parame- ters over time.
- Page 93 7 Data Analysis Fig. 72. Selecting data for the plot. Description of the timeplot: • information about the start, end and time difference of the plot time is presented on the left side, at the top (horizontal axis), • information about the values of three independent markers (circles on the plot) is displayed on the left side at the bottom,...
- Page 94 PQM-702 Operating manual Fig. 73. Timeplot window. • in addition to the parameters selected by the user (i.e. UL1, K, P etc.), the scales drop-down lists include also the group of parameters with the same units (V, A, W, var, VA, %, Hz, [---] - no unit).
- Page 95 7 Data Analysis Fig. 74. Example of a report saved as a .pdf file Fig. 75. Harmonics graph.
-
Page 96: Events
PQM-702 Operating manual 7.3.3 Events Pressing Events button, changes the main window image into the one shown in Fig. 76. This mode may be used to analyze all events recorded by the analyzer. The recorded events are pre- sented as dots in the graph. - Page 97 7 Data Analysis duration is longer, there will be two waveforms (one at the beginning of the event and the second at the end). The plot may be freely zoomed-in as shown in Fig. 78. Operations on the plot are the same as in case of the timeplot.
- Page 98 PQM-702 Operating manual Fig. 78. Zooming-in a part of the waveform. Waveforms may be saved in CSV format, which allows user to analyze them in spreadsheets. All samples of enabled channels are saved. To save a waveform in this format, select Export to CSV icon and specify a file name and location where you want to save the file.
- Page 99 7 Data Analysis Events listed in the table may be stored in the form of a report, after selecting ReportEvent Report option. A sample pdf report is shown in Fig. 79. Fig. 80 shows a graph for Value/duration. In order to display it, select PlotsValue/duration option.
-
Page 100: Analyzing Obtained Data According To En 50160
PQM-702 Operating manual Fig. 81. ANSI/CBEMA graph Action for zooming-in/zooming-out, moving and other (including markers activities) shown in Fig. 77, Fig. 78 and Fig. 80 are similar to those shown in Fig. 73. Markers window includes events selected by the user. In this table the user may move rows (events), to arrange them according own choice. - Page 101 7 Data Analysis file. Click EN 50160 Report button to display a window where you can enter additional data to the report (Fig. 82). Fig. 82. Entering additional data to the report. If the fields are left empty - then the corresponding fields in the report will also remain empty. If you want a company logo or another symbol to appear in the report header, indicate it in the Company logo field.
-
Page 102: Data Export
PQM-702 Operating manual Fig. 83. Measurement report according to EN 50160. 7.3.5 Data export Measurement data presented in a tabular form, may be selected and saved in a desired file format. This applies both to the data presented in part Measurements (section 7.3.2) and for Events (section 7.3.3):... - Page 103 7 Data Analysis It is possible to export only selected events - mark the icon in Marker column next to se- lected events and then, after choosing the Marker tab, press ReportsUser report and proceed as described above. The standard way to export data to CSV files may be configured by selecting Op- tionsProgram configuration, then clock Report settings icon and CSV settings tab.
-
Page 104: Other Program Options
PQM-702 Operating manual 8 Other program options Analyzer status, starting and stopping recording Selecting AnalyzerControl option in the program menu displays a window as shown in Fig. 84. This window includes a lot of information about the current state of the analyzer - the user may also change the measurement point and start/stop the recording process. -
Page 105: Deleting Data
8 Other program options • Number of events – the number of recorded events - counted from the last recording start in the measurement point. Sending a new configuration or switching-off the analyzer results in resetting the counters. This window also enables user to change the active measurement point, and remote start- ing/stopping of the recording: •... -
Page 106: Main Settings
Updates settings – allows user to enable /disable the option to automatically check for new versions of "Sonel Analysis" program and for the analyzer firmware. When selected, each time the program is started - it will be connect to manufacturer's server and check for new program versions. - Page 107 8 Other program options • Standard default settings – this option allows the user to configure individual profiles of EN 50160 standards and its variants. A drop-down tree are have all factory pre-defined profiles, which are available on the drop-down list when you set up the measurement according to EN 50160 (see sec.
- Page 108 PQM-702 Operating manual Harmonics The screen is shown in Fig. 88. Here, the user may set the limits for THD factor, and limit lev- els for individual harmonics. Setting limits for individual harmonics may be performed in two ways: completing the table be- low the graph or directly on the graph.
- Page 109 8 Other program options Fig. 88. Recording in accordance with EN 50160 - harmonics settings. Events Fig. 89 presents screen for recording events according to EN 50160. The following features may be set here: • thresholds for detecting voltage swells, dips and interruptions. These thresholds are ex- pressed as a percentage of the nominal voltage value that to be added to the nominal value.
-
Page 110: Live Mode
PQM-702 Operating manual Fig. 89. Recording in accordance with EN 50160 - event settings. Please note that the criteria set out in profiles of EN 50160 are used only for statistical analy- sis and generating EN 50160 report based on mains parameters previously measured by the ana- lyzer. -
Page 111: Color Settings
8 Other program options Fig. 90. Live mode settings. 8.3.4 Color Settings This section allows user to change the colors of individual application components. It is divid- ed into the following cards (Fig. 91): • Graph colors - divided into individual parameters and phases, •... - Page 112 PQM-702 Operating manual Fig. 91. Program configuration - Color settings.
-
Page 113: Report Settings
8 Other program options Fig. 92. Program configuration - Data Analysis. 8.3.6 Report settings The elements included in this part of the configuration: • Additional report data - in this section you can fill in additional fields used for the generating measurement reports: "Measurement place", "Author", "Measurement cause", "Notes"... -
Page 114: Upgrading Software And Firmware
Firmware of the analyzer and "Sonel Analysis" software must be regularly updated in order to correct discovered errors or introduce new functionalities. When the analyzer software is updated, check whether a new version of "Sonel Analysis" is available (and vice versa), if yes proceed with the upgrade. -
Page 115: Power Quality - A Guide
9 Power Quality - a guide 9 Power Quality - a guide Basic Information The measurement methodology is mostly imposed by the energy quality standards, mainly IEC 61000-4-30. This standard, introducing precise measurement algorithms, or- dered analyzers market, allowing customers to easily compare the devices and their results between the analyzers from dif- ferent manufacturers. -
Page 116: Voltage Inputs
A typical situation is using flexible clamps with built-in electronic integrator. However, the PQM-702 allows connecting the Rogowski coil alone to the input and a digital signal integration. 9.3.1 Current transformer clamps (CT) for AC measurements CT Current Transformer Clamp is just a transformer converting a large current in primary winding to a smaller current in secondary winding. -
Page 117: Ac/Dc Measurement Clamps
(no conductor inside) and turn the knob until the DC indication is zero. In the area of AC/DC measurement clamps, Sonel S.A. offers the C-5 clamp with rated range of 1000A AC / 1400A DC. This clamp has a voltage output and for 1000A rated current it gives a 1V voltage signal (1mV/A). -
Page 118: Digital Integrator
PQM-702 Operating manual output voltage for the 50 Hz frequency of the F-series flexible probes (to be used with PQM-702) is about 45µV/A. Such low voltages require the use of precise and low-noise amplifiers which of course increase the costs. -
Page 119: Signal Sampling
9 Power Quality - a guide Power measurement error ≈ phase error (in radians) × tan(φ) × 100 % where tan(φ) is the tangent of the angle between the fundamental voltage and current compo- nents. From the formula, it can be concluded that the measurement errors are increasing as the displacement power factor is decreasing;... -
Page 120: Flicker
61000-4-30 standard defines the input voltage range within which the metrological parameters shall not deteriorate, and for the class A such range is 10%...150%U . The PQM-702 meets the above-mentioned requirements in terms of the PLL system operation also for the lowest support- ed nominal voltage U =64 V, i.e. -
Page 121: Active Power
U is RMS voltage, I is RMS current, and is the phase shift angle between the voltage and the current. The PQM-702 analyzer calculates the active power directly from the integral formula, using sampled voltage and current waveforms: ��... - Page 122 PQM-702 Operating manual nusoidal, but due to the properties of capacitor it will be shifted in relation to source voltage. In such a system, reactive power Q will be non-zero and can be interpreted as an amplitude of ener- gy oscillation which alternately is collected in the capacitor and returned to the source. Capacitor active power equals zero.
- Page 123 9 Power Quality - a guide there is a relation between energy oscillations and Budeanu reactive power Q . One can give ex- amples of circuits in which despite oscillating character of instantaneous power waveform, reac- tive power according to Budeanu is zero. Over the years, the scientists have not been able to connect any physical phenomenon to the reactive power according to this definition.
-
Page 124: Reactive Power And Three-Wire Systems
PQM-702 Operating manual �� = � �� − �� Reactive power is one of the components of nonactive power N. In one-phase systems with sinusoidal voltage and current waveforms, N equals Q; hence the nonactive power does not have any other components. In three-phase systems, this is true only for symmetrical sinusoidal sys- tems with a balanced purely resistive load. -
Page 125: Reactive Power And Reactive Energy Meters
9 Power Quality - a guide cording to the three-wire system (delta and wye systems without the N conductor). Such state- ment may come as a surprise for many people. The receiver can be treated as a “black box” with only 3 terminals available. We cannot de- termine its internal structure. -
Page 126: Apparent Power
PQM-702 Operating manual such widely used meters really measure? One can attempt to look for answers to these questions is the standard on such meters - IEC 62053-23. Unfortunately, to our disappointment, we will not find there any reference to measure- ments in non-sinusoidal conditions –... -
Page 127: Distortion Power D And Effective Nonfundamental Apparent Power S
9 Power Quality - a guide In one-phase systems, the apparent power is calculated as shown in the formula above and there are no surprises. However, it turns out that in three-phase systems calculation of this power is equally difficult as calculation of reactive power. Of course, this is related to actual systems with non-sinusoidal waveforms which additionally can be unbalanced. -
Page 128: Power Factor
S , that is the value defined, among others, in the IEEE 1459-2000 standard. The PQM-702 analyzer calculates these factors in the manner described above. Harmonics Decomposition of periodic signal into harmonic components is a very popular mathematical operation based on Fourier’s theorem which says that any periodic signal can be represented as a... - Page 129 9 Power Quality - a guide and phases of harmonic components in the frequency domain. In a perfect situation, voltage is generated in a generator which at output gives a pure sinus- oidal 50/60 Hz waveform (absence of any higher harmonics). If the receiver is a linear system, then also current in such situation is a pure sinusoidal waveform.
-
Page 130: Harmonics Active Power
PQM-702 Operating manual variable or discontinuous way. The whole energy is supplied only by the generator. In the next step, we can modify the circuit by introducing some impedance between the gen- erator and the receiver. Such impedance represents the resistance of cabling, transformer wind- ing, etc. -
Page 131: Harmonics Reactive Power
9 Power Quality - a guide By adding all active harmonics power values we receive the receiver active power. Hence, we can notice that there are at least two alternative active power measurement methods. The first method involves calculation of average active power instantaneous value, which is calculated on the basis of successive voltage and current samples: ��... -
Page 132: Estimating The Uncertainty Of Power And Energy Measurements
PQM-702 Operating manual tion of any 3 vectors to three sets of vectors: positive sequence, negative sequence and zero se- quence (more in the part related to unbalance). Let us use an example. Assuming that a three-phase motor is supplied from a balanced, 4- wire mains (RMS phase-to-neutral voltage values are equal, and angles between the individual fundamental components are 120°... - Page 133 Table 8 presents the phase difference error between the voltage and current harmonics for the PQM-702 analyzer (without clamps and transducers). Table 6. Phase error in the PQM-702 analyzer depending on the frequency Phase difference error Frequency range 40..70Hz...
- Page 134 ° ≅ Conditions: = 60 = 5% I ��ℎ ° For the 40..70Hz frequency range, the PQM-702 phase error is 0.5 . Af- ������ ( �� + ���� ) ������(60.5°) �� = 100 �1 − � = 100 �1 −...
-
Page 135: Harmonic Components Measuring Method
5Hz. As the PQM-702 analyzer collects 2048 samples per measuring window (for 50Hz and 60Hz), this fulfills the requirement of Fast Fourier Transform that the number of samples subjected to transformation equals a power of 2. -
Page 136: Thd
– RMS waveform. Limitation of the number of harmonics used to calculate THD is conventional and is caused mainly by measuring limitations of the device. Because the PQM-702 is capable of measuring the harmonic components up to the 50 order, the harmonics up to the 50 order are used to calcu- late THD. -
Page 137: Interharmonics
9 Power Quality - a guide Interharmonics Interharmonics are components of the frequency spectrum for voltage or current with a fre- quency that are not a multiple of the fundamental frequency network (50 or 60Hz). The cause of interharmonics may be e.g. asynchronous processes and transient states related to connection processes, frequency converters that generate the output frequency different from the frequency of the power supplying mains and introduce into the system spectral interharmonics, arc furnaces, induction motors and drives with variable load. -
Page 138: Total Interharmonic Distortion - Tid
PQM-702 Operating manual analyzers. The whole process, similarly as in case of harmonics, consists of several steps: • synchronous sampling (10/12 periods), • FFT (Fast Fourier Transform), • grouping. FFT analysis for the test window of 10/12 period (approx. 200 ms). As a result, we obtain a set of spectral bands from 0 Hz (DC). -
Page 139: Unbalance
The PQM-702 is capable of measuring the voltage and current unbalance with a symmetrical components method. This method is based on the assumption that each set of three unbalanced vectors can be resolved to three groups of vectors: positive sequence, negative sequence and ze- ro sequence. -
Page 140: Event Detection
FFT. 9.11 Event detection The PQM-702 analyzer gives a lot of event detection options in the tested mains system. An event is the situation when the parameter value exceeds the user-defined threshold. The fact of event occurrence is recorded on the memory card as an entry which includes: •... - Page 141 9 Power Quality - a guide Table 9. Even threshold types for individual parameters Parameter Interruption Swell Minimum Maximum • • • RMS voltage • • Frequency • • CF U Voltage crest factor • Voltage negative sequence unbalance • Short-term flicker P •...
-
Page 142: Detection Of Voltage Dip, Swell And Interruption
PQM-702 Operating manual The analyzer records the waveforms of active channels (voltage and current) at the event start and end. In both cases, six periods are recorded: two before the start (end) of the event and four after start (end) of the event. The waveforms are recorded in an 8-bit format with 10.24kHz sampling frequency. - Page 143 9 Power Quality - a guide Fig. 101. Voltage swells, dips and interruptions. Interruption is a state during which the U voltage is lower than the specified interruption RMS(1/2) level. The interruption threshold is usually set much below the voltage dip level, at about 1..10% of The interruption starts at the moment when the U voltage decreases below the interrup- RMS(1/2)
-
Page 144: Cbema And Ansi Curves
PQM-702 Operating manual The U values are determined during 1 period when the fundamental voltage component RMS(1/2) passes the zero and they are refreshed every half-period, independently for each voltage channel. This means that these values will be obtained at different times for different channels. Fig. 102 shows the method of the RMS determination with two voltage phases. -
Page 145: Averaging The Measurement Results
10/12-period value synchronized with the mains frequency). Each average voltage value is recorded every 10 minutes which gives "only" 1008 measurement results. Fig. 104 presents the method according to which the PQM-702 analyzer determines the average values at averaging intervals equal to or greater than 10 seconds with the 10-minute averaging... - Page 146 Class A, connected to the same system, and synchronized with UTC, will give the same results. In PQM-702 analyzer, the resynchronization of intervals according to the method described above is performed for averag- ing times: 10s, 15s, 30s, 1min, 3min, 5min, 10min, 15min, 30min, 60min, 120min.
- Page 147 9 Power Quality - a guide Fig. 105. Determining the averaging intervals shorter than 10 seconds (with the 3-second averaging). The method of determining average values for such periods is shown in Fig. 105. Also in this case the resynchronization of 10/12-period intervals, but it is always done using clock time of 10 minutes.
-
Page 148: Frequency Measurement
PQM-702 Operating manual Selecting the right averaging time is not easy. To a large extent it depends on the type of dis- turbance in the system and the user's expectations for the final data analysis. A frequent situation is that we know only that there is a problem in the mains, and the measurements with the analyzer will only help us identify the cause. -
Page 149: Marking The Measurement Data
9 Power Quality - a guide inside buildings, the analyzer must be connected to an external antenna (optional accessory), with a cable of 10m and installed outside of the building. The analyzer detects the external antenna and switches the receiver into external antenna mode instead of using internal antenna. GPS synchronization time depends on weather conditions (clouds, precipitation) and on the location of the receiving antenna. - Page 150 PQM-702 Operating manual Note Abrupt change of time during the recording process may lead to irreversi- ble loss of recorded data, therefore it is advised to use the slow resyn- chronization mode. To avoid the problems with time measurement during recording, please remember the follow- ing issues: •...
-
Page 151: Calculation Formulas
10 Calculation formulas 10 Calculation formulas 10.1 One-phase system One-phase system Parameter Calculation method Name Designation Unit �� = � �� � �� �� �������� �� ��=1 RMS voltage (True ARMS RMS) where U is a successive voltage sample U ��... - Page 152 PQM-702 Operating manual �� ���� = �� Power factor If PF < 0 the load has a generator character cos �� = ������ = cos��� − �� � If PF > 0 the load has a receiver character �� ��...
- Page 153 10 Calculation formulas ∑ �� ℎ �������������� = ℎ=1 ℎ �� K-factor K-Factor Where I is the hth current harmonics I �� = �� �� cos �� is the current fundamental component I ℎ ℎ ℎ ℎ Where U is the hth voltage harmonics U Harmonics active pow- is the hth current harmonics I h=1..50...
-
Page 154: Split-Phase System
PQM-702 Operating manual �� ( �� ) ��(��) �� = � �� ��1+ ��=1 ( �� ) ���� �� ( �� ) > 0 �� �� ( �� ) = � ( �� ) ≤ 0 0 ���� �� ��... -
Page 155: Three-Phase Wye With N
10 Calculation formulas �� = �� + �� ��+������ ��+�� ��+�� �� = �� + �� Total active energy ��−������ ��−�� ��−�� P+tot (consumed and sup- P-tot plied) �� = �� + �� Total Budeanu reactive ����+������ ����+�� ����+�� �� = ��... - Page 156 PQM-702 Operating manual �� + �� + �� + �� = � �� ��1 ��1 ��1 ��1 ��1 �� = �� + �� + �� �������� ���� ���� ���� Total Budeanu distor- �� ���� Btot tion power ������ �� ������...
-
Page 157: Three-Phase Delta And Wye Without N
10 Calculation formulas �� ��� + �� �� + ���� � ��1 ��1 ��1 �� = ������(�� Where U are vectors of fundamental compo- RMS voltage negative nents of phase-to-neutral U √ 3 sequence component �� = 1�� = − ��... - Page 158 PQM-702 Operating manual �� �� �� �� �� �� + � �� �� � �� ������ ������ ���� ������ ���� ��=1 ��=1 where: is a successive voltage sample U Total active power is a successive voltage sample U is a successive current sample I is a successive current sample I ��...
-
Page 159: Methods Of Parameter's Averaging
10 Calculation formulas �� ( �� ) ��(��) �� = � �� �������� �� ��=1 where: i is a successive number of 10/12-period measuring Total apparent energy Stot window (i) represents total apparent power S calculated in the i-th measuring window T(i) represents duration of the i-th measuring window in hours 10.5 Methods of parameter’s averaging... -
Page 160: Technical Specification
• Technical specification is subject to change without prior notice. The latest revisions of technical documentation are available at www.sonel.pl. • Basic uncertainty is uncertainty of a measuring instrument in reference conditions given in Table • Given uncertainty values refer to the PQM-702 analyzer without additional transducers and clamps. • Abbreviations: •... -
Page 161: Measured Parameters - Accuracy, Resolution And Ranges
11 Technical specification 11.3 Measured parameters – accuracy, resolution and ranges 11.3.1 Reference conditions Table 10. Reference conditions Reference conditions Ambient temperature 0°C…+45°C (see also 11.3.2) Relative humidity 40…60% RH Voltages unbalance ≤ 0.1% for negative sequence unbalance (only in three-phase systems) External continuous magnetic... -
Page 162: Current
PQM-702 Operating manual 11.3.4 Current Current Range and conditions Resolution Basic uncertainty (AC+DC) Input circuit without clamp 0..1V (0..3.6V 0.01% I ±0.1% I Flexible clamps F-1/F-2/F-3 Additional uncertainty 0..3000A 0.01% I (10 000A ±1% (±2% including additional error caused by position) Clamps C-4 0..1000A... -
Page 163: Harmonics
11 Technical specification 11.3.6 Harmonics Harmonics Range and conditions Resolution Basic uncertainty Harmonic order (n) DC, 1..50, grouping: harmonic subgroups acc. to IEC 61000-4-7 Amplitude U 0..200% U 0.01% U ±0.05% U if m.v.<1% U ±5% of m.v. if m.v.≥ 1% U (acc. -
Page 164: Power And Energy
PQM-702 Operating manual 11.3.9 Power and energy Conditions Power and energy Resolution Basic uncertainty (for power and energy ± � 1.0 + �� 80% U ≤ U < 150% U ��ℎ Active power 1% I ≤ I < 5% I... -
Page 165: Event Detection - Rms Voltage And Rms Current
11 Technical specification 11.4 Event detection – RMS voltage and RMS current Voltage U (dips, interruptions and Range Resolution Basic uncertainty swells) 0.0%...150.0% U 0.01% U ±0.2% U RMS(1/2) Detection thresholds User defined in percent or absolute values. Event detection based on the measurement (1-period RMS voltage, refreshed every half period). -
Page 166: Event Detection Hysteresis
PQM-702 Operating manual Current total harmonic distortion 0…200% Based on 10/12-period value THD-F (max) Voltage harmonic amplitudes (max) 0…100% or in ab- Based on 10/12-period value; solute values Independent thresholds for all harmonics in the 2…50 range Current harmonic amplitudes (max) 0…200% or in ab-... -
Page 167: Power Supply And Heater
11 Technical specification Current crest factor CF I • • • • Negative and positive sequence unbalance, symmet- • • • • rical components: negative sequence, positive se- quence and zero sequence (voltage) U Negative and positive sequence unbalance, symmet- •... -
Page 168: Supported Mains Systems
PQM-702 Operating manual 11.8 Supported mains systems Types of supported mains systems 1-phase with N One-phase with neutral conductor (terminals L1, N, PE) split-phase Split-phase with neutral conductor (terminals L1, L2, N, PE) 3-phase 4-wire wye with N Three-phase, wye, with neutral conductor (terminals L1, L2, L3, N, PE) -
Page 169: Safety And Electromagnetic Compatibility
K02 red (2 pcs.) – WAKRORE20K02, • phase splitter for current measurement AC-16 – WAADAAC16, • socket-adapter with banana pins (L1 and N) for analyzer charging – WAADAAZ1, • software for data reading and analysis “SONEL Analysis 2.0”, • USB cable – WAPRZUSB,... -
Page 170: Optional Equipment
PQM-702 Operating manual • OR-1adapter - wireless USB interface transmission receiver – WAADAUSBOR1, • hard suitcase for the analyzer and accessories – WAWALXL2, • band for fixing on the pole – WAPOZOPAKPL, • DIN rail mounting bracket with positioning catches – WAPOZUCH3, •... - Page 171 12 Equipment Warning Do not use the device on non-insulated conductors with a potential of more than 600 V in rela- tion to the earth and a measurement category greater than III. • Reference conditions • Temperature +20…+26°C • Humidity 20…75% RH •...
-
Page 172: Current Clamp
Make sure the jaws are closed and there is no conductor inside them. Then, connect the clamp to the analyzer and launch the “SONEL Analysis” software in the instantane- ous values viewing mode (check if the measurement point is correctly configured for measurement with the C-5 clamp). - Page 173 12 Equipment • Phase error (45...65Hz): Current 10…200A 200…1000A range Phase error ≤ 2.5° ≤ 2° • ratio: 1mV/1A • frequency range: DC...5kHz • output impedance: 100Ω • DC zero adjustment range: ±10A • noise: DC up to 1kHz: ≤1mVp-p (or 1Ap-p) DC up to 5kHz: ≤1.5mVp-p (or 1.5Ap-p) 1Hz up to 5kHz: ≤0.5mVp-p (or 0.5Ap-p) •...
-
Page 174: Current Clamp
PQM-702 Operating manual 12.2.3 C-6 current clamp The C-6 is used to measure the alternating current with frequencies up to 10kHz in the 10mA…10A range. The output signal is voltage proportional to the measured current with the 100mV/A sensitivity. The output signal is supplied by a 1.5-meter lead with a pin adapted for the socket in the meter. -
Page 175: Current Clamp
12 Equipment • clamp lead length: 1.5m • operating temperature: –10°C…+55°C • humidity: <85% RH • height: ≤ 2000m • electromagnetic compatibility: IEC 61000-6-3:2008 IEC 61000-6-2:2008 12.2.4 C-7 current clamp C-7 Clamps are used to measure alternating currents in net- works of low and medium power within the range up to 100A. -
Page 176: Current Clamps
PQM-702 Operating manual • operating temperature: 0°C…+50°C • relative humidity: <85% (non-condensing) • electromagnetic compatibility: IEC 61326 12.2.5 F-1, F-2, F-3 current clamps F-1, F-2 and F-3 flexible clamps (Rogowski coil) are used to measure the alternating current of frequencies up to 10kHz in the 1A…3000A range. -
Page 177: External Active Gps Antenna
12 Equipment • Additional error caused by temperature: ±0.07% • Output impedance: 30Ω/400mm • Remaining data: • insulation type: double, according to IEC 61010-1 • measuring category acc. to IEC 61010-1: III 1000V, • protection rating acc. to IEC 60529: IP65 •... -
Page 178: Other Information
PQM-702 Operating manual 13 Other information 13.1 Cleaning and maintenance Note Use only the maintenance methods presented by the manufacturer in this manual. Clean the analyzer casing with a wet cloth, using generally available detergents. Do not use any solvents and cleaning media which could scratch the casing (powder, paste, etc.). - Page 179 13 Other information...
Need help?
Do you have a question about the PQM-702 and is the answer not in the manual?
Questions and answers