Table of Contents
Advertisement
Quick Links
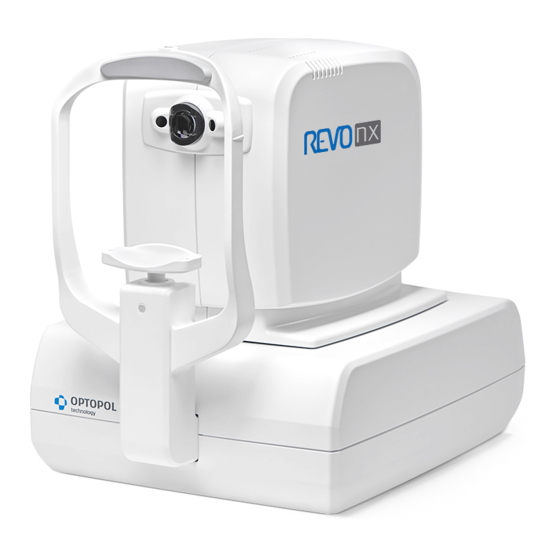
REVO nx
REVO nx 130
SOCT Copernicus REVO
SOCT Copernicus
REVO 60
REVO 80
REVO FC
Make sure you read this manual before using
the instrument. Keep this manual in a safe
place so that you can use it in the future.
User Manual
Software Version 10.0
User Manual Rev. A
0197
SOCT User Manual Version 10.0 rev. A
Manufacturer:
OPTOPOL Technology Sp. z o. o.
42-400 Zawiercie
www.optopol.com
info@optopol.com.pl
ul. Żabia 42
POLAND
Advertisement
Table of Contents


Need help?
Do you have a question about the REVO nx and is the answer not in the manual?
Questions and answers