
Related Manuals for Rion VA-12


Summary of Contents for Rion VA-12
-
Page 1: Table Of Contents
Vibration Analyzer VA-12 Quick Instruction Manual (Ver. 1.00) RION CO., LTD. Measuring Instruments Sales and Engineering Division, Sound and Vibration Measuring Instruments Business Department Contents 1. Fundamental operations 1.1 Operation key panel 1.2 Fundamental operations for preparation 2. Measurement in Vibration Meter Mode 3. -
Page 2: Fundamental Operations
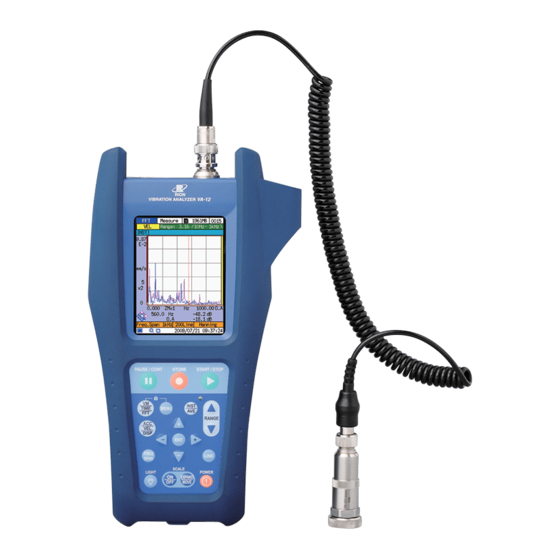
1.1 Operation key panel 1.2 Fundamental operations for preparation VA-12 has three analysis functions: Vibration Meter Mode, Time Waveform Mode, and FFT Analyzer Mode. The operation about common setups to each analysis function before starting measurement is explained in this section. - Page 3 ③ Sensitivity setting of the accelerometer ◆ PV-57I (Supplied accessory) Usually it is not necessary to change the “Sensor Selection” since the default condition is set to PV-57I. Press the MENU key, and go into the submenu [Analog Input] from the Menu List. Then check that “Sensor Selection”...
- Page 4 ④ Setting the high-pass filter and low-pass filter Set the “High-pass filter” and the “Low-pass filter” in the [Analog Input] submenu, according to the measurement purpose. The followings are examples of setup for typical vibration measurements. ◆ Setup for the unbalance or misalignment measurement High-pass filter:10 Hz、...
-
Page 5: Measurement In Vibration Meter Mode
2. Measurement in Vibration Meter Mode ① Selecting the analysis function to “Vibration meter mode” after common setups. Press the VM/TIME/FFT key to select the Vibration meter mode. The analysis function can be selected to each mode as shown in the following figure by pressing the VM/TIME/FFT key. VM/TIME/FFT key Time Waveform Mode Vibration Meter Mode... -
Page 6: Measurement In Time Waveform Mode
④ Storing the measured data Store the data if necessary. When the STORE key is pressed, the data at that time is stored on SD card in VA-12. When in a paused state, the fixed data is stored. 3. Measurement in Time Waveform Mode ①... - Page 7 ② Selecting the measurement data type Select the measurement data type by pressing the ACC/VEL/DISP key. Acceleration, Velocity, Displacement, and Envelope are selectable. ACC/VEL/DISP/ ENVELOPE Upper limit time ACC/VEL/DISP key Number of analysis Frequency span lines ③ Input range setting Set the input range to an optimal setting.
- Page 8 ④ Setting the Frequency span and the Number of analysis lines Set up the Frequency span and the number of analysis lines so that the measured time waveform can be observed clearly by the FREQ SPAN key and the LINE key. The details of a time waveform can be observed when the frequency span is set to high, but the maximum display time becomes short.
-
Page 9: Measurement In Fft Analyzer Mode
⑦ Storing the measured data Store the data if necessary. When the STORE key is pressed, the data at that time is stored on SD card in VA-12. When in a paused state, the fixed data is stored. 4. Measurement in FFT Mode ①... - Page 10 ② Setting the Window function Press the MENU key, and go into the submenu [FFT] from the Menu List. Then select the “Window function” to a suitable setting. Setting the Window function The window function is chosen as follows according to the measurement purpose. ◆...
- Page 11 ④ Input range setting Set the input range to an optimal setting. The optimal setting is to use the lowest range where an overload does not occur. The key changes to the higher range, the key changes to the lower range. By changing input range, an electric transient noise occurs and overload may be displayed.
- Page 12 number of analysis lines. If the generated frequency cannot be predicted, measure the frequency roughly with high frequency span at first, then set the frequency span and the number of analysis lines so that the frequency resolution becomes narrower than 1 Hz. ⑥...
- Page 13 In order to start the operation function, press the INST/AVE key. In that case, an operation type is displayed at the upper left part of display. In Linear average, [LIN] is shown, in Exponential average, [EXP] is shown, and in Maximum hold, [MAX] is shown. The average number is also displayed. If the INST/AVE key is pressed again, it will change to the Instantaneous measurement and [INST] is shown.
- Page 14 SCALE ON/OFF key SCALE EXPAND/MOVE key ◆ Cursor move symbol : Move mode カーソル移動 Cursor move ◆ Graph zoom symbol : Zoom mode Y 軸拡大縮小 Y-axis expansion X 軸拡大縮小 X-axis expansion The keys for zoom operation are as follows. Expand Y-axis , Shrink Y-axis , Expand X-axis , Shrink X-axis...
- Page 15 STORE key ⑨ Storing the measured data Store the data if necessary. When the STORE key is pressed, the data at that time is stored on SD card in VA-12. When in a paused state, the fixed data is stored.
-
Page 16: Examples Of Typical Vibration Measurement
5. Examples of typical vibration measurement The followings are the examples of VA-12 settings for some typical vibration measurements. The minimum settings for the measurement are described. The input range should be set up according to the amplitude of vibration so that an overload may not occur. -
Page 17: Diagnosis Of Rolling Element Bearings
An example of misalignment:The shaft rotational frequency (20.25Hz), the third harmonics (60.75Hz) and the harmonics (121.5Hz) can be observed. Time waveform (velocity) FFT (velocity) 5.2 Diagnosis of rolling element bearings Since the acceleration increases if a bearing defect becomes large, vibration acceleration is measured to diagnose bearings. -
Page 18: Measurement Of Natural Frequency
In measurement, it is necessary to use the trigger function and the linear average. Refer to the instruction manual of VA-12 about the details of the trigger function. When an exciting point and an attached point of the accelerometer changes to the other position, the measured frequencies may change. - Page 19 FFT Scale:Log (The display range becomes wide when the FFT scale is set to Log. It is often used in impact excitation measurement.) Trigger operation mode:Repeat Trigger source:Level Pre-trigger:ON Trigger level:1/8 ~ 2/8 Slope:+ The trigger conditions are set in the submenu [Measurement]. Press the MENU key, and go into the submenu [Measurement] from the Menu List.
-
Page 20: Data Store And Recall
6. Data store and recall 6.1 Store and recall operations of measurement data ① Setting the Store Name Press the MENU key, and go into the submenu [Measurement] from the Menu List. Then set the “Store Name”. Specify the number which follows MAN_ like “0001” to any value. Up to 1000 data can be stored in one “Store Name”. - Page 21 ③ Recalling a stored data Press the MENU key, and go into the submenu [Recall] from the Menu List. Then select the “Store Name” and the Recall address. The data stored in the selected address is displayed by pressing the ENTER key. Selecting the store name Selecting the recall address ④...
-
Page 22: Store And Recall Operations Of Screen Bitmap Image
6.2 Store and recall operations of screen bitmap image The VA-12 allows storing the current screen image as a BMP file in a specified folder on the SD card. Since the stored BMP file can be treated by computer, it is useful for making a report. -
Page 23: Data Transfer To A Computer Via Usb
6.3 Data transfer to a computer via USB ① Connection between VA-12 and a computer Turn on the power supply of VA-12. Connect the USB connector of VA-12 and a computer with a USB cable. USB connecter ② Referring to data folders on SD card by a computer A computer recognizes the SD card in VA-12 as a removable disk. - Page 24 ③ Copying data files The measured data files exist in a folder “MAN_****”. In an example shown in the following figure, there are six data files in the folder “MAN_9999”. The extension names of the data files are RVD. Copy required data files to another folder in a computer.
-
Page 25: Data Import To Microsoft Excel
6.4 Data import to Microsoft Excel Since a measurement data file is written by CSV format, the data can be imported into Microsoft Excel. ① Starting Microsoft Excel Start Microsoft Excel and execute file open. The file open window appears as shown in the following figure. In this window, select the folder to import for example MAN_9999. - Page 26 ③ Opening the selected file Select the data file to open for example MAN_0004.RVD, and click the “Open”. ④ Determining that the selected file is delimited After clicking the “Open”, the “Text Import Wizard-Step 1 of 3” appears as shown in the following figure. In this wizard, select the “Choose the file type that best describes your data”...
- Page 27 ⑤ Setting the delimiters contained in the selected file After clicking the “Next”, the “Text Import Wizard-Step 2 of 3” appears. Check the checkbox of the “Comma”. Then click the “Finish”. ⑥ Importing the data to Microsoft Excel After clicking the “Finish”, the data are imported to Excel as shown in the following figure.
Need help?
Do you have a question about the VA-12 and is the answer not in the manual?
Questions and answers