Table of Contents
Advertisement
Quick Links
http://www.narda-sts.it
User's Manual
EQUIPMENT SERIAL NUMBER
You can find the Serial Number on the rear panel of the instrument.
Serial Number is in the form: 0000X00000.
The first four digits and the letter are the Serial Number prefix, the last five digits are
the Serial Number suffix. The prefix is the same for identical instruments, it changes
only when a configuration change is made to the instrument.
The suffix is different for each instrument.
Document 9010EN-70306-1.59 – Copyright © NARDA 2007
Sales & Support:
NARDA
Via Leonardo da Vinci, 21/23
Safety
20090 Segrate (MI) -
Test
Tel.: +39 02 2699871
Solutions
Fax: +39 02 26998700
S.r.l. Socio Unico
PMM 9010
EMI SIGNAL ANALYZER
10 Hz ÷ 30 MHz
Manufacturing Plant:
Via Benessea, 29/B
17035 Cisano sul Neva (SV)
ITALY
Tel.: +39 0182 58641
Fax: +39 0182 586400
Advertisement
Table of Contents

Related Manuals for L3 NARDA PMM 9010


Summary of Contents for L3 NARDA PMM 9010
- Page 1 Sales & Support: Manufacturing Plant: NARDA Via Leonardo da Vinci, 21/23 Via Benessea, 29/B Safety 20090 Segrate (MI) - 17035 Cisano sul Neva (SV) ITALY Test Tel.: +39 0182 58641 Tel.: +39 02 2699871 Solutions Fax: +39 0182 586400 Fax: +39 02 26998700 S.r.l.
- Page 2 NOTE: If the instrument is used in any other way than as described in this Users Manual, it may become unsafe Before using this product, the related documentation must be read with great care and fully understood to familiarize with all the safety prescriptions. To ensure the correct use and the maximum safety level, the User shall know all the instructions and recommendations contained in this document.
- Page 3 Contents Page Safety recommendations and instructions.………..………………. VIII EC Conformity Certificate……........……………… 1. General Information 1.1 Documentation…………………………………………………………. 1.2 Operating Manual changes…………………………………………… 1.3 Introduction to PMM 9010…………………………………………….. 1.4 Instrument Items………….……………………………………………. 1.5 Optional accessories……………….…………………………………. 1.6 Other accessories……………………………………………………… 1.7 Main Specifications……………………………………………………. 1.8 Front Panel………………………...…………………………………… 1.9 Rear Panel……………………………………………………………… 1.10 Functional Description………………………………………………..
- Page 4 4 Manual mode operating instructions 4.1 Introduction…………………………………………………………… 4.2 Measure………………………………………………………………. 4.2.1 Frequency………………………………………………………….. 4.2.2 Level………………….…………………………………………….. 4.2.2.1 Attenuator and Preamplifier……………………………………. 4.2.2.2 Misc…………………………………………………………….… 4.2.2.2.1 Tracking generator…………………………………………… 4.2.2.3 Detector………………………………………………………….. 4.2.2.4 Smart detector…………………………………………………... 4.2.3 Conversion factor…………………………………………………. 4.3 Limit…………………………………………………………………… 4.4 Display……………………………………………………………….. 4.5 Marker………………………………………………………………… 5 Analyzer mode operating instructions 5.1 Introduction………………………………………………………….
- Page 5 9 Click Mode Operating Instructions (Option) 9.1 Introduction…………………………………………………………… 9.2 Introduction to the discontinuous disturbance measurement…… 9.2.1 Determination of click rate……………………………………….. 9.2.2 Preliminary Conformity and Exceptions………………………… 9.2.2.1 Old and New exceptions……………………………………….. 9.2.3 Calculate Limit Quartile…………………………………………… 9.2.4 Measurements vs Lq limit………………………………………… 9.3 Start…………………………………………………………………… 9.3.1 Stop and pause……………………………………………………...
- Page 6 10 PMM 9030 EMI Signal Analyzer 30 MHz – 3GHz (Option) 10.1 Introduction to PMM 9030………………………………………………… 10-1 10-2 10.2 Instruments items………..………………………………………………… 10.3 Optional PMM accessories………..……………………………………… 10-2 10-2 10.4 Other accessories…………………..……………………………………… 10.5 Main specifications.………….………..…………………………………… 10-3 10-5 10.6 Front and rear panel………………………………………………………. 10.7 Functional description……………………………………………………..
-
Page 7: Table Of Contents
Figures Figure Page Front Panel………..…………………………………………….. Rear Panel………………………………………………………. BP-01 Replaceable battery……………………………………. PMM 9010 Functional Diagram……………………………….. Display setting..…………………………………………………. Sweep……………………………………………………………. Spectrum…….………………………………………………….. Manual…………………………………………………………… AMN Principle: a) ∆-type or T-type LISN ; b) V-type LISN…. Example of test Setup for RFI Voltage Measurements….…. Click……………………………………………………………… 10-1 Front and rear panel……………………………………………... - Page 8 SAFETY RECOMMENDATIONS AND INSTRUCTIONS This product has been designed, produced and tested in Italy, and it left the factory in conditions fully complying with the current safety standards. To maintain it in safe conditions and ensure correct use, these general instructions must be fully understood and applied before the product is used. •...
- Page 9 E C C o n f o r m i t y C e r t i f i c a t e (in accordance with the Directives: EMC 89/336/EEC and Low Voltage 73/23/EEC) This is to certify that the product: PMM 9010 Signal Analyzer Produced by: NARDA S.r.l.
- Page 10 This page has been left blank intentionally...
- Page 11 1 – General Information Enclosed with this manual are: 1.1 Documentation • a service questionnaire to send back to NARDA in case an equipment service is needed • an accessories checklist to verify all accessories enclosed in the packaging. Instruments manufactured after the printing of this manual may have a 1.2 Operating serial number prefix not listed on the title page;...
- Page 12 • L1-150: Single line LISN, 150A (50Ω//1 Ω+5µH); • L2-16: Two lines, Single phase, 16A LISN, (50Ω//5 Ω+50µH); • L3-32: Four lines, 3-phase, 32A LISN, (50Ω//5 Ω+50µH); • L3-64: Four lines, 3-phase, 64A LISN, (50Ω//5 Ω+50µH); • L3-100: Four lines, 3-phase, 100A LISN, (50Ω//5 Ω+50µH);...
- Page 13 1.7 Main Specifications Table 1-1 lists the PMM 9010 performance specifications. The following conditions apply to all specifications: • The ambient temperature shall be 0°C to 40°C TABLE 1-1 Main Specifications Electrical Characteristics Performance Limits 10 Hz to 30 MHz (CISPR-16-1-1 Full-Compliance Frequency range from 9 kHz to 30 MHz) Resolution...
- Page 14 Noise level (preamplifier ON) 9 to 150 kHz (200 Hz BW) < -8 dBµV (QP); < -15 dBµV (AV) 150 kHz to 30 MHz (9 kHz BW) < -4 dBµV (QP); < -10 dBµV (AV) Peak, Quasi-peak, Average, RMS, Smart Detector Measuring Detectors Level measuring time 1 ms to 30 sec.
-
Page 15: 1.8 Front Panel
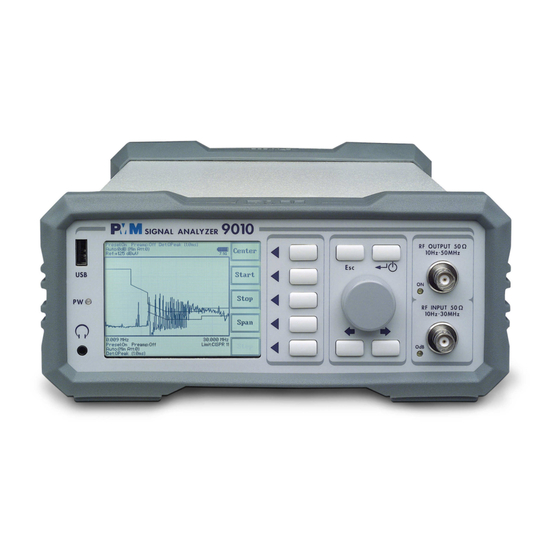
1.8 Front Panel Fig. 1-1 Front Panel Legend from left to right: - USB USB 2.0 connection port (future implementation only) - PW Power led Indicates the power status Earphone connector To listen to the demodulated signals - DISPLAY Main display To graphically show the instrument status - User keys 5 command keys... -
Page 16: 1.9 Rear Panel
1.9 Rear Panel Fig. 1-2 Rear Panel Legend from left to right: - RS232 9 pin, DB9 connector - GPIB IEEE488 I/O Port (optional) - USER PORT User I/O Port - USB Fully functional USB 2.0 Port - LINK1/LINK2 Optical link connectors for PMM equipments (Link 2 for future implementation) - Power Supply Power Supply Inputs for use to power the apparatus and simultaneously charge its battery (PS1) and to simply charge the battery when it’s out of the receiver... - Page 17 The PMM 9010 features a completely new receiver architecture based on 1.10 Functional the most recent DSP and RSP technology, as shown on the diagram below. Description The PMM 9010 diagram is shown in Fig. 1-4 Fig. 1-4 PMM 9010 Functional BLOCK Diagram 1.11 Ultra fast In the CISPR band A (9 ÷...
- Page 18 1.12 Emission All electric and electronic devices are potential generators of Electro- Magnetic Interference (EMI). measurements The term EMI thus refers to the electromagnetic energy emitted by a device which propagates itself along cables or through the air and couples with other devices that are present in the surroundings.
- Page 19 2 - Installation This section provides the information needed to install your PMM 9010. 2.1 Introduction It includes the information pertinent to initial inspection and power requirements, connections, operating environment, instrument mounting, cleaning, storage and shipment. When receiving the equipment, first inspect the shipping cardbox for any 2.2 Initial Inspection damages.
- Page 20 The charge status of the battery is displayed on the top right-hand corner of 2.5.3 Indication of the the screen in most of the receiver modes. The symbol of a small battery will battery status on be filled up proportionally to the status of the battery charge. the screen and with PW led When the battery is not under charge, the actual voltage value is displayed...
- Page 21 2.7 Return for Service If the instrument should be returned to NARDA for service, please complete the service questionnaire enclosed with the Operating Manual and attach it to the instrument. To minimize the repair time, be as specific as possible when describing the failure.
- Page 22 Fig. 2-1 PMM 9010 initial screen showing the results of the initial self-test and the five main function keys menu. When the PMM 9010 receiver is connected to a LISN to perform conducted 2.11 Using an Artificial interference measurements of the EUT, the RF output of the LISN shall be Mains Network connected to the RF input of the receiver.
- Page 23 2.13 Using Current and When a LISN cannot be used – e.g. when measurements have to be made on terminals other than the mains ones, such as load or command Voltage Probes terminals, sensitive to inserted capacities for example, or when LISNs of adequate current capabilities aren’t available, or when the line voltage is too high –...
- Page 24 This page has been left blank intentionally Installation...
-
Page 25: Display Setting
3 – Setup and Panel Instructions 3.1 Introduction Press this function key in the main menu to enter in the Setup window, which allows the Operator to set the global parameters of the receiver, visualization options, etc. The Setup function is divided into five sub windows: •... - Page 26 3.3 Autocal Pressing the Autocal button PMM 9010 starts performing its automatic self-calibration, using the internal precise tracking generator as a reference. The connection between the internal tracking generator and the input of the receiver is done automatically inside the instrument. To interrupt the self-calibration press the key Abort.
- Page 27 3.4 Unit Entering in the Unit menu it is possible to change the indicated unit used to display the measured levels. The available units are dBµV and dBm. In a 50 Ohm system the relationship between dBm and dBµV is: dBµV = dBm + 107 i.e., 0 dBm (1 mW) = 107 dBµV The tracking generator is an internal, high stability and accuracy, 50 Ohm...
- Page 28 This page has been left blank intentionally Setup and Panel Instructions...
- Page 29 4 - Sweep Mode Operating Instructions 4.1 Introduction The Sweep mode is used to operate the PMM 9010 as a powerful scanning receiver. To enter in this mode it’s enough to depress the Sweep soft key on the main screen, and immediately the scan setup window pops up and allows the operator to set the parameters for the scan.
-
Page 30: Sweep
The Sweep mode function is divided into five sub windows: • Measure • Limit • Display • Marker • Load Store Always use Esc button to return to the previous view/condition. 4.2 Measure The Measure button is used to set the scan parameters and to run the sweep. - Page 31 4.2.2 Level The Level function has 5 sub-menus, each one with several options.. Pressing the Display button it is possible to set two parameters: the visualized Dynamic range (chosen between 80, 100 and 120dB) and the Reference Level, that can be increased or reduced by steps of 5dB within the range +80 dBµV to 135 dBµV (-25 to +30 dBm).
- Page 32 4.2.2.2 Misc Under the Miscellanea functions menu it is possible to activate or exclude the Preselector filters, the Pulse Limiter, and also to enter in the Tracking generator menu pressing the RF OUT button. The Preselector is composed by a group of filters automatically selected by the PMM 9010 while it is sweeping or anyway measuring.
- Page 33 4.2.2.3 Detector This menu allows the operator to select the most appropriate detector for the test. In Sweep mode the Peak, Average, RMS (Root Mean Square) and Quasi- Peak detectors are available and can be selected via the appropriate button. Hold time (ms) The Hold Time (expressed in milliseconds) represents the time the receiver uses to “take a snapshot”...
- Page 34 4.2.3 Conversion factor When using a transducer to make a measurement – a Voltage or Current Probe, an Antenna, etc. – there is always the need to add to the measured values the conversion factor of the transducer in use. The Conversion factor may also take proper account of losses as cable loss, attenuators added externally to the receiver, etc.
- Page 35 4.5 Marker Selecting this function a Marker is immediately enabled, and it appears on the screen as a small black pointing down arrow corresponding to the highest reading; simultaneously a small window shows up in the bottom left corner of the screen, indicating the actual frequency and level read by the marker.
- Page 36 Pressing this key allows the User to have access to the memory of the 4.6 Load Store receiver enables storing number different configurations/sweeps that depends on the parameters set on the receiver (i.e. the number of measured points). For example, using standard CISPR parameters it is possible to store up to 15 sweeps on the A+B band.
- Page 37 5 - Analyzer Mode Operating Instructions 5.1 Introduction To enter in the ANALYZER Mode it’s enough to depress the Analyzer soft key on the main screen. In this mode the receiver works as a powerful Spectrum Analyzer and the display shows the "spectrum analysis" (span max 30 MHz) in the frequency domain of a signal tuned at a given frequency.
- Page 38 The Spectrum mode function is divided into five sub windows: • Frequency • Resolution Bandwidth • Level • Marker • Wide Mode The fifth button is used to change the spectrum view to wide screen mode, as shown in the picture 5-1, and with the Esc button the original view can be restored.
- Page 39 5.3 RBW The Resolution Bandwidth command is used to select the bandwidth of the measuring filter. Seven bandwidth filters are available: • 200 Hz CISPR 16 shaped at -6dB • 9 kHz CISPR 16 shaped at -6dB • 3 kHz at -3dB •...
- Page 40 Using 0 dB attenuation PMM 9010 has no input protection. This is a potentially dangerous condition for the input stage of the receiver. Use 0 dB attenuation only if you are very sure that your input signal is less than 1 V (or 120 dBµV). Before to apply an unknown signal to PMM 9010 receiver, use an oscilloscope or a wide band RF voltmeter to measure it.
- Page 41 5.4.3.1 Tracking The tracking generator is an internal, high stability and accuracy, 50 Ohm generator RF generator ranging from 10 Hz to 50 MHz. Activating the Tracking On function the generator is always tuned at the same PMM 9010 measurement frequency and scans the range together with the receiver.
- Page 42 5.4.5 Conversion factor When using a transducer to make a measurement – a Voltage or Current Probe, an Antenna, etc. – there is always the need to add to the measured values the conversion factor of the transducer in use. The Conversion factor may also take proper account of losses as cable loss, attenuators added externally to the receiver, etc.
-
Page 43: Manual
6 - Manual Mode Operating Instructions 6.1 Introduction The MANUAL mode is a very useful feature to manually control the receiver and to deeply investigate electrical signals modifying the parameters of receiver exactly as per the needs of the Test Engineer. It is possible, for example, to observe the signals exceeding the limits frequency by frequency;... - Page 44 The Manual mode function has five sub windows: • Frequency • Level • Resolution Bandwidth • Hold Time • Demodulation Always use Esc button to return to the previous view/condition. Under this menu it is possible to set the tuning frequency and also the knob 6.2 Frequency and the arrow keys steps.
- Page 45 6.3.1 Input: Attenuator Being entered in the Input submenu, to increase or decrease the and preamplifier attenuation at the input, press Att + or Att -, and for each touch the attenuation is increased or decreased of 5 dB (preset value). Depressing either one of these keys force the receiver in manual attenuation.
- Page 46 The Pulse Limiter is a very useful device to protect the input of the receiver from transient overvoltages. Doing conducted emission tests, quite often there are conducted disturbances (usually associated to switching operations in the EUT or along the line under test) which are too high and that propagates through the LISN up to the receiver.
- Page 47 6.4 RBW The Resolution Bandwidth command is used to select the bandwidth of the measuring filter. Seven bandwidth filters are available: • 200 Hz CISPR 16 shaped at -6dB • 9 kHz CISPR 16 shaped at -6dB • 3 kHz at -3dB •...
- Page 48 This page has been left blank intentionally Manual Mode Operating Instructions...
- Page 49 7 – Applications ElectroMagnetic Interference (EMI) voltage measurements on power supply 7.1 Measuring the lines or on signal lines are carried out by means of "Coupling Networks" EMI Voltage (e.g. LISNs) or other transducers (e.g. antennas, voltage probes). The frequency range is dictated by the applicable standard, however it is generally limited from 9 kHz to 30 MHz in commercial applications, while for measurements on other equipment/accessories - e.g.
-
Page 50: Amn Principle: A) ∆-Type Or T-Type Lisn ; B) V-Type Lisn
V-LISN test 250 µ H 50 µ H 0.25 µ F mains receiver mains 50 Ω 2 µ F 8 µ F lowpass 5 Ω highpass filter filter V-LISN (only one line is shown) test receiver RF load to interference asym asym unsym... - Page 51 Current Probes may be Clamp-on Probes or Fixed-ring Probes. 7.1.2.2 Current Probe Current Probes are used to measure differential or common mode RFI currents. In some cases it may be important to make a distinction between the two kinds of current flowing in a system. RFI current measurements with Current Probes may be required, for example, when measuring EMI from shielded lines or from complex wiring systems, when finding interference sources among other sources in a...
- Page 52 7.1.3 Test Setup Fig. 7-2. shows an example of test setup for RFI voltage measurement. The DUT is placed 0,4 m from an horizontal or vertical earthed conducting surface of at least 2 m x 2 m in size. A table top DUT is placed 0,8 m from the LISN and at least 0,8 m from any other earthed conducting surface.
- Page 53 To avoid errors caused by ambient interference, measurements should be 7.1.5 Remarks and Hints carried out inside a properly shielded room. Different sites, like basements for Measuring or other rooms with low ambient interferences, are often sufficient for a preliminary evaluation. Conducted measurements strictly...
- Page 54 This page has been left blank intentionally Applications...
- Page 55 8 - Updating firmware The PMM 9010 features a simple and user-friendly method for updating its 8.1 Introduction internal firmware through a Personal Computer (PC). This section provides all the information required for easy updating. 8.2 System requirements The minimum requirements to allow the software to operate properly are the following: •...
- Page 56 8.4 Software Installation The Update Firmware Program is installed together with the PMM 9010 Software Utility, provided on a CD-Rom with PMM 9010 Receiver. Once the PMM 9010 Software Utility has been installed in the PC, another item is created in the Programs list at Start Menu, which is “9010 Accessories”, from where the “9010 Update”...
- Page 57 8.5 To transfer data To finally perform the Firmware Update, switch OFF the PMM 9010 at first, run the “9010 Update” to make the related window appearing with the “Waiting for BIOS” writing at the bottom, then switch ON the PMM 9010 and the FW download will begin automatically.
- Page 58 This page has been left blank intentionally Updating Firmware...
-
Page 59: Click
9 - Click Mode Operating Instructions (Option) 9.1 Introduction The CLICK mode allows the User to make in a fast, easy and fully automatic way a difficult test like the Discontinuous Disturbances measurement, as defined by current CISPR standards. To enter in Click Mode press the key in the main menu, and immediately the first window opens as follow: Fig. - Page 60 9.2 Introduction Mechanical or electronic switching procedures - e.g. those due to thermostats or program controls – may unintentionally generate broadband to the discontinuous discontinuous disturbances with a repetition rate lower than 1 Hz. disturbance (click) Indeed, CISPR 16-2-1 and CISPR 14-1 define a discontinuous disturbance, measurement also called “click, as a disturbance the amplitude of which exceeds the quasi-peak limit of continuous disturbance, the duration of which is not...
- Page 61 The first step of the measuring process is to determine the click rate N in 9.2.1 Determination of the minimum observation time. This is done measuring the time needed to the click rate count up to 40 clicks or 40 switching operations; the maximum time allowed is anyway 2 hours (120 minutes), unless the cycle is determined by a program which needs additional time to be terminated.
- Page 62 9.2.3 Calculate Limit When the click rate N is determined it is possible to calculate the click limit Lq by increasing the relevant limit (quasi-peak) L for continuous Quartile disturbances with: ● 44 dB for N<0,2, or ● 20 log (30/N) dB for 0,2<N<30 Therefore 20 ⋅...
- Page 63 In certain conditions the analyzer may judge the input attenuation is not adequate: in that case a screen like the following appears and requires additional attenuation. It’s enough to touch OK to adjust the input attenuation to the optimum value and continue the test.
- Page 64 9.4 Report After a Click test the PMM 9010 reports all the relevant data. Due to the complexity of the test and to the various conditions that may happen during the measurement, several reports may be issued. Here following some examples well representing the completeness and the accuracy of the analyzer.
- Page 65 9.4.3 Report after a Here following the example of a report for a test done on all the defined frequencies. successful test at 4 All the relevant information is provided. frequencies When connected to a PMM LISN, the PMM 9010 can also automatically 9.4.4 Report after a line search for the worst line.
- Page 66 9.5 Setup Due to the complexity of the discontinuous disturbance test, this panel is rather complex, as many parameters shall be defined. However, the PMM 9010 has been designed to be extremely user-friendly and to take care in a fully automatic way of all the necessary steps of the test.
- Page 67 9.5.3 Determination of N As required by the standard, N may be determined either by counting the clicks, or by counting the switching operations. Select Clicks if N has to be calculated on the number of clicks, or select Sw.Op.+ or Sw.Op.- to determine N on the number of switching operations, going up and down the list of the available options in terms of switched current: 10mA;...
- Page 68 9.5.6 Terminate on To define the automatic stop condition, it is possible to select between two options: 40 Clicks/Time and Time/Manually. In the first case the stop of the step happens either after 40 clicks or after the defined time has elapsed; in the second case the step is not terminated when reaching 40 clicks (allowing thus testing EUTs which are commanded by a program) but only when the defined time has elapsed.
- Page 69 Once the PMM LISN sub-menu has been selected, a choice is available to define if to run the test on a specific Line (L1, L2, L3, N) or to perform the test automatically on each test frequency, one Line after...
- Page 70 9.5.8 Max Time To define the duration of the test it’s enough to enter the relevant time in minutes in the usual way. A frequency (0,15 – 0,5 – 1,4 – 30 MHz) can be selected for preliminary 9.5.9 Idle Frequency investigation in Idle Mode.
- Page 71 9.6 Click option The click option includes: • Switching Operation Box; • Power supply cable for the switching Box; • EUT Power connector; • User Port cable, 2m; • 20 dB external coaxial attenuator; • Activation Code For quick reference look at the following picture. Click Mode Operating Instructions 9-13...
-
Page 72: Led Status
9.7 Test Set up As required by the relevant standards, the discontinuous measurement (Click) test set up shall be the same adopted for continuous disturbances, therefore usually a LISN is used to sample the RF signal to be measured. In case the click rate N shall be determined counting the number of “Switching”... - Page 73 10 – PMM 9030 EMI Signal Analyzer 30 MHz - 3 GHz (Option) 10.1 Introduction The PMM 9030 is a powerful EMI receiver, fully CISPR 16-1-1, which extends capabilities of PMM 9010 to measure conducted and radiated to PMM 9030 interferences from 30 MHz up to 3 GHz.
- Page 74 PMM 9030 includes the following items: 10.2 Instrument Items • EMI receiver from 30 MHz up to 3 GHz • BP-01 Li-Ion battery pack; • External power supply/battery charger; • 20m Fiber Optic Cable; • Antenna Holding/Support with adapters for various antennas; •...
- Page 75 10.5 Main Specifications Table 10-1 lists the PMM 9030 performance specifications. The following conditions apply to all specifications: • thanks to its analogue+digital architecture, the PMM 9030 needs only 15 minutes of warm-up period before to operate in full-compliance with specifications;.
-
Page 76: Spectrum
Noise level (preamplifier ON) < -1 dBµV (QP); < -5 dBµV (AV) 30 to 300 MHz (120 kHz BW) < 2 dBµV (QP); < -2 dBµV (AV) 300 MHz to 3 GHz (120 kHz BW) Peak, Quasi-peak, Average, RMS, Smart Detector Measuring Detectors Level meas. -
Page 77: Front And Rear Panel
10.6 Front and Rear Panel Fig. 10-1 Front and Rear Panels Only the input N connector is available on the front panel. All other interfaces and connections are on the rear panel. Legend top-down, from left to right on the rear panel: - Replaceable Li-Ion Battery with Battery Charger connector - OPTIC LINK Optical link connector for PMM 9010... -
Page 78: Pmm 9030 Functional Block Diagram
The PMM 9030 features a completely new receiver architecture based on 10.7 Functional the most recent DSP technology, as shown on the diagram below. Description The PMM 9030 block diagram is shown in Fig. 10-2 Fig. 10-2 PMM 9030 Functional BLOCK Diagram 10.8 No coaxial cable Thanks to its very limited dimensions and lightweight construction, the PMM 9030 can be connected directly to the antenna using the supplied... - Page 79 10.9 Emission electric electronic devices potential generators ElectroMagnetic Interference (EMI). measurements The term EMI thus refers to the electromagnetic energy emitted by a device which propagates itself along cables or through the air and couples with other devices that are present in the surroundings. These electromagnetic fields (conducted or radiated interferences) may generate interfering currents and voltages into nearby equipment and therefore can cause possible malfunctions.
- Page 80 10.10 - Installation This section provides the information needed to install your PMM 9030. 10.10.1 Introduction It includes the information pertinent to initial inspection and power requirements, connections, operating environment, instrument mounting, cleaning, storage and shipment. 10.10.2 Initial Inspection When receiving the equipment, first inspect the shipping cardbox for any damages.
- Page 81 The charge status of the battery is displayed at the right and on the middle 10.10.4.3 Indication of of the PM9010 screen when initializing the PMM 9030. the battery The symbol of a small battery will be filled up proportionally to the status of status on the battery charge.
- Page 82 The operating environment of the receiver is specified to be within the 10.10.5 Environment following limits: • Temperature +0° to +40° C < 90% relative • Humidity 4000 meters • Altitude The instrument should be stored and shipped in a clean, dry environment which is specified to be within the following limitations: •...
-
Page 83: Pmm 9030 Fiber Optic Link To Pmm 9010
10.10.9 Hardware PMM 9030 is delivered from factory ready to use as a companion of the PMM 9010. Installation Remove the receiver from its cardboard and install it where desired, e.g. directly on the antenna output connector (see detailed instruction later on in this manual), or anyway connect the output of your antenna or transducer device to the N connector on the front panel of PMM 9030 and immediately start to measure up to 3 GHz. - Page 84 10.10.10 PMM 9010 + PMM 9030 initial screen The PMM 9030 is now ready to work in conjunction with the PMM 9010. 10.10.11 LED on the When the PMM 9030 is connected to PMM 9010, the yellow led next to the RF input of PMM 9010 (“0dB led”) blinks to indicate that an expansion unit PMM 9010 is connected and that this BNC input shall be kept free of any other...
- Page 85 10.10.13 PMM 9010 + No changes in this panel, but that the Autocalibration function is no longer available in this condition. PMM 9030 Setup panel PMM 9030 Frequency Extension 10-13...
- Page 86 When, for any reason, the optical connection between PMM 9010 and 10.10.14 PMM 9010 + PMM 9030 is lost, a message is shown on the screen like the following: PMM 9030 Link failure In this case, press the button 9030 Search: if there are no changes, check the PMM 9030 and verify it is ON.
-
Page 87: Pmm 9030 Antenna Holder Spare Parts
10.10.15 Using an In the frequency range from 30 MHz to 3 GHz two different antennas, a Biconic and a Log-Periodic can be used to pick-up and measure RF radiated Antenna emissions; alternatively, some Biconi-Log antennas are also available to cover the whole range without changing between two antennas, even if such a solution is mostly more expensive and the antenna size is usually bigger. -
Page 88: Mounting The Tripod Joint
Assembling Steps (from left to right) Fig. 10-5 Mounting the Tripod Joint Fig. 10-6 Fixing the base of Antenna Holder Fig. 10-7 Closing the Antenna Holder Fig. 10-8 Inserting the Adapter for PMM Log-Periodic 10-16 PMM 9030 Frequency Extension... -
Page 89: Complete Assembling
Fig. 10-9 Complete assembling Fig 10-10 Complete assembling for other antennas Fig. 10-11 Mounting the Antenna Holder on PMM 9030 Fig. 10-12 Screwing the N-N Adapter for Antenna Matching Fig. 10-13 Fixing onto the Tripod Fig. 10-14 Attaching PMM LogPeriodic PMM 9030 Frequency Extension 10-17... - Page 90 10.11 - Analyzer Mode Operating Instructions 10.11.1 Introduction To enter in the ANALYZER Mode it’s enough to depress the Analyzer soft key on the main screen. In this mode the receiver works as a powerful Spectrum Analyzer and the display shows the "spectrum analysis" (span max 3 GHz) in the frequency domain of a signal tuned at a given frequency.
- Page 91 The Spectrum mode function is divided into five sub windows: • Frequency • Resolution Bandwidth • Level • Marker • Wide Mode The fifth button is used to change the spectrum view to wide screen mode, as shown in the picture 4-1, and with the Esc button the original view can be restored.
- Page 92 The Level function has 5 sub-menus, each one with several options. 10.11.4 Level Pressing the Display button it is possible to set two parameters: the visualized Dynamic range (chosen between 80, 100 and 120dB) and the Reference Level, that can be increased or reduced by steps of 5dB within the range +55 dBµV to 90 dBµV (-50 to - 15 dBm).
- Page 93 10.11.4.2 Misc Under the Miscellanea functions menu it is possible to activate or exclude the Preselector filters and also to set the Tracking Generator. The Preselector is composed by a group of filters automatically selected by the PMM 9030 while it is sweeping or anyway measuring. The aim of the preselector is to reduce the amount of out-of-band energy entering in the receiver, thus helping a lot in reducing intermodulation problems and similar undesired behaviors.
- Page 94 When using a transducer to make a measurement – a Voltage or Current 10.11.4.4 Conversion Probe, an Antenna, etc. – there is always the need to add to the measured factor values the conversion factor of the transducer in use. The Conversion factor may also take proper account of losses as cable loss, attenuators added externally to the receiver, etc.
- Page 95 10.12 - Sweep Mode Operating Instructions 10.12.1 Introduction The Sweep mode is used to operate the PMM 9030 as a powerful scanning receiver. To enter in this mode it’s enough to depress the Sweep soft key on the main screen, and immediately the scan setup window pops up and allows the operator to set the parameters for the scan.
-
Page 96: Sweep
The Sweep mode function is divided into five sub windows: • Measure • Limit • Display • Marker • Load Store Always use Esc button to return to the previous view/condition. 10.12.2 Measure The Measure button is used to set the scan parameters and to run the sweep. - Page 97 10.12.2.2 Advanced The Advanced submenu features five function buttons: RBW Auto automatically adjust the resolution bandwidth to selected frequency range as per the CISPR standards. The User can also decide which resolution bandwidth use simply selecting either one of the 2 bands available: 120 kHz or 1 MHz. The Start and Stop frequency buttons can be used to set any frequency interval for the measurement;...
- Page 98 Being entered in the Input submenu, to increase or decrease the attenuation 10.12.2.3.1 Input: Attenuators at the input, press Att + or Att -, and for each touch the attenuation is increased or decreased of 5 dB (preset value) up to the max attenuation available of 55 dB.
- Page 99 10.12.2.3.4 Detector This menu allows the operator to select the most appropriate detector for the test. In Sweep mode the Peak, Average, RMS (Root Mean Square) and Quasi- Peak detectors are available and can be selected via the appropriate button. Hold time (ms) The Hold Time (expressed in milliseconds) represents the time the receiver uses to “take a snapshot”...
- Page 100 10.12.4 Display Pressing the Display button it is possible to set two parameters: the visualized Dynamic range (chosen between 80, 100 and 120dB) and the Reference Level, that can be increased or reduced by steps of 5dB within the range +55 dBµV to 90 dBµV (-50 to - 15 dBm). 10.12.5 Marker Selecting this function a Marker is immediately enabled, and it appears on the screen as a small black pointing down arrow corresponding to the highest...
- Page 101 10.12.6 Load Store Pressing this key allows the User to have access to the memory of the receiver enables storing number different configurations/sweeps that depends on the parameters set on the receiver. For example, using standard CISPR parameters it is possible to store up to 5 sweeps on the C+D+E bands (RBW120 kHz and 1 MHz, respectively).
-
Page 102: Manual
10.13 - Manual Mode Operating Instructions 10.13.1 Introduction The MANUAL mode is a very useful feature to manually control the receiver and to deeply investigate electrical signals modifying the parameters of receiver exactly as per the needs of the Test Engineer. It is possible, for example, to observe the signals exceeding the limits frequency by frequency;... - Page 103 The Manual mode function has five sub windows: • Frequency • Level • Resolution Bandwidth • Hold Time • Demodulation Always use Esc button to return to the previous view/condition. Under this menu it is possible to set the tuning frequency and also the knob 10.13.2 Frequency and the arrow keys steps.
- Page 104 10.13.3.1 Input: Being entered in the Input submenu, to increase or decrease the Attenuator and attenuation at the input, press Att + or Att -, and for each touch the preamplifier attenuation is increased or decreased of 5 dB (preset value) up to the max attenuation available of 55 dB.
- Page 105 The Tracking generator is an internal, high stability and accuracy, 50 Ohm RF generator ranging from 10 Hz to 50 MHz. It is a CW signal source tuned at the frequency set under the RF OUT Freq window. As usual, to set a given frequency it is therefore enough to edit the value with the soft keys and the left an right arrows, confirming the selections entering the units value (kHz, MHz or GHz).
- Page 106 Switching ON the built-in AM demodulator, the volume can be adjusted with 10.13.6 Demodulator the rotating knob, and the level is shown by the black bar on the screen. The demodulated signals can be heard with headphones or earphones connected to the front panel of the PMM 9010, or amplified and/or recorded by any suitable device.
- Page 107 Sales & Support: Manufacturing Plant: NARDA Via Leonardo da Vinci, 21/23 Via Benessea, 29/B Safety 20090 Segrate (MI) - 17035 Cisano sul Neva (SV) ITALY Test Tel.: +39 0182 58641 Tel.: +39 02 2699871 Solutions Fax: +39 0182 586400 Fax: +39 02 26998700 S.r.l.
- Page 108 Suggerimenti / Commenti / Note: Suggestions / Comments / Note:...
Need help?
Do you have a question about the NARDA PMM 9010 and is the answer not in the manual?
Questions and answers