
Related Manuals for R&S RTE


Summary of Contents for R&S RTE
- Page 1 ® R&S Oscilloscope Getting Started (=J:J2) 1326102602 Version 10 Distributed by: Sie haben Fragen oder wünschen eine Beratung? Angebotsanfrage unter +49 7121 / 51 50 50 oder über info@datatec.eu...
- Page 2 ® This manual describes the following R&S RTE models with firmware version 4.80 and higher: ● R&S ® RTE1022: 200 MHz, 2 channels (1326.2000K22 and 1317.2500K22) ● R&S ® RTE1024: 200 MHz, 4 channels (1326.2000K24 and 1317.2500K24) ● R&S ®...
-
Page 3: Table Of Contents
® Contents R&S Contents 1 Safety and regulatory information........7 1.1 Safety instructions................7 1.2 Labels on the product................ 13 1.3 Warning messages in the documentation........14 1.4 Korea certification class A..............14 2 Key features................. 15 3 Documentation overview............ 16 3.1 Manuals and instrument help............16 3.2 Data sheet and brochure..............17 3.3 Release notes, open source acknowledgment........ - Page 4 ® Contents R&S 6 Trying out the instrument........... 45 6.1 Displaying a basic signal..............45 6.2 Acquiring data..................47 6.3 Changing the waveform scaling and position......... 48 6.4 Zooming into the display..............54 6.5 Displaying the waveform history............56 6.6 Showing basic measurement results..........58 6.7 Performing a basic FFT analysis............66 6.8 Performing mathematical calculations..........
- Page 5 ® Contents R&S 8.1 Performing a self-alignment.............113 8.2 Setting the display language............114 8.3 Adjusting passive probes..............114 9 Contacting customer support...........116 Index..................117 Getting Started 1326.1026.02 ─ 10...
- Page 6 ® Contents R&S Getting Started 1326.1026.02 ─ 10...
-
Page 7: Safety And Regulatory Information
7. Intended use The R&S RTE oscilloscope is designed for measurements on circuits that are only indirectly connected to the mains or not connected at all. It is not rated for any measurement category. The product is intended for the development, production and verification of elec- tronic components and devices in industrial, administrative, and laboratory envi- ronments. - Page 8 ® Safety and regulatory information R&S Safety instructions Using the product requires specialists or specially trained personnel. These users also need sound knowledge of at least one of the languages in which the user interfaces and the product documentation are available. Never open the casing of the product.
- Page 9 ® Safety and regulatory information R&S Safety instructions Setting up the product Always place the product on a stable, flat and level surface with the bottom of the product facing down. If the product is designed for different positions, secure the product so that it cannot fall over.
- Page 10 ® Safety and regulatory information R&S Safety instructions ● Only use intact cables and route them carefully so that they cannot be dam- aged. Check the power cables regularly to ensure that they are undamaged. Also ensure that nobody can trip over loose cables. ●...
- Page 11 ® Safety and regulatory information R&S Safety instructions tweezers or pliers to avoid injuries. When transporting the accessories, always use the box supplied with the probe. ● Prevent the probe from receiving mechanical shock. Avoid putting excessive strain on the probe cable or exposing it to sharp bends. Touching a broken cable during measurements can cause injuries.
- Page 12 ® Safety and regulatory information R&S Safety instructions ● The following effects can cause burns and fire or damage to the measurement site: – Eddy current loss can cause heating of the sensor head. – Dielectric heating can cause heating of cord insulation and other materials. Measurement categories IEC 61010-2-030 defines measurement categories that rate instruments on their ability to resist short transient overvoltages that occur in addition to the working...
-
Page 13: Labels On The Product
® Safety and regulatory information R&S Labels on the product Cleaning the product Use a dry, lint-free cloth to clean the product. When cleaning, keep in mind that the casing is not waterproof. Do not use liquid cleaning agents. Meaning of safety labels Safety labels on the product warn against potential hazards. -
Page 14: Warning Messages In The Documentation
® Safety and regulatory information R&S Korea certification class A Warning messages in the documentation A warning message points out a risk or danger that you need to be aware of. The signal word indicates the severity of the safety hazard and how likely it will occur if you do not follow the safety precautions. -
Page 15: Key Features
● High-quality line of probes For a detailed specification refer to the data sheet. The R&S RTE oscilloscope brings various benefits in your daily work: ● Find rare signal faults quickly with no trade-offs for measurement and analysis due to highest acquisition rate and shortest blind time. -
Page 16: Documentation Overview
Getting started manual Introduces the R&S RTE and describes how to set up and start working with the instrument, and describes basic operations. A printed English version is included in the delivery. Editions in other languages are available on the product website. -
Page 17: Data Sheet And Brochure
Data sheet and brochure The data sheet contains the technical specifications of the R&S RTE. It also lists the options with their order numbers and optional accessories. The brochure pro- vides an overview of the instrument and deals with the specific characteristics. -
Page 18: Preparing For Use
® Preparing for use R&S Choosing the operating site Preparing for use Here, you can find basic information about setting up the instrument for the first time or when changing the operating site. Lifting and carrying See: "Lifting and carrying the instrument" on page 8. -
Page 19: Setting Up The Product
® Preparing for use R&S Setting up the product Electromagnetic compatibility classes The electromagnetic compatibility (EMC) class indicates where you can operate the product. The EMC class of the product is given in the data sheet under "Gen- eral data". ●... - Page 20 Design and implement an efficient ventilation concept for the rack. To mount the R&S RTE in a rack 1. Use an adapter kit that fits the dimensions of the R&S RTE to prepare the instrument for rack mounting. For information on the dimensions, see data sheet.
-
Page 21: Considerations For Test Setup
® Preparing for use R&S Considerations for test setup b) Mount the adapter kit. Follow the assembly instructions provided with the adapter kit. 2. Push the product onto the shelf until the rack brackets fit closely to the rack. 3. Tighten all screws at the rack brackets with a tightening torque of 1.2 Nm to secure the product at the rack. -
Page 22: Connecting To Power
For safety information, see "Connecting to power and grounding" on page 9. The R&S RTE can be used with different AC power voltages and adapts itself automatically to it. The nominal ranges are: ● 100 V to 240 V AC at 50 Hz to 60 Hz and 400 Hz, with maximal 10% voltage fluctuation on line ●... -
Page 23: Switching On Or Off
2. Press the [POWER] key on the front panel. The instrument performs a system check, boots the operating system, and then starts the R&S RTE firmware. The [POWER] key turns green and the illuminated keys on the front panel light up. If the previous session was terminated regularly, the oscilloscope uses the last settings. -
Page 24: Connecting External Devices
The number of USB connectors can be increased by using USB hubs. Due to the large number of available USB devices, there is almost no limit to the expansions that are possible with the R&S RTE. The following USB devices can be useful, for example: ●... - Page 25 The properties of external USB devices are configured in the operating system, not in the R&S RTE software. It is recommended that you use mouse and key- board to access and modify the settings of the Windows operating system.
- Page 26 3. Select "Printers & scanners". 4. Select "Add a printer or scanner". 4.8.2 Connecting an external monitor You can connect an external monitor or projector to the R&S RTE. The following connectors are available: ● "MONITOR (DVI-D)" on page 32 Before connecting an external monitor, ensure that the monitor and the R&S RTE...
- Page 27 R&S Connecting external devices The touchscreen of the R&S RTE has a screen resolution of 1024 x 768 pixel. Many external monitors have a higher screen resolution. If the screen resolution of the monitor is set higher than the instrument's resolution, the application win- dow uses a 1024 x 768 area of the monitor display.
-
Page 28: Instrument Tour
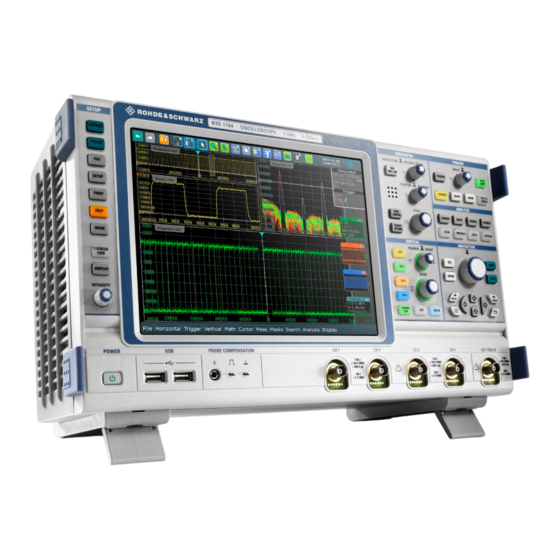
This chapter describes the front and rear panels of the instrument including all function keys and connectors. Front panel The front panel of the R&S RTE is shown in Figure 5-1. The function keys are grouped in functional blocks to the left and the right of the touchscreen. Below the screen, various connectors are located. - Page 29 5.1.1 Input connectors The R&S RTE has two or four channel inputs to connect the input signals, and an external trigger input to control the measurement by an external signal. The input connectors are provided with a special Rohde & Schwarz active probe interface, and they are BNC compatible.
-
Page 30: Rear Panel
DUT and test fixtures, and wrist strap. Square wave signal for probe compensation, 1 kHz and 1 V Ground connector for probes. Rear panel Figure 5-2 shows the rear panel of the R&S RTE with its connectors. Getting Started 1326.1026.02 ─ 10... - Page 31 6 = External trigger output 7 = Reference input/output 8 = Slot for hardware option: mixed signal option R&S RTE-B1 (shown in picture), or waveform generator R&S RTE-B6, or GPIB connector R&S RTE-B10) 9 = Kensington lock slot to secure the instrument against theft...
- Page 32 When a trigger occurs, the R&S RTE creates a pulse of 5 V with a source impe- dance of 50 Ω and delivers it to the external trigger output. The instrument can also send the pulse on mask test violation or violation of measurement limits and margins.
-
Page 33: Keys And Controls
Keys and controls Mixed signal option R&S RTE-B1 / digital extension port R&S RTE-B1E The mixed signal option R&S RTE-B1 provides logic analizer functionality and 16 digital channels. It also can connect the R&S RT-ZVC multi-channel power probe. The connectors are used to connect two logical probes with 8 digital channels each (D0 to D7 and D8 to D15), or two flat interface cables of R&S RT-ZVC. - Page 34 ® Instrument tour R&S Keys and controls See also: Chapter 4.7, "Switching on or off", on page 23. 5.3.2 SETUP controls SETUP keys set the instrument to a defined state, change basic settings, and provide saving and help functions. The intensity rotary knob adjusts the display contrast for several display elements.
- Page 35 ® Instrument tour R&S Keys and controls [HELP] Opens the appropriate help topic for the active tab. If no dialog box is open, the contents page of the help appears. [MODE] Opens and closes a dialog box where you can change the instrument mode: ●...
- Page 36 ® Instrument tour R&S Keys and controls [RES REC LEN], [HORIZONTAL] Open and close the "Setup" tab in the "Horizontal" dialog box, where you can: ● Adjust the time scale, and acquisition time ● Adjust the horizontal position, and reference point ●...
- Page 37 ® Instrument tour R&S Keys and controls "Horizontal position" defines the time distance of the reference point from the zero point of the diagram. Turn clockwise to move the waveform to the right. "Reference point" defines the position of the reference point on the screen. Turn clockwise to move it to the right.
- Page 38 ® Instrument tour R&S Keys and controls ● If the waveform is selected: Pressing the key opens the "Vertical" dialog box for the appropriate channel. The vertical rotary knobs are focused on the selected waveform. They are illumi- nated in the color of the selected waveform. [REF] Opens the "Reference"...
- Page 39 ® Instrument tour R&S Keys and controls The key is illuminated in the color of the selected signal and changes the color according to the new selection. 5.3.5 TRIGGER controls The keys and knob in the TRIGGER functional block adjust the trigger and start or stop acquisition.
- Page 40 ® Instrument tour R&S Keys and controls [RUN CONT] Starts and stops the continuous acquisition. A green light indicates a running acquisition. A red light shows that acquisition is stopped. [RUN N× SINGLE] Starts a defined number of acquisitions. A green light indicates a running acquisi- tion.
- Page 41 ® Instrument tour R&S Keys and controls [MEAS] Starts the default automatic measurement for the active waveform and opens the "Measurement" result box. If you press the [MEAS] key while a measurement is enabled, the "Measure- ments" dialog box is displayed, where you can: ●...
- Page 42 ® Instrument tour R&S Keys and controls [LOGIC] Opens the dialog box for configuration of parallel buses and digital channels. The key lights up if you enable at least one parallel bus. You can switch off the selected bus using the [SIGNAL OFF] key. [HISTORY] The sample memory contains several stored acquisitions before the current one, which is shown in the display.
- Page 43 ® Instrument tour R&S Keys and controls ● To move zoom area, cursor line, or gate in diagrams: Turn to move the ele- ment that has the focus, and press to toggle the focus. [ESC] Closes a dialog box or input box. [UNDO] Reverses the last setting actions step by step.
- Page 44 ® Instrument tour R&S Keys and controls ● In dialog boxes, for option buttons in a column: select an option. In an open selection list, the keys scroll the list. Left arrow [⇦], Right arrow [⇨] The left and right arrow keys have the following effects: ●...
-
Page 45: Trying Out The Instrument
Displaying a basic signal Displaying the input from a signal channel is simple and straightforward. Further- more, you get to know some basic trigger functions. The R&S RTE provides wide- ranging trigger functions to find various signal anomalies, which are described in the instrument help and in the "User Manual". - Page 46 ® Trying out the instrument R&S Displaying a basic signal Connect the probe's ground connector to the right compensation pin , and the tip to the left pin The instrument recognizes the probe, and a signal is displayed in the diagram. 3.
-
Page 47: Acquiring Data
® Trying out the instrument R&S Acquiring data 8. Tap the "Undo" icon on the toolbar repeatedly until the trigger mode is "Auto" and the trigger source is "CH1". 9. Press the [SLOPE] key to toggle the trigger slope. Watch the waveform and the "Trigger" settings. Acquiring data You can acquire data using different arithmetic methods to get envelope or aver- age waveforms. -
Page 48: Changing The Waveform Scaling And Position
® Trying out the instrument R&S Changing the waveform scaling and position The dialog box turns into a mini box that contains only the "Wfm Arithmetic" setting. 5. Select Envelope and check the waveform. The instrument sets the "Decimation" type automatically to Peak detect to dis- play the correct envelope waveform. - Page 49 ® Trying out the instrument R&S Changing the waveform scaling and position If you use a passive probe, you can filter the DC component by using the AC cou- pling function. Then you quickly find the new trigger level, and try out the scaling functions: 1.
- Page 50 ® Trying out the instrument R&S Changing the waveform scaling and position 3. To move the waveform back to the center of the screen, eliminate the offset in the vertical settings: a) Press the [Ch1] key again. b) Enter 0 V in the "Offset" field. The waveform is now displayed in the center of the display, with the x-axis crossing at 0 V.
- Page 51 ® Trying out the instrument R&S Changing the waveform scaling and position 5. Tap the "Find level" icon on the toolbar. The instrument adjusts the trigger level, and a stable waveform is displayed. Getting Started 1326.1026.02 ─ 10...
- Page 52 ® Trying out the instrument R&S Changing the waveform scaling and position 6. To examine one pulse in the signal in more detail, turn the horizontal "Scale" rotary knob. The current scale factor per division is displayed in the upper left-hand corner of the display while you turn the knob.
- Page 53 ® Trying out the instrument R&S Changing the waveform scaling and position 7. To return to the original scaling, try the [UNDO] key in the [NAVIGATION] area: a) Press the [UNDO] key repeatedly until the original scaling is displayed. b) Press the [REDO] key to retrace the undone steps. Thus, you can toggle between the two displays using the undo and redo keys until you perform a different action.
-
Page 54: Zooming Into The Display
® Trying out the instrument R&S Zooming into the display Zooming into the display Using the [SCALE] rotary knobs, you can change the scaling of the time base and signal amplitudes in order to enlarge the waveform. If you need to see more details, use one of the zoom functions. - Page 55 ® Trying out the instrument R&S Zooming into the display 4. To remove the zoom window and make room on the display for other results, tap the "Delete" icon and then the zoom window. 6.4.2 Using the fingertip zoom 1. Touch the "Zoom" icon on the toolbar and drag it down until the "Zoom" tool- bar menu opens.
-
Page 56: Displaying The Waveform History
® Trying out the instrument R&S Displaying the waveform history 3. Touch and hold the waveform and move your finger slowly in horizontal direc- tion. Tip: You can turn the NAVIGATION knob to change the zoom factor while holding the waveform. 4. - Page 57 ® Trying out the instrument R&S Displaying the waveform history 1. In the [HORIZONTAL] area, press the [ACQUISITION] key. The "Horizontal" settings dialog box opens. 2. Set the "Average count" to 10 to perform 10 waveform acquisitions. 3. Close the "Horizontal" dialog box. 4.
-
Page 58: Showing Basic Measurement Results
The history mode is disabled. The [HISTORY] key is no longer illuminated. Showing basic measurement results Using the R&S RTE you can perform and display different measurements simul- taneously. The color of the results in the result table corresponds with the source waveform color. - Page 59 ® Trying out the instrument R&S Showing basic measurement results 5. To save space in the display, minimize the result box. The most important results are displayed and updated in the result icon, as well. 6. To remove the result icon and make room on the display for other results, tap the red cross on the icon label.
- Page 60 ® Trying out the instrument R&S Showing basic measurement results 2. Tap the "Automatic measurment" icon. Then tap the waveform. By default, the measurement of the high signal level is started. 3. Tap the "Automatic measurement" icon again. Then tap the waveform. By default, the measurement of the low signal level is started.
- Page 61 ® Trying out the instrument R&S Showing basic measurement results 9. Select "Fall time". 10. Under "Statistics", tap "Enable". 11. Close the "Measurements" dialog box and check the results. 12. To see all results, drag up the border of the results tab. 13.
- Page 62 ® Trying out the instrument R&S Showing basic measurement results 3. Tap the diagram. The result box shows the results of the default quick measurement. 4. Tap the icon to open the "Measurements" dialog box. 5. Select the "Quick Meas" "Setup". 6.
- Page 63 ® Trying out the instrument R&S Showing basic measurement results Now the result box also shows the result of the time measurements. 9. Tap "Set as QuickMeas". The current configuration is set as default quick measurement and can be repeated until you save another configuration. 10.
- Page 64 ® Trying out the instrument R&S Showing basic measurement results 6.6.4 Displaying a histogram Histograms are useful to analyze the occurrence of measurement values statisti- cally. 1. Tap the "Histogram" icon on the toolbar. 2. Tap the diagram in which you want to generate the histogram. You can also draw a rectangle on the screen to define the area on which the histogram is based.
- Page 65 ® Trying out the instrument R&S Showing basic measurement results 3. To display the measurement results for the histogram, tap the "Measurement" icon on the toolbar. 4. Tap the histogram. The waveform count for the histogram is displayed. 5. To get more measurement results for the histogram, double-tap the results. Alternatively, you can press the [MEAS] key on the front panel.
-
Page 66: Performing A Basic Fft Analysis
® Trying out the instrument R&S Performing a basic FFT analysis Both the histogram and any measurements based on that histogram are deac- tivated. Performing a basic FFT analysis During FFT analysis, a signal in the time domain is converted to a spectrum of frequencies. - Page 67 ® Trying out the instrument R&S Performing a basic FFT analysis 3. To measure the spectrum on the math channel, tap the "Measurement" icon on the toolbar. 4. Tap the spectrum waveform. The channel power is displayed below the FFT diagram. 5.
-
Page 68: Performing Mathematical Calculations
® Trying out the instrument R&S Performing mathematical calculations 7. To remove the FFT results, tap the "Delete" icon and then the spectrum wave- form. 8. Close the "Measurement" results. Performing mathematical calculations In addition to the measured waveforms, you can display calculated data to com- pare the current measurement result with. - Page 69 ® Trying out the instrument R&S Performing mathematical calculations 4. Tap the "Source1" icon and select Ch1. 5. Tap the "Operator" icon and select Rescale. 6. For "a", enter the vertical scaling factor, e.g. 4. 7. Under "b", enter the vertical position offset, e.g. 2. Look at the lower part of the dialog box and note that the instrument adjusts the "Vertical scale"...
-
Page 70: Performing A Search
® Trying out the instrument R&S Performing a search Performing a search In the following search, you detect positive and negative overshoots, i.e. values that exceed the high or low levels. To find these events, you can use the windows search. -
Page 71: Performing A Mask Test
® Trying out the instrument R&S Performing a mask test The acquisition stops, and the detected overshoots of the last acquisition are listed in the search result table. The search zoom window shows the last result that was found. Vertical lines indicate the time values for which a result was found. - Page 72 ® Trying out the instrument R&S Performing a mask test 3. Tap the corner points of the first mask segment on the touchscreen. Select the corner points of one complete pulse, with a minor offset to the inside. To finish the mask definition, double-tap the last point.
- Page 73 ® Trying out the instrument R&S Performing a mask test 7. Select the "Test Definition" tab. 8. Select channel 1 as the "Source". 9. Define the number of tolerable sample hits in the "Tolerance" field. A test has failed if the number of sample hits exceeds the limit of "Violation tolerance"...
-
Page 74: Printing And Saving Screenshots
® Trying out the instrument R&S Printing and saving screenshots 12. Press [RUN CONT] to start the next acquisition and watch the screen. 13. Close the "MaskTest" results box by tapping the red cross in the label. 6.11 Printing and saving screenshots You can print and save screenshots of the current display to document your results. - Page 75 ® Trying out the instrument R&S Printing and saving screenshots 4. Tap the upper left button and select the printer. 5. Tap "Print". The result is a monochrome image. 6. Close the dialog box. To configure the PRINT key 1. Open the "File" menu and tap "Frontpanel Setup". 2.
- Page 76 ® Trying out the instrument R&S Printing and saving screenshots 4. Close the dialog box. To save screenshots 1. Press the PRINT key. 2. Change the horizontal scale. 3. Press the PRINT key. The files are saved to the following directory: C:\Users\Public\Public Documents\Rohde-Schwarz\RTx\ ScreenShots The default file name is Screenshot_<date>_<index>_<time>.png.
-
Page 77: Saving Data
Saving data 6.12 Saving data After a measurement with the R&S RTE, you can save the resulting waveform data for further evaluation or comparison. You can also save measurement results, and device settings to repeat or restore previous measurements. ●... - Page 78 ® Trying out the instrument R&S Saving data Saving data of an acquisition series 1. Press the [FILE] key on the front panel. 2. Select "Waveform". 3. Set the export scope of the waveform: a) Check the "Source". b) Set "Scope" to "Full Waveform". c) Tap "Data logging"...
- Page 79 ® Trying out the instrument R&S Saving data 4. Select the results that you want to save. 5. For further usage of the results, select the "CSV-Delimiter" that is used to con- vert the values in columns. For MS Excel, select the semicolon. 6.
-
Page 80: Operating The Instrument
VNC server on the R&S RTE. Installation and configuration are described in the application note "Remote Monitoring and Control of the R&S RTE with a Web Browser", available on the Rohde & Schwarz internet site. Means of manual interaction The R&S RTE provides the following means of manual interaction, which you can... -
Page 81: Touchscreen Display
® Operating the instrument R&S Touchscreen display Using the touchscreen is the direct interaction way. Use your finger to place waveforms on the screen, mark areas for zoom and histograms, set parame- ters in dialog boxes, enter data, and much more. The control elements and actions on the screen are based on common concepts, and you will easily become familiar with the user interface. - Page 82 ® Operating the instrument R&S Touchscreen display Figure 7-1: Display information 1 = Diagram 2 = Grid 3 = Signal bar with horizontal and trigger label (3a), signal icon with waveform settings (3b) and signal icon with minimized live waveform (3c) 4 = Trigger level 5 = Trigger position 6 = Reference point (distance from trigger position to reference point = horizontal position)
- Page 83 ® Operating the instrument R&S Touchscreen display By default, the diagram name contains the diagram number and the short names of the waveforms shown inside. To change the diagram name, touch and hold the tab name. The on-screen keyboard opens to enter the new name. Names must be unique.
- Page 84 ® Operating the instrument R&S Touchscreen display Below, each waveform is represented by a signal icon. If the waveform is shown in a diagram, the signal icon displays its main vertical and acquisition settings. If you tap the "Minimize" icon on the signal icon, the waveform switches from the diagram area to the signal icon: the icon shows the real-time preview of the wave- form.
- Page 85 ® Operating the instrument R&S Touchscreen display Zoom diagram and zoom area (7, 8) Zoomed waveforms are shown in separate zoom diagrams, in addition to the waveform diagrams. On the original waveform diagram, a rectangle indicates the zoomed section of the waveform - this is the zoom area. You can modify the zoom area by dragging the rectangle as a whole, and by dragging its edges.
- Page 86 94. Signal bar (2) The signal bar shows all enables waveforms as described in "Signal bar (3)" on page 83. Menu bar (3) The menus provide access to the complete functionality of R&S RTE. Getting Started 1326.1026.02 ─ 10...
-
Page 87: App Cockpit
® Operating the instrument R&S App cockpit Result box (4) If you perform cursor or automatic measurements, mask testing, or a search, the result box shows the results of the action. The position of the result box is adjust- able. It can be docked (default for measurements), floating, minimized to a result icon on the signal bar, or displayed in a separate diagram on the screen. -
Page 88: Working With Waveforms
® Operating the instrument R&S Working with waveforms Working with waveforms The R&S RTE can create and display many waveform types. The most importand are: ● Channel waveforms: For each input channel, one channel waveform is shown. ● Reference waveforms: Four waveforms can be used as reference for comparison and analysis. - Page 89 Working with waveforms Waveform handling The R&S RTE can show and analyze many waveforms. To handle this multitude while keeping track of it, the R&S RTE provides intelligent support: ● The color system helps to distinguish the waveforms. The color of the vertical rotary knobs indicates the signal that is focused (selected).
- Page 90 ® Operating the instrument R&S Working with waveforms To switch a waveform on A channel waveform is activated as soon as you connect the probe. You can switch it on and off according to your needs. ► Choose one of the following ways: ●...
-
Page 91: Rohde & Schwarz Smartgrid
® Operating the instrument R&S Rohde & Schwarz smartgrid ● To switch off a minimized waveform, tap the "Close" icon in the upper right corner of the minimized signal view. ● Disable "Show channel" in the "Vertical" > "Channels" tab. ●... -
Page 92: Using The Signal Bar
® Operating the instrument R&S Using the signal bar The Rohde & Schwarz SmartGrid appears and a blue area shows where the waveform will be placed. 2. Drop the waveform in the target area. The waveform appears in an existing or in a new diagram, and it is selected for further actions. - Page 93 ® Operating the instrument R&S Using the signal bar To scroll the signal bar If the signal bar contains more than four icons, not all icons are visible on the dis- play. ► Touch one of the signal icons and move it up or down until the required icon appears.
-
Page 94: Toolbar
® Operating the instrument R&S Toolbar To change the colors If you want to highlight the signal bar, you can change the "Fill color" and "Border color" of the bar. 1. Press the [DISPLAY] key on the front panel. 2. In the "Display" dialog box, select the "Diagram Layout" tab. 3. - Page 95 ® Operating the instrument R&S Toolbar 7.7.1 Using the toolbar Using the toolbar is easy and straightforward. Some of the toolbar functions are one-click actions. These actions are performed immediately when you tap the icon. Other toolbar functions are analyzing functions. These actions are interactive actions.
- Page 96 ® Operating the instrument R&S Toolbar 1. On the "Display" menu, select "Toolbar". 2. Select the required toolbar functions: ● Disable the functions that you do not need. Enable the functions that you want to add to the toolbar. ● To display all available toolbar icons, tap "Show All". ●...
- Page 97 Label Find Trigger Level Update Ref Waveform Force Trigger Save Waveform Spectrogram (option R&S RTE-K18) You can configure the content of the toolbar and hide the date/time display, Chapter 7.7.2, "Configuring the toolbar", on page 95. The following list describes at first the default toolbar functions and then the addi- tional functions.
- Page 98 ® Operating the instrument R&S Toolbar Show Help Enables the tooltip display. A short description appears when you tap a parameter in a dialog or result box. To open the corresponding help topic, tap the "Show Help" button in the lower right corner of the tooltip. See also: Chapter 7.12, "Getting information and help",...
- Page 99 ® Operating the instrument R&S Toolbar Coupled zoom ← Zoom Creates a coupled zoom area and its related zoom diagram. If you change the size of one zoom area, the size of all coupled zoom areas is changed as well. First, create a zoom using the "Standard"...
- Page 100 ® Operating the instrument R&S Toolbar Histogram The histogram icon on the toolbar shows the last selected histo- gram type. A short tap on the icon activates the selected histogram. If you touch the icon and drag your finger down, a menu opens where you can select another histogram type: horizontal histogram, or vertical histogram.
- Page 101 ® Operating the instrument R&S Toolbar Tap the icon and then tap the area or diagram to be deleted, or the waveform to be switched off. Save Settings Saves the current instrument settings in a saveset. The filename is created according to the autonaming pattern.
-
Page 102: Displaying Results
Tap the icon and then tap the waveform to be exported. If you tap the display background, the selected waveform is exported, or a multichannel export is per- formed if configured. Spectrogram (option R&S RTE-K18) Starts an FFT and the spectrogram. The FFT trace and the spectrogram are shown in separate diagrams. - Page 103 ® Operating the instrument R&S Displaying results ● In a docked tab below the diagram (available only for automatic and cursor measurements) The default position and the font size can be adjusted. To arrange a result box on the display ►...
-
Page 104: Using Dialog Boxes
® Operating the instrument R&S Using dialog boxes To open the corresponding setup dialog box ► In the result box, tap the icon. Alternatively, double-tap the results. The dialog box with corresponding settings opens. To define the default position of measurement results For results of automatic and cursor measurements, the docked position below the diagram is the initial default position. - Page 105 ® Operating the instrument R&S Using dialog boxes vides an overview of the accessing methods and describes how to use the dialog boxes. Each dialog box has four icons in the upper right corner: Go back: opens the previously opened dialog box. Go forward: opens the next dialog box.
-
Page 106: Entering Data
® Operating the instrument R&S Entering data 3. To restore the complete dialog box, tap the "Maximize" icon in the small box. To close a dialog box ► Tap the "Close" icon in the upper right corner. Press the [ESC] key on the front panel. To select an option in a dialog box ►... - Page 107 ® Operating the instrument R&S Entering data Using scale, position and level knobs The instrument has dedicated rotary knobs to set vertical and horizontal positions and scale, and the trigger level. When you turn a knob, the input box appears in the upper left corner of the screen, showing the parameter name and current value.
- Page 108 ® Operating the instrument R&S Entering data 2. Enter the numeric value using the following methods: ● To use the default value, tap "Reset" (if available). ● To use the minimum or maximum value, tap "Min" or "Max", respectively. ● To increase the displayed value in fixed steps, tap "Inc". To decrease the value in fixed steps, tap "Dec".
-
Page 109: Messages
® Operating the instrument R&S Messages 2. Enter the text as you would on a normal keyboard. ● To enter a series of capital characters, tap "Caps". To enter one capital character, tap "Shift". ● To use the currently defined value, tap "Cur". This is the value that was used before the keyboard was displayed. -
Page 110: Getting Information And Help
● The general help explains a dialog box, provides instructions, and general information. ● Tutorials and videos demonstrate the general usage of the R&S RTE, for example, how to use the SmartGrid. They are available on the internet prod- uct page, in the R&S®RTE1000 - Media... - Page 111 ® Operating the instrument R&S Getting information and help 3. To open the corresponding help topic, tap the "Show Help" button in the lower right corner of the tooltip. The "Help" window opens and displays the comprehensive description and the corresponding remote command. You can browse the help for further information.
- Page 112 ® Operating the instrument R&S Getting information and help To search for a topic in the index The index is sorted alphabetically. You can browse the list, or search for entries in the list. 1. Switch to the "Index" tab. 2.
-
Page 113: Setting Up The Instrument
® Setting up the instrument R&S Performing a self-alignment Setting up the instrument Basic setup procedures for the instrument are the following: ● Performing a self-alignment................113 ● Setting the display language................. 114 ● Adjusting passive probes................114 Performing a self-alignment The self-alignment aligns the data from several input channels vertically and hori- zontally to synchronize the timebases, amplitudes and positions. -
Page 114: Setting The Display Language
® Setting up the instrument R&S Adjusting passive probes Setting the display language You can change the language in which the dialog boxes, result boxes and other screen information is displayed. A reboot of the instrument is not necessary. 1. Press the [SETUP] key. 2. - Page 115 ® Setting up the instrument R&S Adjusting passive probes Getting Started 1326.1026.02 ─ 10...
-
Page 116: Contacting Customer Support
® Contacting customer support R&S Contacting customer support Technical support – where and when you need it For quick, expert help with any Rohde & Schwarz product, contact our customer support center. A team of highly qualified engineers provides support and works with you to find a solution to your query on any aspect of the operation, program- ming or applications of Rohde &... -
Page 117: Index
® Index R&S Index AC coupling Data entry ..........106 Trying out ..........48 Data sheet ..........17 Acquisition Decimation ..........47 Single, multiple ........40 Delete ............ 100 Start ............ 40 Diagrams ..........82 Stop ............ 40 Dialog boxes ..........85 Trying out .......... - Page 118 Concepts ..........80 Connector ........... 32 Manual ..........80 Language Options Changing ...........114 R&S RTE-B1 (MSO) ......33 LEVELS knob .......... 39 R&S RTE-B1E (for R&S RT-ZVC) ..33 Lock touchscreen ........35 LOGIC key ..........42 Getting Started 1326.1026.02 ─ 10...
- Page 119 ® Index R&S R&S RTE-B6 (waveform and function Resolution Rotary knob ........36 generator) ........... 33 R&S RTE-B10 (GBIP) ......33 Result boxes ..........85 Background transparency ....35 Displaying ......... 102 Results Peak detect ..........47 Configuring display ......102 Position Rotary knobs Horizontal ..........36...
- Page 120 ® Index R&S Signal view ..........83 Trigger SLOPE Controls ..........39 Key ............39 External input ........29 Trying out ..........45 External output ........32 SmartGrid ..........91 Label ........... 83 SOURCE key .......... 39 Level ..........39, 84 Spectrogram .......... 102 Mode ..........
- Page 121 ® Index R&S Windows Access ..........25 XY-waveforms ......... 88 Zoom Area ............ 85 Diagram ..........85 Fingertip ..........55 Quick access ........98 Standard ..........54 Trying out ..........54 Waveforms .......... 88 ZOOM Key ............41 Distributed by: Sie haben Fragen oder wünschen eine Beratung? Angebotsanfrage unter +49 7121 / 51 50 50 oder über info@datatec.eu...
Need help?
Do you have a question about the RTE and is the answer not in the manual?
Questions and answers