Table of Contents
Advertisement
Quick Links
Advertisement
Table of Contents

Related Manuals for R&S RTO2000


Summary of Contents for R&S RTO2000
- Page 1 ® R&S RTO2000 Digital Oscilloscope Getting Started (=PïC2) 1332.9719.02 ─ 07...
- Page 2 Rohde & Schwarz GmbH & Co. KG. Trade names are trademarks of their owners. ® Throughout this manual, products from Rohde & Schwarz are indicated without the symbol , e.g. ® R&S RTO2000 is indicated as R&S RTO.
- Page 3 Basic Safety Instructions Always read through and comply with the following safety instructions! All plants and locations of the Rohde & Schwarz group of companies make every effort to keep the safety standards of our products up to date and to offer our customers the highest possible degree of safety. Our products and the auxiliary equipment they require are designed, built and tested in accordance with the safety standards that apply in each case.
- Page 4 Basic Safety Instructions Symbol Meaning Symbol Meaning Caution ! Hot surface Alternating current (AC) Protective conductor terminal Direct/alternating current (DC/AC) To identify any terminal which is intended for connection to an external conductor for protection against electric shock in case of a fault, or the terminal of a protective earth Earth (Ground) Class II Equipment...
- Page 5 Basic Safety Instructions Operating states and operating positions The product may be operated only under the operating conditions and in the positions specified by the manufacturer, without the product's ventilation being obstructed. If the manufacturer's specifications are not observed, this can result in electric shock, fire and/or serious personal injury or death. Applicable local or national safety regulations and rules for the prevention of accidents must be observed in all work performed.
- Page 6 Basic Safety Instructions 6. The product may be operated only from TN/TT supply networks fuse-protected with max. 16 A (higher fuse only after consulting with the Rohde & Schwarz group of companies). 7. Do not insert the plug into sockets that are dusty or dirty. Insert the plug firmly and all the way into the socket provided for this purpose.
- Page 7 Basic Safety Instructions 2. Before you move or transport the product, read and observe the section titled "Transport". 3. As with all industrially manufactured goods, the use of substances that induce an allergic reaction (allergens) such as nickel cannot be generally excluded. If you develop an allergic reaction (such as a skin rash, frequent sneezing, red eyes or respiratory difficulties) when using a Rohde &...
- Page 8 Basic Safety Instructions 2. Adjustments, replacement of parts, maintenance and repair may be performed only by electrical experts authorized by Rohde & Schwarz. Only original parts may be used for replacing parts relevant to safety (e.g. power switches, power transformers, fuses). A safety test must always be performed after parts relevant to safety have been replaced (visual inspection, protective conductor test, insulation resistance measurement, leakage current measurement, functional test).
- Page 9 Instrucciones de seguridad elementales 3. If you use the product in a vehicle, it is the sole responsibility of the driver to drive the vehicle safely and properly. The manufacturer assumes no responsibility for accidents or collisions. Never use the product in a moving vehicle if doing so could distract the driver of the vehicle.
- Page 10 Customer Support Technical support – where and when you need it For quick, expert help with any Rohde & Schwarz equipment, contact one of our Customer Support Centers. A team of highly qualified engineers provides telephone support and will work with you to find a solution to your query on any aspect of the operation, programming or applications of Rohde &...
-
Page 11: Table Of Contents
® Contents R&S RTO2000 Contents 1 Preface..................7 1.1 Key Features..................7 1.2 Documentation Overview..............8 1.2.1 Manuals and Instrument Help..............8 1.2.2 Data Sheet and Brochure............... 9 1.2.3 Release Notes, Open Source Acknowledgment........9 1.2.4 Calibration Certificate................10 1.2.5 Application notes, Application cards, Videos........10 1.3 Conventions Used in the Documentation.........10... - Page 12 ® Contents R&S RTO2000 3 Instrument Tour..............23 3.1 Front Panel..................23 3.1.1 Input Connectors...................24 3.1.2 Other Front Panel Connectors.............. 25 3.2 Rear Panel................... 26 3.3 Keys and Controls................29 3.3.1 Setup Controls..................29 3.3.2 Horizontal Controls................31 3.3.3 Vertical Controls..................32 3.3.4 Trigger Controls..................
- Page 13 ® Contents R&S RTO2000 4.8 Performing a Basic FFT Analysis............66 4.9 Performing Mathematical Calculations..........69 4.10 Performing a Search................70 4.11 Performing a Mask Test..............72 4.12 Printing and Saving Screenshots............75 4.13 Saving Data..................78 5 Operating the Instrument............81 5.1 Means of Manual Interaction..............81 5.2 Touchscreen Display................82...
-
Page 14: Getting Started 1332.9719.02 ─ 07
® Contents R&S RTO2000 6.2 Aligning the Touchscreen..............114 6.3 Setting the Display Language............114 6.4 Adjusting Passive Probes..............115 Index................... 117 Getting Started 1332.9719.02 ─ 07... -
Page 15: Preface
® Preface R&S RTO2000 Key Features Preface Key Features The R&S RTO Digital Oscilloscopebrings various benefits in your daily work. Out- standing key features are: Best oscilloscope performance ● Up to 16-bit vertical resolution ● Trigger on any detail you can see ●... -
Page 16: Documentation Overview
® Preface R&S RTO2000 Documentation Overview Documentation Overview This section provides an overview of the R&S RTO user documentation. 1.2.1 Manuals and Instrument Help You find the manuals on the product page at: www.rohde-schwarz.com/manual/rto Getting started manual Introduces the R&S RTO and describes how to set up and start working with the instrument, and describes basic operations. -
Page 17: Data Sheet And Brochure
® Preface R&S RTO2000 Documentation Overview ● Test fixture manuals are available for: – R&S RT-ZF1 USB 2.0 Compliance Test Fixture Set – R&S RT-ZF2 Ethernet Compliance Test Fixture Set – R&S RT-ZF3 Frequency Converter Board (100BASE-T1) – R&S RT-ZF4 10BASE-Te Test Fixture –... -
Page 18: Calibration Certificate
® Preface R&S RTO2000 Conventions Used in the Documentation See www.rohde-schwarz.com/firmware/rto. 1.2.4 Calibration Certificate The document is available on https://gloris.rohde-schwarz.com/calcert. You need the device ID of your instrument, which you can find on a label on the rear panel. 1.2.5... -
Page 19: Conventions For Procedure Descriptions
® Preface R&S RTO2000 Conventions Used in the Documentation 1.3.2 Conventions for Procedure Descriptions When operating the instrument, several alternative methods may be available to perform the same task. In this case, the procedure using the touchscreen is described. Any elements that can be activated by touching can also be clicked using an additionally connected mouse. - Page 20 ® Preface R&S RTO2000 Conventions Used in the Documentation Getting Started 1332.9719.02 ─ 07...
-
Page 21: Preparing For Use
® Preparing for Use R&S RTO2000 Unpacking and Checking the Instrument Preparing for Use This section describes the basic steps to be taken when setting up the R&S RTO for the first time. Risk of instrument damage due to inappropriate operating conditions Specific operating conditions are required to ensure accurate measure- ments and to avoid damage to the instrument. -
Page 22: Positioning The Instrument
® Preparing for Use R&S RTO2000 Positioning the Instrument Packing material Retain the original packing material. If the instrument needs to be transpor- ted or shipped later, you can use the material to protect the control ele- ments and connectors. -
Page 23: Rackmounting
® Preparing for Use R&S RTO2000 Positioning the Instrument Risk of injury when stacking instruments A stack of instruments can tilt over and cause injury if not stacked correctly. Furthermore, the instruments at the bottom of the stack can be damaged due to the load imposed by the instruments on top. -
Page 24: Starting The Instrument
® Preparing for Use R&S RTO2000 Starting the Instrument Risk of instrument damage due to insufficient airflow in a rack If the instrument is run with insufficient airflow for a longer period, the instru- ment overheats, which can disturb the operation and even cause damage. -
Page 25: Powering On
® Preparing for Use R&S RTO2000 Starting the Instrument Risk of instrument damage due to inappropriate operating conditions An unsuitable operating site or test setup can damage the instrument and connected devices. Before switching on the instrument, observe the infor- mation on appropriate operating conditions provided in the data sheet. -
Page 26: Starting Up And Shutting Down
® Preparing for Use R&S RTO2000 Starting the Instrument 1. Connect the power cable to the AC power connector on the rear panel of the R&S RTO. 2. Connect the power cable to the socket outlet. 3. Switch the main power switch at the rear of the instrument to position I. -
Page 27: Powering Off
® Preparing for Use R&S RTO2000 Connecting External Devices 2.3.3 Powering Off Powering off is only required if the instrument must be disconnected from all power supplies. It also interrupts the power supply of the OCXO (option OCXO Reference Fre- quency, R&S RTO-B4). -
Page 28: Connecting Usb Devices
® Preparing for Use R&S RTO2000 Connecting External Devices ● Monitor connectors DVI-D and DisplayPort at the rear panel of the instrument ● Connecting USB Devices................20 ● Connecting an External Monitor..............21 2.4.1 Connecting USB Devices The USB interfaces on the front and rear panels allow you to connect USB devi- ces directly to the instrument. -
Page 29: Connecting An External Monitor
® Preparing for Use R&S RTO2000 Connecting External Devices Connecting a USB flash drive or CD-ROM drive If installation of a USB flash drive or CD-ROM drive is successful, Windows informs you that the device is ready to use. The device is made available as a new drive ("D:") and is displayed under Windows Explorer. - Page 30 ® Preparing for Use R&S RTO2000 Connecting External Devices 1. Check the input type of the monitor or projector. Make sure to select the cor- rect cable. To use a VGA monitor, you need an active DVI-D to VGA adapter.
-
Page 31: Instrument Tour
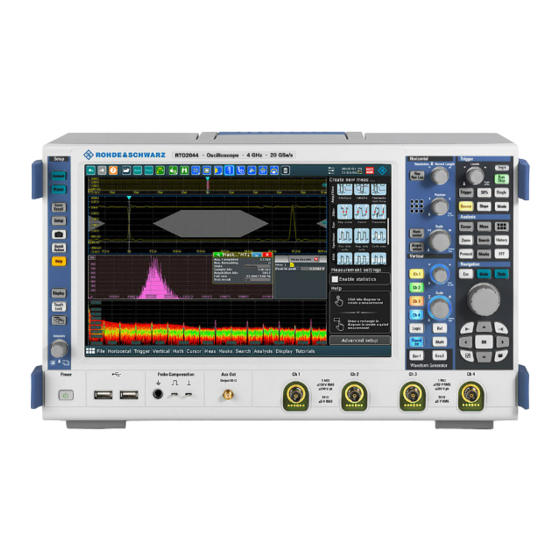
® Instrument Tour R&S RTO2000 Front Panel Instrument Tour This chapter describes the front and rear panels of the instrument including all function keys and connectors, and also the touchscreen with its control elements. Front Panel The front panel of the R&S RTO is shown in Figure 3-1. -
Page 32: Input Connectors
® Instrument Tour R&S RTO2000 Front Panel 5 = ANALYSIS keys 6 = NAVIGATION controls 7 = WAVEFORM GENERATOR keys 8 = VERTICAL controls 9 = Input channels 10 = AUX OUT connector 11 = Connectors for probe compensation and grounding... -
Page 33: Other Front Panel Connectors
® Instrument Tour R&S RTO2000 Front Panel Risk of injury and instrument damage The instrument is not rated for any measurement category. Make sure that the input voltage on channel inputs does not exceed 200 V peak, 150 V RMS at 1 MΩ input impedance and 5 V RMS at 50 Ω... -
Page 34: Rear Panel
® Instrument Tour R&S RTO2000 Rear Panel Ground connector for probes. AUX OUT Output of the internal calibration signal, if the signal is configured to external des- tination. Rear Panel Figure 3-2 shows the rear panel of the R&S RTO. - Page 35 ® Instrument Tour R&S RTO2000 Rear Panel 11 = Optional OCXO with input and output of the reference signal (option R&S RTO-B4) 12 = Kensington lock slot to secure the instrument against theft 13 = Optional exchangeable hard disk: solid state disk (option R&S RTO-B18) or standard hard disk drive (option R&S RTO-B19)
- Page 36 ® Instrument Tour R&S RTO2000 Rear Panel See also: Chapter 2.4.2, "Connecting an External Monitor", on page 21. EXT TRIGGER IN The BNC connector for external trigger input is used to control the measurement by an external signal. The input impedance can be selected in the trigger configu- ration, the values are 50 Ω...
-
Page 37: Keys And Controls
® Instrument Tour R&S RTO2000 Keys and Controls The output frequency of the OCXO is 10 MHz, the impedance is 50 Ω. For detailed specifications, refer to the data sheet. RTO-B6 Optional connectors for the waveform generator (option R&S RTO-B6). For detailed specifications, refer to the data sheet. - Page 38 ® Instrument Tour R&S RTO2000 Keys and Controls ● Save waveform data and measurement results ● Define a naming pattern for autonaming of files SETUP Opens and closes the "Setup" dialog box, where you can: ● Access Windows configuration and install firmware updates ●...
-
Page 39: Horizontal Controls
® Instrument Tour R&S RTO2000 Keys and Controls 3.3.2 Horizontal Controls The keys and rotary knobs in theHORIZONTAL functional block adjust the acqui- sition basic settings and the horizontal parameters. These settings are effective for all channel waveforms. RES REC LEN Opens and closes the "Setup"... -
Page 40: Vertical Controls
® Instrument Tour R&S RTO2000 Keys and Controls For record length, turn clockwise to increase the record length, and the resolution increases too - the time between to acquisition points gets shorter. POSITION The rotary knob changes the horizontal position of the waveform or the position of the reference point on the screen. - Page 41 ® Instrument Tour R&S RTO2000 Keys and Controls CH <N> Turns on, selects, and configures a channel. If the channel is selected, the key lights up in the corresponding channel color . The effect of the keypress depends on state of the channel: ●...
-
Page 42: Trigger Controls
® Instrument Tour R&S RTO2000 Keys and Controls MATH Opens the "Math" dialog box, where you can configure the calculation of new waveforms using various mathematic operations on other waveforms. Press the key repeatedly to switch to the math waveform to be configured. - Page 43 ® Instrument Tour R&S RTO2000 Keys and Controls TRIGGER Opens and closes the "Trigger" dialog box, where you can: ● Select a trigger type and configure it. ● Set general trigger parameters and control the acquisition run. ● Qualify the trigger event with logic patterns.
-
Page 44: Analysis Keys
® Instrument Tour R&S RTO2000 Keys and Controls SINGLE Starts a defined number of acquisition cycles. A green light indicates running acquisition. A red light shows that acquisition is stopped. To set the number of acquisitions, press the TRIGGER key, select the "Ctrl/Action" tab, and set "Aver- age count (N-single count)". - Page 45 ® Instrument Tour R&S RTO2000 Keys and Controls If you press the MEAS key while a measurement is enabled, the "Measurements" dialog box is displayed, where you can: ● Configure amplitude and time measurements, eye, spectrum, and histogram measurements ● Configure gated measurement ●...
-
Page 46: Navigation Controls
® Instrument Tour R&S RTO2000 Keys and Controls HISTORY The sample memory contains a number of stored acquisitions before the current one which is shown in the display. Press the key to open the quick access "His- tory" dialog box, where you can view the stored acquisitions and use them for fur- ther analysis. - Page 47 ® Instrument Tour R&S RTO2000 Keys and Controls ● In tables: press to activate the edit mode, turn clockwise to increase the value or turn counterclockwise to decrease it, and press to enter the value and move to the next cell.
-
Page 48: Power Key
® Instrument Tour R&S RTO2000 Keys and Controls ● In a dialog box that has only horizontal tabs, the key switches the horizontal tabs. ● In a dialog box that has horizontal and vertical tabs, the key switches the verti- cal tabs preferably. -
Page 49: Trying Out The Instrument
® Trying Out the Instrument R&S RTO2000 Displaying a Basic Signal Trying Out the Instrument This chapter introduces the most important functions and settings of the R&S RTO step by step. The complete description of the functionality and its usage is given in the "User Manual". Basic instrument operation is described in Chapter 5, "Operating the... - Page 50 ® Trying Out the Instrument R&S RTO2000 Displaying a Basic Signal 2. Connect the probe to the input connector CH 1. Connect the probe's ground connector to the right compensation pin , and the tip to the left pin The instrument recognizes the probe, and a signal is displayed in the diagram.
-
Page 51: Acquiring Data
® Trying Out the Instrument R&S RTO2000 Acquiring Data 8. Tap the "Undo" icon on the toolbar repeatedly until the trigger mode is "Auto" and the trigger source is "CH1". 9. Press the SLOPE key to toggle the trigger slope. - Page 52 ® Trying Out the Instrument R&S RTO2000 Acquiring Data 4. For Wfm2, select the "Wfm Arithmetic" Envelope. The "Decimation" type is automatically set to Peak detect to display the correct envelope waveform. 5. For Wfm3, select the "Decimation" type High Res and the "Wfm Arithmetic"...
-
Page 53: Organizing The Display
® Trying Out the Instrument R&S RTO2000 Organizing the Display Organizing the Display Now, the display has become confusing with so many waveforms in one diagram. You can display each waveform in a separate diagram and then define a useful label for each diagram. - Page 54 ® Trying Out the Instrument R&S RTO2000 Organizing the Display 2. Drag the signal icon for "Ch1Wfm3" to the bottom half of the diagram so that it covers an area beneath "Ch1Wfm2" and drop it there. The three waveforms are now displayed in separate diagrams.
- Page 55 ® Trying Out the Instrument R&S RTO2000 Organizing the Display d) Repeat these steps to rename "Diagram 2: Ch1Wfm2" to Envelope. e) Rename "Diagram 3: Ch1Wfm3" to Average. The diagram titles are shown together with the waveform number that is dis- played in the diagram.
-
Page 56: Changing The Waveform Scaling And Position
® Trying Out the Instrument R&S RTO2000 Changing the Waveform Scaling and Position 3. Switch off the "Average:Ch1Wfm3" waveform using the toolbar function: a) Tap the "Delete" icon on the toolbar. b) Tap the waveform in the "Average: Ch1Wfm3" diagram. - Page 57 ® Trying Out the Instrument R&S RTO2000 Changing the Waveform Scaling and Position If you use a passive probe, you can filter the DC component by using the AC cou- pling function. Then you quickly the new trigger level, and try out the scaling func- tions.
- Page 58 ® Trying Out the Instrument R&S RTO2000 Changing the Waveform Scaling and Position 4. To move the waveform back to the center of the screen, eliminate the offset in the vertical settings: Press the upper rotary knob in the VERTICAL area (Off- set/Position knob).
- Page 59 ® Trying Out the Instrument R&S RTO2000 Changing the Waveform Scaling and Position large step size of the scaling factor by tapping the step icon, or by pressing the horizontal Scale. 7. To return to the original scaling, try the UNDO key in the NAVIGATION area.
-
Page 60: Zooming Into The Display
® Trying Out the Instrument R&S RTO2000 Zooming into the Display Zooming into the Display Using the SCALE rotary knobs, you can change the scaling of the time base and signal amplitudes in order to enlarge the waveform. To see more details, use one of the zoom functions. - Page 61 ® Trying Out the Instrument R&S RTO2000 Zooming into the Display The indicated area is magnified in a new zoom diagram. The original diagram indicates the zoom area as a rectangle. 4. To remove the zoom window and make room on the display for other results, tap "Delete"...
-
Page 62: Using The Fingertip Zoom
® Trying Out the Instrument R&S RTO2000 Zooming into the Display 4.5.2 Using the Fingertip Zoom 1. Tap the "Zoom" icon on the toolbar. 2. In the sidebar, tap "Fingertip zoom". 3. Touch the waveform and move your finger very slowly in horizontal direction. -
Page 63: Displaying The Waveform History
® Trying Out the Instrument R&S RTO2000 Displaying the Waveform History Displaying the Waveform History During a continuous acquisition, the instrument stores the acquired data in the memory and shows the current acquisition on the display. When the acquisition was stopped and a new acquisition is started with RUN STOP or SINGLE, the memory is cleared and written anew. -
Page 64: Performing Basic Measurements
® Trying Out the Instrument R&S RTO2000 Performing Basic Measurements 10. In the "Replay time per acq." field, enter 1 s to display each waveform for one second. 11. Enable the "Auto repeat" option to see the three waveforms repeatedly. -
Page 65: Performing An Amplitude Measurement
® Trying Out the Instrument R&S RTO2000 Performing Basic Measurements The cursor lines appear in the diagram and the "Cursor Results" box opens. The measured waveform values at the cursor positions are displayed. 4. You can move the cursor lines in different ways: ●... - Page 66 ® Trying Out the Instrument R&S RTO2000 Performing Basic Measurements 1. To restore the default signal channel settings, press the PRESET and AUTOSET keys. 2. Tap the "Measurement" icon on the toolbar. 3. In the sidebar, select the measurement types, for example, "High", "Low", and "Amplitude".
- Page 67 ® Trying Out the Instrument R&S RTO2000 Performing Basic Measurements 7. Tap "Additional Measurements". 8. Select the required measurement types. For example, select also "Min" and "Max" to display the minimum and maximum values. 9. Tap "OK". Close the dialog box.
- Page 68 ® Trying Out the Instrument R&S RTO2000 Performing Basic Measurements 10. To save space in the display, tap "Minimize" in the result box. Now you see the first results in the result icon. 11. To view all measurement results without covering part of the waveform dis- play, move the result table to its own diagram area: a) Drag the result icon to the diagram area.
-
Page 69: Performing And Configuring The Quick Measurement
® Trying Out the Instrument R&S RTO2000 Performing Basic Measurements 13. Close the result icon. 4.7.3 Performing and Configuring the Quick Measurement A set of maximum eight different measurements on one source can be performed at once, simply by tapping the "Quick measurement" toolbar icon. You can config- ure the measurement types to be included in quick measurement. - Page 70 ® Trying Out the Instrument R&S RTO2000 Performing Basic Measurements In the following examples, you start a quick measurement and change the mea- surement configuration. To start the quick measurement 1. Press AUTOSET. 2. Tap the "Quick measurement" icon on the toolbar.
-
Page 71: Displaying A Histogram
® Trying Out the Instrument R&S RTO2000 Performing Basic Measurements Now the result box also shows the result of the frequency measurements. 6. Tap "Set as QuickMeas". The current configuration is set as default quick measurement and can be repeated until you save another configuration. - Page 72 ® Trying Out the Instrument R&S RTO2000 Performing Basic Measurements The usage of histograms is also shown in a short video that is available on the instrument: "Tutorials > Getting Started > Histogram". 1. Tap the "Histogram" icon on the toolbar.
- Page 73 ® Trying Out the Instrument R&S RTO2000 Performing Basic Measurements 7. Select the required histogram measurement types. 8. Tap "OK". Close the dialog box. The histogram measurement results are displayed in the result box. Getting Started 1332.9719.02 ─ 07...
-
Page 74: Performing A Basic Fft Analysis
® Trying Out the Instrument R&S RTO2000 Performing a Basic FFT Analysis 9. To remove the histogram, tap the "Delete" icon on the toolbar, and then tap the histogram. The histogram and any measurements based on that histogram are deactiva- ted. - Page 75 ® Trying Out the Instrument R&S RTO2000 Performing a Basic FFT Analysis 3. To measure the spectrum on the math channel, tap the "Measurement" icon on the toolbar. 4. Tap the spectrum waveform. The spectrum measurement results are displayed in a result box.
- Page 76 ® Trying Out the Instrument R&S RTO2000 Performing a Basic FFT Analysis 7. If the spectrum analysis option R&S RTO-K18 is installed on your instrument, double-tap the spectrum waveform again. 8. Enable the spectrogram. Close the dialog box. 9. To remove the FFT results, tap the "Delete" icon and then the spectrum wave- form.
-
Page 77: Performing Mathematical Calculations
® Trying Out the Instrument R&S RTO2000 Performing Mathematical Calculations 10. Close the "Measurement" result box. Performing Mathematical Calculations In addition to the measured waveforms, you can display calculated data to com- pare the current measurement result with. For example, you can display the absolute value if the waveform values as a math waveform. -
Page 78: Performing A Search
® Trying Out the Instrument R&S RTO2000 Performing a Search 8. Press the DISPLAY key. 9. Disable "Use color table" in the lower area of the dialog box. 10. Close the dialog box. Now the math waveform has blue color. - Page 79 ® Trying Out the Instrument R&S RTO2000 Performing a Search 1. Press the SEARCH key on the front panel (ANALYSIS area). 2. Select "C1" as "Source". 3. Select the search criteria: Enable "Window". 4. In the "Window" tab below, define the search conditions: a) In the "Upper level"...
-
Page 80: Performing A Mask Test
® Trying Out the Instrument R&S RTO2000 Performing a Mask Test 8. In the results table, tap the row of the search result that you want to display in the search zoom diagram. 4.11 Performing a Mask Test In the following example, you perform a mask test to determine whether the sig- nal exceeds a rectangular area. - Page 81 ® Trying Out the Instrument R&S RTO2000 Performing a Mask Test 4. Tap "Finish segment" in the sidebar. 5. Add another mask segment above the positive pulse: a) Tap "Add segment" in the sidebar. b) Tap two points slightly above the pulse.
- Page 82 ® Trying Out the Instrument R&S RTO2000 Performing a Mask Test f) In the "Region" column of the second mask segment, select "Upper". 6. Select the "Test Definition" tab. 7. Select channel 1 as the "Source". 8. Define the number of tolerable sample hits in the "Violation tolerance" field.
-
Page 83: Printing And Saving Screenshots
® Trying Out the Instrument R&S RTO2000 Printing and Saving Screenshots 11. Press RUN STOP to start the next acquisition and watch the screen. 12. To close the test, tap in the "MaskTest" results box. 4.12 Printing and Saving Screenshots You can print and save screenshots of the current display to document your results. - Page 84 ® Trying Out the Instrument R&S RTO2000 Printing and Saving Screenshots 4. Tap the upper left button and select the printer. 5. Tap "Print". The result is a monochrome image. 6. Close the dialog box. To configure the Camera key 1.
- Page 85 ® Trying Out the Instrument R&S RTO2000 Printing and Saving Screenshots 4. Close the dialog box. To save screenshots 1. Press the key. 2. Change the horizontal scale. 3. Press the key. The files are saved to the following directory:...
-
Page 86: Saving Data
® Trying Out the Instrument R&S RTO2000 Saving Data 4.13 Saving Data After a measurement with the R&S RTO, you can save the resulting waveform data for further evaluation or comparison. You can also save measurement results, and device settings in order to repeat or restore previous measurements. - Page 87 ® Trying Out the Instrument R&S RTO2000 Saving Data The waveform data is saved to the files Waveform1.Wfm.bin and Waveform1.bin in the selected directory. Saving data of an acquisition series 1. Press the SAVE RECALL key on the front panel.
- Page 88 ® Trying Out the Instrument R&S RTO2000 Saving Data Saving measurement results 1. Perform a measurement as described in Chapter 4.7.2, "Performing an Ampli- tude Measurement", on page 57. 2. Tap in the result box. 3. Tap "Result Export" in the "Setup" tab.
-
Page 89: Operating The Instrument
® Operating the Instrument R&S RTO2000 Means of Manual Interaction Operating the Instrument There are three ways to operate the R&S RTO. Manual operation Use the touchscreen, keys and rotary knobs, or an optional mouse and/or key- board. The principles of manual operation are explained in this section. -
Page 90: Touchscreen Display
® Operating the Instrument R&S RTO2000 Touchscreen Display Using the touchscreen is the most direct interaction way. Use your finger to place waveforms on the screen, mark areas for zoom and histograms, set parameters in dialog boxes, enter data, and much more. Most of the control elements and actions on the screen are based on common concepts, and you will easily become familiar with the user interface. - Page 91 ® Operating the Instrument R&S RTO2000 Touchscreen Display Figure 5-1: Display information 1 = Diagram 2 = Grid 3 = Signal bar with horizontal and trigger label (3a), signal icon with signal label (3b) and signal icon with minimized live waveform (3c)
- Page 92 ® Operating the Instrument R&S RTO2000 Touchscreen Display To arrange the diagrams on the screen, the Rohde & Schwarz SmartGrid function helps you to find the target place simply and quickly. A tabbed view is also possi- ble, and you can adjust the diagram size.
- Page 93 ® Operating the Instrument R&S RTO2000 Touchscreen Display Figure 5-1, the signal icons Ch1Wfm1 and Ch2Wfm1 show the signal label, and the waveforms are displayed in diagrams. All other waveforms are minimized and shown in the signal view. Figure 5-3: Signal label on the signal bar...
-
Page 94: Control Elements On The Touchscreen
® Operating the Instrument R&S RTO2000 Touchscreen Display Zoom diagram and zoom area (7, 8) Zoomed waveforms are shown in separate zoom diagrams, in addition to the waveform diagrams. On the original waveform diagram, a rectangle indicates the zoomed section of the waveform - this is the zoom area. You can modify the zoom area by dragging the rectangle as a whole, and by dragging its edges. - Page 95 ® Operating the Instrument R&S RTO2000 Touchscreen Display Figure 5-4: Control elements on the touchscreen 1 = Toolbar 2 = Signal bar, see "Signal bar (3)" on page 84 3 = Menu bar 4 = Dialog box 5 = Tab in a dialog box...
-
Page 96: App Cockpit
® Operating the Instrument R&S RTO2000 App Cockpit Result box (6) If you perform manual or automatic measurements, mask testing, or a search, the result box shows the results of the action. Similar to waveform diagrams, you can minimize the result box to a result icon on the signal bar, and display results in a separate diagram on the screen. -
Page 97: Working With Waveforms
® Operating the Instrument R&S RTO2000 Working with Waveforms Working with Waveforms The R&S RTO can create and display several types of waveforms: ● Channel waveforms: Up to three waveforms per input channel can be shown. For a four-channel instrument, 12 channel waveforms are available. - Page 98 ® Operating the Instrument R&S RTO2000 Working with Waveforms Waveform handling The R&S RTO can show and analyze many waveforms. To handle this multitude while keeping track of it, the R&S RTO provides intelligent support: ● The color system helps to distinguish the waveforms. The color of the vertical rotary knobs indicates the signal that is focused (selected).
- Page 99 ® Operating the Instrument R&S RTO2000 Working with Waveforms To switch a waveform on A channel waveform is activated as soon as you connect the probe. You can switch it on and off according to your needs. ► Choose one of the following ways: ●...
- Page 100 ® Operating the Instrument R&S RTO2000 Working with Waveforms The Rohde & Schwarz SmartGrid appears and a blue area shows where the waveform will be placed. 2. Drop the waveform in the target area. The waveform appears in an existing or in a new diagram, and it is selected for further actions.
-
Page 101: Toolbar
® Operating the Instrument R&S RTO2000 Toolbar The diagram layout depends on the position where you drop the signal view, in relation to an existing diagram. Figure 5-5: SmartGrid positions 1 = In the existing diagram, overlay of signal 2 = New diagram on the left or right... -
Page 102: Using The Toolbar
® Operating the Instrument R&S RTO2000 Toolbar By default, the toolbar shows the most frequently used functions. You can config- ure the content of the toolbar and hide the date/time display, see Chapter 5.5.2, "Configuring the Toolbar", on page 95. -
Page 103: Configuring The Toolbar
® Operating the Instrument R&S RTO2000 Toolbar ● Tap the required diagram. ● Drag a rectangle on the diagram. The toolbar handling is also shown in a short video that is available on the instru- ment: "Tutorials > Getting Started > Toolbar". -
Page 104: Toolbar Functions
® Operating the Instrument R&S RTO2000 Toolbar A detailed description of the toolbar functions is given in Chapter 5.5.3, "Toolbar Functions", on page 96. 5.5.3 Toolbar Functions This chapter describes all toolbar functions in detail. One-click actions Interactive actions Undo... - Page 105 ® Operating the Instrument R&S RTO2000 Toolbar One-click actions Interactive actions Create Report Clear Screen Delete Autoset and Preset Label Run / Stop and Run Single Update Ref Waveform Save Waveform Spectrogram (option R&S RTO-K18) Zone trigger (option R&S RTO-K19) You can configure the content of the toolbar and hide the date/time display, Chapter 5.5.2, "Configuring the...
- Page 106 ® Operating the Instrument R&S RTO2000 Toolbar Find Trigger Level Analyses the signal and sets the trigger level to the middle of the signal peaks. Zoom The zoom icon on the toolbar shows the last selected zoom type. A short tap on the icon activates the selected zoom.
- Page 107 ® Operating the Instrument R&S RTO2000 Toolbar Search Performs a search. Tap the icon and adjust the settings in the sidebar. Tap the diagram with the waveform to be searched, or drag a rectangle to define a search gate. The search is performed on the selected waveform.
- Page 108 ® Operating the Instrument R&S RTO2000 Toolbar Tap the icon and select the measurement type in the sidebar. Tap the diagram with the waveform to be measured. To define a measurement gate, draw a rect- angle on the screen. To configure the measurement or select a different measurement type, tap the icon in the "Measurement"...
- Page 109 ® Operating the Instrument R&S RTO2000 Toolbar Clear Screen Deletes all measurement results including long term measurement and statistic results. Also deletes the current measurement and channel waveforms. Autoset and Preset Performs an autoset, or a preset to a default state. The icons have the same functionality as the corresponding keys on the front panel.
-
Page 110: Displaying Results
® Operating the Instrument R&S RTO2000 Displaying Results Tap the icon and adjust the settings in the sidebar. Tap diagram with the wave- form to be transformed. The diagrams are created from the selected waveform. Zone trigger (option R&S RTO-K19) Defines a zone trigger, which combines the trigger condition with the inter- section or non-intersection of one or more zones or masks. - Page 111 ® Operating the Instrument R&S RTO2000 Displaying Results 1 = Floating result box 2 = Table in a tab on the left or right 3 = Table in a tab above or below 4 = New tab To open the corresponding setup dialog box ►...
-
Page 112: Using Dialog Boxes
® Operating the Instrument R&S RTO2000 Using Dialog Boxes 2. Select the "Screen" tab. 3. Set the "Result dialog font size". Using Dialog Boxes All functionality is provided in dialog boxes as known from computer programs. You can control the instrument intuitively with the touchscreen. This section pro- vides an overview of the accessing methods and describes how to use the dialog boxes. - Page 113 ® Operating the Instrument R&S RTO2000 Using Dialog Boxes To minimize a dialog box If you want to change only one setting during analysis, and you need to change it often, you can display a small box that only contains the required setting.
-
Page 114: Entering Data
® Operating the Instrument R&S RTO2000 Entering Data Entering Data Most important parameters have their own rotary knobs on the front panel. When you turn a knob, the input box appears the lower right corner of the screen, show- ing the parameter name and current value. - Page 115 ® Operating the Instrument R&S RTO2000 Entering Data 2. Enter the numeric value using the following methods: ● To use the default value, tap "Reset" (if available). ● To use the minimum or maximum value, tap "Min" or "Max", respectively.
-
Page 116: Messages
® Operating the Instrument R&S RTO2000 Messages 2. Enter the text as you would on a normal keyboard. ● To enter a series of capital characters, tap "Caps". To enter one capital character, tap "Shift". ● To use the currently defined value, tap "Cur". This is the value that was used before the keyboard was displayed. -
Page 117: Getting Information And Help
® Operating the Instrument R&S RTO2000 Getting Information and Help ► To open and close the message box, tap the "Info" button. If no messages are available, the "Info" button is hidden. Important messages are indicated by a red "Info" button. These messages cannot be deleted, they remain until the problem is solved. -
Page 118: 5.10.2 Displaying Help
® Operating the Instrument R&S RTO2000 Getting Information and Help 5.10.2 Displaying Help To display tooltips and context help 1. Enable the "Tooltip" icon on the toolbar. 2. Tap the parameter for which you need information. The tooltip opens. 3. To open the corresponding help topic, tap the "Show Help" button in the lower right corner of the tooltip. - Page 119 ® Operating the Instrument R&S RTO2000 Getting Information and Help ● To browse the topics visited before: Left arrow = back, Right arrow = forward ● To increase or decrease the font To navigate the Help, use the touchscreen. Alternatively, you can also use the navigation keys on the front panel.
- Page 120 ® Operating the Instrument R&S RTO2000 Getting Information and Help Getting Started 1332.9719.02 ─ 07...
-
Page 121: Setting Up The Instrument
® Setting Up the Instrument R&S RTO2000 Performing a Self-alignment Setting Up the Instrument Basic setup procedures for the instrument are the following: ● Performing a Self-alignment................113 ● Aligning the Touchscreen................114 ● Setting the Display Language............... 114 ● Adjusting Passive Probes................ -
Page 122: Aligning The Touchscreen
® Setting Up the Instrument R&S RTO2000 Setting the Display Language The overall pass/fail result is shown in the "Overall alignment state" field. The results of the individual alignment steps for each input channel are indicated in the "Results" tab. This information is required if problems arise. -
Page 123: Adjusting Passive Probes
® Setting Up the Instrument R&S RTO2000 Adjusting Passive Probes 2. Select the "System" tab. 3. Tap the "Language" button. The button shows the current language. 4. Select the required language. The instrument changes the language after a few seconds. - Page 124 ® Setting Up the Instrument R&S RTO2000 Adjusting Passive Probes Getting Started 1332.9719.02 ─ 07...
-
Page 125: Index
® Index R&S RTO2000 Index Cursors Minimizing results ....... 56 AC coupling Quick access ........99 Trying out ..........48 Trying out ..........56 Acquisition Single, multiple ........36 Start ............ 35 Data entry ..........106 Stop ............ 35 Data sheet ..........9 Trying out .......... - Page 126 ® Index R&S RTO2000 Logic probe connector ......28 GBIP connector ........29 Getting started ........... 8 Markers Grid ............84 Example ..........52 Grounding ..........17 Mask test Quick access ........99 Trying out ..........72 Hardware zoom ........98 Masks key ..........37 Help ............
- Page 127 ® Index R&S RTO2000 Options Results R&S RTO-B1 (MSO) ......28 Configuring display ......102 R&S RTO-B4 (OCXO) ......28 Rotary knobs R&S RTO-B10 (GBIP) ......29 Trying out ..........48 RTO-B4 ........... 28 RTO-B10 ..........29 Run ............35 Peak detect ..........43 Run Stop key ...........
- Page 128 ® Index R&S RTO2000 Spectrum measurements Mode ..........35, 41 Trying out ..........66 Position ..........85 Start up ............ 18 Slope ..........35, 41 Switch off Source ..........35 Instrument ........... 19 Trigger key ..........35 Waveform ........... 93 Tutorials ..........109 Switch on Waveform ...........
- Page 129 ® Index R&S RTO2000 Zoom Area ............ 86 Diagram ..........86 Fingertip ..........54 Quick access ........98 Standard ..........52 Trying out ..........52 Zoom key ..........37 Zoom waveforms ........89 Getting Started 1332.9719.02 ─ 07...
Need help?
Do you have a question about the RTO2000 and is the answer not in the manual?
Questions and answers