
Related Manuals for R&S RTE Series


Summary of Contents for R&S RTE Series
- Page 1 ® R&S Oscilloscope Getting Started (=J:J2) 1326102602 Distributed by: Sie haben Fragen oder wünschen eine Beratung? Angebotsanfrage unter 07121 / 51 50 50 oder über info@datatec.de...
- Page 2 ® This manual describes the following R&S RTE models with firmware version 4.75 and higher: ● R&S ® RTE1022: 200 MHz, 2 channels (1326.2000K22 and 1317.2500K22) ● R&S ® RTE1024: 200 MHz, 4 channels (1326.2000K24 and 1317.2500K24) ● R&S ® RTE1032: 350 MHz, 2 channels (1326.2000K32 and 1317.2500K32) ●...
-
Page 3: Table Of Contents
® Contents R&S Contents 1 Safety and Regulatory Information........5 1.1 Korea Certification Class A..............6 2 Key Features................7 3 Documentation Overview............8 3.1 Manuals and Instrument Help..............8 3.2 Data Sheet and Brochure..............9 3.3 Release Notes, Open Source Acknowledgment........ 9 3.4 Application notes, Application cards, Videos........ - Page 4 ® Contents R&S 6.7 Performing a Basic FFT Analysis............58 6.8 Performing Mathematical Calculations..........60 6.9 Performing a Search................62 6.10 Performing a Mask Test..............63 6.11 Printing and Saving Screenshots............66 6.12 Saving Data..................69 7 Operating the Instrument............72 7.1 Means of Manual Interaction..............72 7.2 Touchscreen Display................
-
Page 5: Safety And Regulatory Information
® Safety and Regulatory Information R&S Safety and Regulatory Information The R&S RTE oscilloscope is designed for measurements on circuits that are only indirectly connected to the mains or not connected at all. It is not rated for any measurement category. The instrument is rated for pollution degree 2 - for indoor, dry location use where only non-conductive pollution occurs. -
Page 6: Korea Certification Class A
® Safety and Regulatory Information R&S Korea Certification Class A Korea Certification Class A 이 기기는 업무용(A급) 전자파 적합기기로서 판매자 또는 사용자는 이 점을 주의하 시기 바라며, 가정외의 지역에서 사용하는 것을 목적으로 합니다. Getting Started 1326.1026.02 ─ 09... -
Page 7: Key Features
® Key Features R&S Key Features The R&S RTE oscilloscope provides fast signal acquisition and analysis: ● 1 million waveforms per second waveform acquisition rate ● Bandwidth up to 2 GHz, memory depth of 50 MSa per channel ● Highly accurate digital trigger system ●... -
Page 8: Documentation Overview
® Documentation Overview R&S Manuals and Instrument Help Documentation Overview This section provides an overview of the R&S RTE user documentation. Manuals and Instrument Help You find the manuals on the product page at: www.rohde-schwarz.com/manual/rte Getting started manual Introduces the R&S RTE and describes how to set up and start working with the instrument, and describes basic operations. -
Page 9: Data Sheet And Brochure
® Documentation Overview R&S Application notes, Application cards, Videos Service Manual Describes the performance test for checking the rated specifications, module replacement, firmware update, troubleshooting and fault elimination, and contains mechanical drawings and spare part lists. The service manual is available for reg- istered users on the global Rohde &... -
Page 10: Preparing For Use
® Preparing for Use R&S Unpacking and Checking the Instrument Preparing for Use This section describes the basic steps to be taken when setting up the R&S RTE for the first time. Risk of instrument damage due to inappropriate operating conditions An unsuitable operating site or test setup can damage the instrument and connected devices. -
Page 11: Positioning The Instrument
® Preparing for Use R&S Positioning the Instrument 5. Check the equipment for completeness using the delivery note and the acces- sory lists for the various items. 6. Check the instrument for any damage. If there is damage, immediately contact the carrier who delivered the instrument. - Page 12 ® Preparing for Use R&S Positioning the Instrument Risk of injury if feet are folded out The feet can fold in if they are not folded out completely or if the instrument is shifted. This can cause damage or injury. ●...
-
Page 13: Starting The Instrument
® Preparing for Use R&S Starting the Instrument 4.2.2 Rackmounting The instrument can be installed in a rack using a rack adapter kit. The order num- ber is given in the data sheet. The installation instructions are part of the adapter kit. - Page 14 ® Preparing for Use R&S Starting the Instrument To power on 1. Connect the power cable to the AC power connector on the rear panel of the R&S RTE. 2. Connect the power cable to the socket outlet. 3. Switch the main power switch at the rear of the instrument to position I. The power key on the front panel lights up.
-
Page 15: Connecting External Devices
® Preparing for Use R&S Connecting External Devices 2. Press the [POWER] key on the front panel. The instrument performs a system check, boots the Windows operating sys- tem, and then starts the R&S RTE firmware. The [POWER] key turns green and the illuminated keys on the front panel light up. - Page 16 ® Preparing for Use R&S Connecting External Devices 4.4.1 Connecting USB Devices The USB interfaces on the front and rear panels allow you to connect USB devi- ces directly to the instrument. The number of USB connectors can be increased by using USB hubs.
- Page 17 ® Preparing for Use R&S Connecting External Devices Connecting a keyboard The keyboard is detected automatically when it is connected. The default input language is English – US. To configure the keyboard properties: 1. Tap the "Find" icon (magnifier) on the Windows taskbar. 2.
- Page 18 ® Preparing for Use R&S Connecting External Devices After connecting an additional monitor or projector to the instrument, configure it for usage. The relevant settings are Windows settings but you can configure the displays directly in the instrument setup. 1. Check the input type of the monitor or projector. Make sure to select the cor- rect cable.
-
Page 19: Instrument Tour
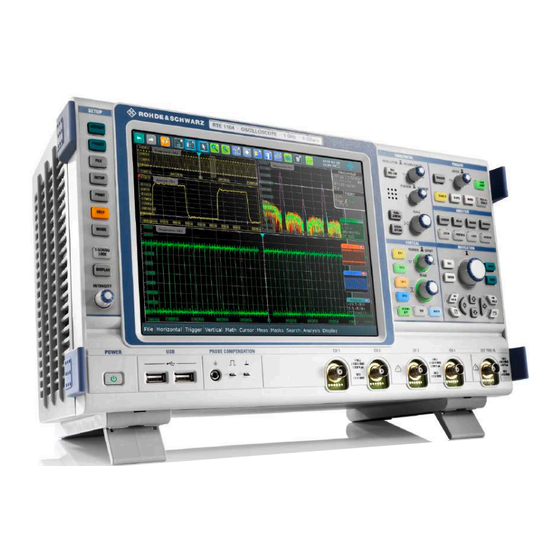
® Instrument Tour R&S Front Panel Instrument Tour This chapter describes the front and rear panels of the instrument including all function keys and connectors, and also the touchscreen with its control elements. Front Panel The front panel of the R&S RTE is shown in Figure 5-1. - Page 20 ® Instrument Tour R&S Front Panel 5 = [ANALYSIS] controls 6 = [VERTICAL] controls 7 = [NAVIGATION] controls 8 = [POWER] key 9 = USB 2.0 connectors 10 = Connectors for probe compensation 11 = Input channels 12 = External trigger input Instrument damage caused by cleaning agents Cleaning agents contain substances such as solvents (thinners, acetone, etc.), acids, bases, or other substances.
- Page 21 ® Instrument Tour R&S Front Panel Risk of electrical shock or fire Voltages higher than 30 V RMS or 42 V peak or 60 V DC are regarded as hazardous contact voltages. When working with hazardous contact vol- tages, use appropriate protective avoid electrical shock and injuries: ●...
-
Page 22: Rear Panel
® Instrument Tour R&S Rear Panel 5.1.2 Other Front Panel Connectors Besides the input connectors, the instrument has USB connectors and probe compensation connectors at the front panel. [USB] Two USB type A connectors that comply with standard USB 2.0. They are used to connect devices like keyboard, mouse, printer and USB flash drive. - Page 23 ® Instrument Tour R&S Rear Panel Figure 5-2: Rear panel view of R&S RTE 1 = AC power supply connector and main power switch 2 = USB connectors 3 = LAN connector 4 = DVI-D connector for external monitor 5 = Optional exchangeable solid state disk (SSD), option R&S RTE-B18 6 = External trigger output 7 = Reference input/output 8 = Slot for hardware option: mixed signal option R&S RTE-B1 (shown in picture), or waveform...
- Page 24 ® Instrument Tour R&S Rear Panel When you power up the instrument, be sure to comply with the warm-up phase specified in the data sheet before you start measurements. Two USB type A connectors that comply with standard USB 3.0. They are used to connect devices like keyboard, mouse, printer, and flash drive to store and reload instrument settings and measurement data.
-
Page 25: Keys And Controls
® Instrument Tour R&S Keys and Controls Mixed signal option R&S RTE-B1 / digital extension port R&S RTE-B1E The mixed signal option R&S RTE-B1 provides logic analizer functionality and 16 digital channels. It also can connect the R&S RT-ZVC multi-channel power probe. The connectors can be used to connect two logical probes with 8 digital channels each (D0 to D7 and D8 to D15), or two flat interface cables of R&S RT-ZVC. - Page 26 ® Instrument Tour R&S Keys and Controls ● Green: The instrument is ready for operation. 5.3.2 SETUP Controls SETUP keys set the instrument to a defined state, change basic settings, and provide print and help functions. The intensity rotary knob adjusts the display con- trast for several display elements.
- Page 27 ® Instrument Tour R&S Keys and Controls [HELP] Opens the appropriate help topic for the active tab. If no dialog box is open, the contents page of the help appears. [MODE] Opens and closes a dialog box where you can change the instrument mode: ●...
- Page 28 ® Instrument Tour R&S Keys and Controls [RES REC LEN], [HORIZONTAL] Open and close the "Setup" tab in the "Horizontal" dialog box, where you can: ● Adjust the time scale, and acquisition time ● Adjust the horizontal position, and reference point ●...
- Page 29 ® Instrument Tour R&S Keys and Controls "Horizontal position" defines the time distance of the reference point from the zero point of the diagram. Turn clockwise to move the waveform to the right. "Reference point" defines the position of the reference point on the screen. Turn clockwise to move it to the right.
- Page 30 ® Instrument Tour R&S Keys and Controls ● If the waveform is selected: Pressing the key opens the "Vertical" dialog box for the appropriate channel. The vertical rotary knobs are focused on the selected waveform. They are illumi- nated in the color of the selected waveform. [REF] Opens the "Reference"...
- Page 31 ® Instrument Tour R&S Keys and Controls The key is illuminated in the color of the selected signal and changes the color according to the new selection. 5.3.5 TRIGGER Controls The keys and knob in the TRIGGER functional block adjust the trigger and start or stop acquisition.
- Page 32 ® Instrument Tour R&S Keys and Controls [RUN CONT] Starts and stops the continuous acquisition. A green light indicates a running acquisition. A red light shows that acquisition is stopped. [RUN N× SINGLE] Starts a defined number of acquisitions. A green light indicates a running acquisi- tion.
- Page 33 ® Instrument Tour R&S Keys and Controls [MEAS] Starts the default automatic measurement for the active waveform and opens the "Measurement" result box. If you press the [MEAS] key while a measurement is enabled, the "Measure- ments" dialog box is displayed, where you can: ●...
- Page 34 ® Instrument Tour R&S Keys and Controls [LOGIC] Opens the dialog box for configuration of parallel buses and digital channels. The key lights up if you enable at least one parallel bus. You can switch off the selected bus using the [SIGNAL OFF] key. [HISTORY] The sample memory contains several stored acquisitions before the current one, which is shown in the display.
- Page 35 ® Instrument Tour R&S Keys and Controls ● To move zoom area, cursor line, or gate in diagrams: Turn to move the ele- ment that has the focus, and press to toggle the focus. [ESC] Closes a dialog box or input box. [UNDO] Reverses the last setting actions step by step.
- Page 36 ® Instrument Tour R&S Keys and Controls ● In dialog boxes, for option buttons in a column: select an option. In an open selection list, the keys scroll the list. Left arrow [⇦], Right arrow [⇨] The left and right arrow keys have the following effects: ●...
-
Page 37: Trying Out The Instrument
® Trying Out the Instrument R&S Displaying a Basic Signal Trying Out the Instrument This chapter introduces the most important functions and settings of the R&S RTE step by step. The complete description of the functionality and its usage is given in the "User Manual". Basic instrument usage is described in Chapter 7, "Operating the Instrument", on page 72. - Page 38 ® Trying Out the Instrument R&S Displaying a Basic Signal Connect the probe's ground connector to the right compensation pin , and the tip to the left pin The instrument recognizes the probe, and a signal is displayed in the diagram. 3.
-
Page 39: Acquiring Data
® Trying Out the Instrument R&S Acquiring Data 8. Tap the "Undo" icon on the toolbar repeatedly until the trigger mode is "Auto" and the trigger source is "CH1". 9. Press the [SLOPE] key to toggle the trigger slope. Watch the waveform and the "Trigger" settings. Acquiring Data You can acquire data using different arithmetic methods to get envelope or aver- age waveforms. -
Page 40: Changing The Waveform Scaling And Position
® Trying Out the Instrument R&S Changing the Waveform Scaling and Position The dialog box turns into a mini box that contains only the "Wfm Arithmetic" setting. 5. Select Envelope and check the waveform. The instrument sets the "Decimation" type automatically to Peak detect to dis- play the correct envelope waveform. - Page 41 ® Trying Out the Instrument R&S Changing the Waveform Scaling and Position If you use a passive probe, you can filter the DC component by using the AC cou- pling function. Then you quickly find the new trigger level, and try out the scaling functions: 1.
- Page 42 ® Trying Out the Instrument R&S Changing the Waveform Scaling and Position 3. To move the waveform back to the center of the screen, eliminate the offset in the vertical settings: a) Press the [Ch1] key again. b) Enter 0 V in the "Offset" field. The waveform is now displayed in the center of the display, with the x-axis crossing at 0 V.
- Page 43 ® Trying Out the Instrument R&S Changing the Waveform Scaling and Position 5. Tap the "Find level" icon on the toolbar. The instrument adjusts the trigger level, and a stable waveform is displayed. Getting Started 1326.1026.02 ─ 09...
- Page 44 ® Trying Out the Instrument R&S Changing the Waveform Scaling and Position 6. To examine one pulse in the signal in more detail, turn the horizontal "Scale" rotary knob. The current scale factor per division is displayed in the upper left-hand corner of the display while you turn the knob.
- Page 45 ® Trying Out the Instrument R&S Changing the Waveform Scaling and Position 7. To return to the original scaling, try the [UNDO] key in the [NAVIGATION] area: a) Press the [UNDO] key repeatedly until the original scaling is displayed. b) Press the [REDO] key to retrace the undone steps. Thus, you can toggle between the two displays using the undo and redo keys until you perform a different action.
-
Page 46: Zooming Into The Display
® Trying Out the Instrument R&S Zooming into the Display Zooming into the Display Using the [SCALE] rotary knobs, you can change the scaling of the time base and signal amplitudes in order to enlarge the waveform. If you need to see more details, use one of the zoom functions. - Page 47 ® Trying Out the Instrument R&S Zooming into the Display 4. To remove the zoom window and make room on the display for other results, tap the "Delete" icon and then the zoom window. 6.4.2 Using the Fingertip Zoom 1. Touch the "Zoom" icon on the toolbar and drag it down until the "Zoom" tool- bar menu opens.
-
Page 48: Displaying The Waveform History
® Trying Out the Instrument R&S Displaying the Waveform History 3. Touch and hold the waveform and move your finger slowly in horizontal direc- tion. Tip: You can turn the NAVIGATION knob to change the zoom factor while holding the waveform. 4. - Page 49 ® Trying Out the Instrument R&S Displaying the Waveform History 1. In the [HORIZONTAL] area, press the [ACQUISITION] key. The "Horizontal" settings dialog box opens. 2. Set the "Average count" to 10 to perform 10 waveform acquisitions. 3. Close the "Horizontal" dialog box. 4.
-
Page 50: Showing Basic Measurement Results
® Trying Out the Instrument R&S Showing Basic Measurement Results The currently displayed waveform is indicated in the "Current acq." field. 13. Close the "History" dialog box so you can see the waveform better. 14. Tap "Running" to stop the display. During running display, the "Play"... - Page 51 ® Trying Out the Instrument R&S Showing Basic Measurement Results 5. To save space in the display, minimize the result box. The most important results are displayed and updated in the result icon, as well. 6. To remove the result icon and make room on the display for other results, tap the red cross on the icon label.
- Page 52 ® Trying Out the Instrument R&S Showing Basic Measurement Results 2. Tap the "Automatic measurment" icon. Then tap the waveform. By default, the measurement of the high signal level is started. 3. Tap the "Automatic measurement" icon again. Then tap the waveform. By default, the measurement of the low signal level is started.
- Page 53 ® Trying Out the Instrument R&S Showing Basic Measurement Results 9. Select "Fall time". 10. Under "Statistics", tap "Enable". 11. Close the "Measurements" dialog box and check the results. 12. To see all results, drag up the border of the results tab. 13.
- Page 54 ® Trying Out the Instrument R&S Showing Basic Measurement Results 3. Tap the diagram. The result box shows the results of the default quick measurement. 4. Tap the icon to open the "Measurements" dialog box. 5. Select the "Quick Meas" "Setup". 6.
- Page 55 ® Trying Out the Instrument R&S Showing Basic Measurement Results Now the result box also shows the result of the time measurements. 9. Tap "Set as QuickMeas". The current configuration is set as default quick measurement and can be repeated until you save another configuration. 10.
- Page 56 ® Trying Out the Instrument R&S Showing Basic Measurement Results 6.6.4 Displaying a Histogram Histograms are useful to analyze the occurrence of measurement values statisti- cally. 1. Tap the "Histogram" icon on the toolbar. 2. Tap the diagram in which you want to generate the histogram. You can also draw a rectangle on the screen to define the area on which the histogram is based.
- Page 57 ® Trying Out the Instrument R&S Showing Basic Measurement Results 3. To display the measurement results for the histogram, tap the "Measurement" icon on the toolbar. 4. Tap the histogram. The waveform count for the histogram is displayed. 5. To get more measurement results for the histogram, double-tap the results. Alternatively, you can press the [MEAS] key on the front panel.
-
Page 58: Performing A Basic Fft Analysis
® Trying Out the Instrument R&S Performing a Basic FFT Analysis Both the histogram and any measurements based on that histogram are deac- tivated. Performing a Basic FFT Analysis During FFT analysis, a signal in the time domain is converted to a spectrum of frequencies. - Page 59 ® Trying Out the Instrument R&S Performing a Basic FFT Analysis 3. To measure the spectrum on the math channel, tap the "Measurement" icon on the toolbar. 4. Tap the spectrum waveform. The channel power is displayed below the FFT diagram. 5.
-
Page 60: Performing Mathematical Calculations
® Trying Out the Instrument R&S Performing Mathematical Calculations 7. To remove the FFT results, tap the "Delete" icon and then the spectrum wave- form. 8. Close the "Measurement" results. Performing Mathematical Calculations In addition to the measured waveforms, you can display calculated data to com- pare the current measurement result with. - Page 61 ® Trying Out the Instrument R&S Performing Mathematical Calculations 4. Tap the "Source1" icon and select Ch1. 5. Tap the "Operator" icon and select Rescale. 6. For "a", enter the vertical scaling factor, e.g. 4. 7. Under "b", enter the vertical position offset, e.g. 2. Look at the lower part of the dialog box and note that the instrument adjusts the "Vertical scale"...
-
Page 62: Performing A Search
® Trying Out the Instrument R&S Performing a Search Performing a Search In the following search, you detect positive and negative overshoots, i.e. values that exceed the high or low levels. To find these events, you can use the windows search. -
Page 63: Performing A Mask Test
® Trying Out the Instrument R&S Performing a Mask Test The acquisition stops, and the detected overshoots of the last acquisition are listed in the search result table. The search zoom window shows the last result that was found. Vertical lines indicate the time values for which a result was found. - Page 64 ® Trying Out the Instrument R&S Performing a Mask Test 3. Tap the corner points of the first mask segment on the touchscreen. Select the corner points of one complete pulse, with a minor offset to the inside. To finish the mask definition, double-tap the last point.
- Page 65 ® Trying Out the Instrument R&S Performing a Mask Test 7. Select the "Test Definition" tab. 8. Select channel 1 as the "Source". 9. Define the number of tolerable sample hits in the "Tolerance" field. A test has failed if the number of sample hits exceeds the limit of "Violation tolerance"...
-
Page 66: Printing And Saving Screenshots
® Trying Out the Instrument R&S Printing and Saving Screenshots 12. Press [RUN CONT] to start the next acquisition and watch the screen. 13. Close the "MaskTest" results box by tapping the red cross in the label. 6.11 Printing and Saving Screenshots You can print and save screenshots of the current display to document your results. - Page 67 ® Trying Out the Instrument R&S Printing and Saving Screenshots 4. Tap the upper left button and select the printer. 5. Tap "Print". The result is a monochrome image. 6. Close the dialog box. To configure the PRINT key 1. Open the "File" menu and tap "Frontpanel Setup". 2.
- Page 68 ® Trying Out the Instrument R&S Printing and Saving Screenshots 4. Close the dialog box. To save screenshots 1. Press the PRINT key. 2. Change the horizontal scale. 3. Press the PRINT key. The files are saved to the following directory: C:\Users\Public\Public Documents\Rohde-Schwarz\RTx\ ScreenShots The default file name is Screenshot_<date>_<index>_<time>.png.
-
Page 69: Saving Data
® Trying Out the Instrument R&S Saving Data 6.12 Saving Data After a measurement with the R&S RTE, you can save the resulting waveform data for further evaluation or comparison. You can also save measurement results, and device settings to repeat or restore previous measurements. ●... - Page 70 ® Trying Out the Instrument R&S Saving Data Saving data of an acquisition series 1. Press the [FILE] key on the front panel. 2. Select "Waveform". 3. Set the export scope of the waveform: a) Check the "Source". b) Set "Scope" to "Full Waveform". c) Tap "Data logging"...
- Page 71 ® Trying Out the Instrument R&S Saving Data 4. Select the results that you want to save. 5. For further usage of the results, select the "CSV-Delimiter" that is used to con- vert the values in columns. For MS Excel, select the semicolon. 6.
-
Page 72: Operating The Instrument
® Operating the Instrument R&S Means of Manual Interaction Operating the Instrument There are three ways to operate the R&S RTE. Manual operation Use the touchscreen, keys and rotary knobs, or an optional mouse and/or key- board. The principles of manual operation are explained in this section. Remote control Create programs to automatize repeating settings, tests, and measurements. -
Page 73: Touchscreen Display
® Operating the Instrument R&S Touchscreen Display Using the touchscreen is the direct interaction way. Use your finger to place waveforms on the screen, mark areas for zoom and histograms, set parame- ters in dialog boxes, enter data, and much more. The control elements and actions on the screen are based on common concepts, and you will easily become familiar with the user interface. - Page 74 ® Operating the Instrument R&S Touchscreen Display Figure 7-1: Display information 1 = Diagram 2 = Grid 3 = Signal bar with horizontal and trigger label (3a), signal icon with waveform settings (3b) and signal icon with minimized live waveform (3c) 4 = Trigger level 5 = Trigger position 6 = Reference point (distance from trigger position to reference point = horizontal position)
- Page 75 ® Operating the Instrument R&S Touchscreen Display By default, the diagram name contains the diagram number and the short names of the waveforms shown inside. To change the diagram name, touch and hold the tab name. The on-screen keyboard opens to enter the new name. Names must be unique.
- Page 76 ® Operating the Instrument R&S Touchscreen Display Below, each waveform is represented by a signal icon. If the waveform is shown in a diagram, the signal icon displays its main vertical and acquisition settings. If you tap the "Minimize" icon on the signal icon, the waveform switches from the diagram area to the signal icon: the icon shows the real-time preview of the wave- form.
- Page 77 ® Operating the Instrument R&S Touchscreen Display Zoom diagram and zoom area (7, 8) Zoomed waveforms are shown in separate zoom diagrams, in addition to the waveform diagrams. On the original waveform diagram, a rectangle indicates the zoomed section of the waveform - this is the zoom area. You can modify the zoom area by dragging the rectangle as a whole, and by dragging its edges.
- Page 78 ® Operating the Instrument R&S Touchscreen Display Figure 7-4: Control elements on the touchscreen = Toolbar = Signal bar = Menu bar = Result box (docked) = Dialog box = Tab in a dialog box Not shown = Input box Toolbar (1) The icons on the toolbar provide quick and easy access to the most important functionality.
-
Page 79: App Cockpit
® Operating the Instrument R&S App Cockpit Result box (4) If you perform cursor or automatic measurements, mask testing, or a search, the result box shows the results of the action. The position of the result box is adjust- able. It can be docked (default for measurements), floating, minimized to a result icon on the signal bar, or displayed in a separate diagram on the screen. -
Page 80: Working With Waveforms
® Operating the Instrument R&S Working with Waveforms Working with Waveforms The R&S RTE can create and display several types of waveforms: ● Channel waveforms: For each input channel, one channel waveform is shown. ● Reference waveforms: Four waveforms can be used as reference for comparison and analysis. ●... - Page 81 ® Operating the Instrument R&S Working with Waveforms Waveform handling The R&S RTE can show and analyze many waveforms. To handle this multitude while keeping track of it, the R&S RTE provides intelligent support: ● The color system helps to distinguish the waveforms. The color of the vertical rotary knobs indicates the signal that is focused (selected).
- Page 82 ® Operating the Instrument R&S Working with Waveforms To switch a waveform on A channel waveform is activated as soon as you connect the probe. You can switch it on and off according to your needs. ► Choose one of the following ways: ●...
-
Page 83: Rohde & Schwarz Smartgrid
® Operating the Instrument R&S Rohde & Schwarz SmartGrid ● To switch off a minimized waveform, tap the "Close" icon in the upper right corner of the minimized signal view. ● Disable "Show channel" in the "Vertical" > "Channels" tab. ●... -
Page 84: Using The Signal Bar
® Operating the Instrument R&S Using the Signal bar The Rohde & Schwarz SmartGrid appears and a blue area shows where the waveform will be placed. 2. Drop the waveform in the target area. The waveform appears in an existing or in a new diagram, and it is selected for further actions. - Page 85 ® Operating the Instrument R&S Using the Signal bar To scroll the signal bar If the signal bar contains more than four icons, not all icons are visible on the dis- play. ► Touch one of the signal icons and move it up or down until the required icon appears.
-
Page 86: Toolbar
® Operating the Instrument R&S Toolbar To change the colors If you want to highlight the signal bar, you can change the "Fill color" and "Border color" of the bar. 1. Press the [DISPLAY] key on the front panel. 2. In the "Display" dialog box, select the "Diagram Layout" tab. 3. - Page 87 ® Operating the Instrument R&S Toolbar 7.7.1 Using the Toolbar Using the toolbar is easy and straightforward. Some of the toolbar functions are one-click actions. These actions are performed immediately when you tap the icon. Other toolbar functions are analyzing functions. These actions are interactive actions.
- Page 88 ® Operating the Instrument R&S Toolbar 1. On the "Display" menu, select "Toolbar". 2. Select the required toolbar functions: ● Disable the functions that you do not need. Enable the functions that you want to add to the toolbar. ● To display all available toolbar icons, tap "Show All". ●...
- Page 89 ® Operating the Instrument R&S Toolbar One-click actions Interactive actions Undo Zoom Redo Search Show Help Cursor Graphical Recall (load saveset) Masktest Save Settings Histogram Save Screenshot Measurement Create Report Quick meas Clear all Show Signal Bar Select Autoset and Preset Delete Run / Stop and Run Single Label...
- Page 90 ® Operating the Instrument R&S Toolbar Show Help Enables the tooltip display. A short description appears when you tap a parameter in a dialog or result box. To open the corresponding help topic, tap the "Show Help" button in the lower right corner of the tooltip. See also: Chapter 7.12, "Getting Information and Help",...
- Page 91 ® Operating the Instrument R&S Toolbar Coupled zoom ← Zoom Creates a coupled zoom area and its related zoom diagram. If you change the size of one zoom area, the size of all coupled zoom areas is changed as well. First, create a zoom using the "Standard"...
- Page 92 ® Operating the Instrument R&S Toolbar Histogram The histogram icon on the toolbar shows the last selected histo- gram type. A short tap on the icon activates the selected histogram. If you touch the icon and drag your finger down, a menu opens where you can select another histogram type: horizontal histogram, or vertical histogram.
- Page 93 ® Operating the Instrument R&S Toolbar Tap the icon and then tap the area or diagram to be deleted, or the waveform to be switched off. Save Settings Saves the current instrument settings in a saveset. The filename is created according to the autonaming pattern.
-
Page 94: Displaying Results
® Operating the Instrument R&S Displaying Results Label Defines a waveform label that names or explains the waveform. Tap the icon and then tap the waveform to be labeled. If you tap the display background, the label is assigned to the selected waveform. Enter the label text using the onscreen keyboard. - Page 95 ® Operating the Instrument R&S Displaying Results ● In a docked tab below the diagram (available only for automatic and cursor measurements) The default position and the font size can be adjusted. To arrange a result box on the display ►...
-
Page 96: Using Dialog Boxes
® Operating the Instrument R&S Using Dialog Boxes To open the corresponding setup dialog box ► In the result box, tap the icon. Alternatively, double-tap the results. The dialog box with corresponding settings opens. To define the default position of measurement results For results of automatic and cursor measurements, the docked position below the diagram is the initial default position. - Page 97 ® Operating the Instrument R&S Using Dialog Boxes vides an overview of the accessing methods and describes how to use the dialog boxes. Each dialog box has four icons in the upper right corner: Go back: opens the previously opened dialog box. Go forward: opens the next dialog box.
-
Page 98: Entering Data
® Operating the Instrument R&S Entering Data 3. To restore the complete dialog box, tap the "Maximize" icon in the small box. To close a dialog box ► Tap the "Close" icon in the upper right corner. Press the [ESC] key on the front panel. To select an option in a dialog box ►... - Page 99 ® Operating the Instrument R&S Entering Data Using rotary knobs 1. Turn the knob to change the value. 2. To toggle the increment, tap the "Steps" icon in the input box. 3. To set the parameter to the autoset value (if available), tap the "RESET" icon. For data input in dialog boxes, the touchscreen provides an on-screen keypad to enter numeric values and units.
- Page 100 ® Operating the Instrument R&S Entering Data To toggle between small steps and large steps, tap the "Steps" icon. ● To get the value that was used before the keypad was displayed, tap "Cur". ● To enter a user-defined value, tap the numbers and complete the entry by tapping the unit button.
-
Page 101: Messages
® Operating the Instrument R&S Getting Information and Help 2. To change the value with a small step size, turn the rotary knob. Alternatively, press the [⇧] and [⇩] keys for a larger step size. If you edit numeric data in tables, the entry field must be in edit mode. To activate the edit mode, press ENTER, or the [☑] key, or the navigation rotary knob. - Page 102 ® Operating the Instrument R&S Getting Information and Help ● The general help explains a dialog box, provides instructions, and general information. 7.12.1 Displaying Help To display tooltips and context help 1. Enable the "Tooltip" icon on the toolbar. 2. Tap the parameter for which you need information. The tooltip opens.
- Page 103 ® Operating the Instrument R&S Getting Information and Help The Help toolbar provides some buttons: ● To browse the topics in the order of the table of contents: Up arrow = previous topic, Down arrow = next topic ● To browse the topics visited before: Left arrow = back, Right arrow = forward ●...
- Page 104 ® Operating the Instrument R&S Getting Information and Help To close the Help window ► Select the "Close" icon in the upper right corner of the help window. Or: Press the [ESC] key. Getting Started 1326.1026.02 ─ 09...
-
Page 105: Setting Up The Instrument
® Setting Up the Instrument R&S Performing a Self-alignment Setting Up the Instrument Basic setup procedures for the instrument are the following: ● Performing a Self-alignment................105 ● Aligning the Touchscreen................106 ● Setting the Display Language............... 106 ● Adjusting Passive Probes................ -
Page 106: Aligning The Touchscreen
® Setting Up the Instrument R&S Setting the Display Language The overall pass/fail result is shown in the "Overall alignment state" field. The results of the individual alignment steps for each input channel are indicated in the "Results" tab. This information is required if problems arise. Aligning the Touchscreen When the device is delivered, the touchscreen is initially calibrated. -
Page 107: Adjusting Passive Probes
® Setting Up the Instrument R&S Adjusting Passive Probes 1. Press the [SETUP] key. 2. Select the "System" tab. 3. Tap the "Language" button. The button shows the current language. 4. Select the required language. The instrument changes the language after a few seconds. Adjusting Passive Probes When using a passive probe, you have to compensate it when you connect it to the instrument the first time. -
Page 108: Contacting Customer Support
® Contacting Customer Support R&S Contacting Customer Support Technical support – where and when you need it For quick, expert help with any Rohde & Schwarz product, contact our customer support center. A team of highly qualified engineers provides support and works with you to find a solution to your query on any aspect of the operation, program- ming or applications of Rohde &... -
Page 109: Index
® Index R&S Index AC coupling Data entry ..........98 Trying out ..........40 Data sheet ..........9 Acquisition Decimation ..........39 Single, multiple ........32 Delete ............92 Start ............ 32 Diagrams ..........74 Stop ............ 32 Dialog boxes ..........77 Trying out .......... - Page 110 ® Index R&S Getting started ........... 8 LOGIC key ..........34 Grid ............75 Logic probe connector ......25 Grounding ..........13 Markers Hardware zoom ........90 Example ..........46 Help ............8 Mask test Open ..........102 Quick access ........91 Search for topic .........103 Trying out ..........
- Page 111 ® Index R&S R&S RTE-B6 (waveform and function Resolution Rotary knob ........28 generator) ........... 25 R&S RTE-B10 (GBIP) ......25 Result boxes ..........77 Background transparency ....27 Displaying ........... 94 Results Peak detect ..........39 Configuring display ......94 Position Rotary knobs Horizontal ..........28 Trying out ..........
- Page 112 ® Index R&S SIGNAL OFF key ........30 Lock, unlock ........27 Signal view ..........75 Usage ..........72 SLOPE Transparency ...........27 Key ............31 Trigger Trying out ..........37 Controls ..........31 SmartGrid ..........83 External input ........20 SOURCE key .......... 31 External output ........24 Spectrogram ..........
- Page 113 ® Index R&S XY ............80 Zoom ...........80 Web interface .......... 72 Windows Access ..........16 XY-waveforms ......... 80 Zoom Area ............ 77 Diagram ..........77 Fingertip ..........47 Quick access ........90 Standard ..........46 Trying out ..........46 Waveforms ..........
Need help?
Do you have a question about the RTE Series and is the answer not in the manual?
Questions and answers