
Subscribe to Our Youtube Channel
Related Manuals for Wiznet W7100 Debugger


Summary of Contents for Wiznet W7100 Debugger
- Page 1 W7100 Debugger Guide Version 0.91 © 2009 WIZnet Co., Inc. All Rights Reserved. For more information, visit our website at http://www.wiznet.co.kr © Copyright 2009 WIZnet Co., Inc. All rights reserved.
-
Page 2: Table Of Contents
Goto Previous Break Point ..............20 Break Point Window ................20 Source and Assembly window ..............21 Source Window ................. 21 Assembly window ................22 Search & Variable Window ..............23 © Copyright 2009 WIZnet Co., Inc. All rights reserved. - Page 3 Symbol window ................25 Register window ................26 Memory window .................. 27 IData Memory Window..............28 External Data Memory Window ............28 Code Memory Window ..............29 Flash Memory Window..............30 © Copyright 2009 WIZnet Co., Inc. All rights reserved.
-
Page 4: Driver Installation For The Debugger
If it is not automatically installed, select the ‘Install from a list or specific location (Advanced) and set our attached driver as below. [Fig.1.2] The new hardware search window 2 Wait for searching the device driver of the Debugger. When the device driver installation is © Copyright 2009 WIZnet Co., Inc. All rights reserved. - Page 5 END button to finish. [Fig.1.3] Completing the new hardware searching #2 © Copyright 2009 WIZnet Co., Inc. All rights reserved.
-
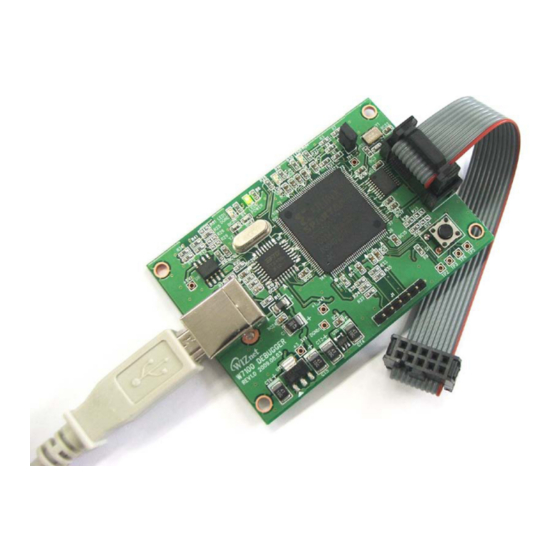
Page 6: Connect The Debugger
USB cable between the Debugger and PC. Next, insert the power cable to the IMCU7100EVB, and push the EVB reset button as figure 2.1. Then, push the debugger reset button of the Debugger. Confirm the LED5 (RUN LED) after pushing these reset button. © Copyright 2009 WIZnet Co., Inc. All rights reserved. - Page 7 LED5 is not turned on, it means that W7100 is not recognized. Check the connecting cable or try to reset the IMCU7100EVB and the Debugger. The LED5 should be turned on before using the W7100 Debugger. © Copyright 2009 WIZnet Co., Inc. All rights reserved.
-
Page 8: Installation Of The W7100 Debugger
3 Installation of the W7100 Debugger In this section, the installation of W7100 Debugger is explained. First, run the W7100 Debugger install file. [Fig.3.1] The W7100 Debugger install file Then the installation of iMCU7100EVB debugger is started. Push the Next button to setup. -
Page 9: Keil Project
Keil uVision3 project Only hex file (Restricted symbol function) To use the W7100 debugger, the ‘make hex file’ option and ‘make symbol’ option should be activated in the KEIL project. If they are not activated, the W7100 debugger cannot find the hex file to load. - Page 10 [Fig.4.3] Listing tap of the ‘Options for Target’ window Also check the ‘Symbols’ option of the ‘Assembler Listing’ region. The ‘Assembler Listing’ is optional. Click the ‘OK’ button to finish, and compile the KEIL project. © Copyright 2009 WIZnet Co., Inc. All rights reserved.
- Page 11 If the user use the assemble code, the user could have a xxx.SRC file in the KEIL project. Then the user must delete the xxx.SRC file and check the ‘Generate Assembler SRC File’ and ‘Assemble SRC File’ options to avoid error on the W7100 debugger. (The error message is shown as in the figure 5.4.) [Fig.4.5] Deleting the xxx.SRC file...
- Page 12 First, open the Options for File ‘xxx.c’ that uses the Assemble code. [Fig.4.6] Open the Options for File ‘xxx.c’ Then, check the ‘Generate Assembler SRC File’ and ‘Assemble SRC File’ options. [Fig.4.7] Setting the Options for File ‘xxx.c’ © Copyright 2009 WIZnet Co., Inc. All rights reserved.
-
Page 13: Debugger Menu
5 Debugger menu Open project The W7100 debugger can debug the KEIL project or the hex file. To debug the KEIL project or the hex file, run the W7100 debugger and open the hex file. Open Project. The Open Project command is used to open a project. - Page 14 If the user opens the project that is consisted only with a HEX file, the Debugger will show a caution message. And it shows only ‘Assembly window’. [Fig.5.3] Complete opening the project © Copyright 2009 WIZnet Co., Inc. All rights reserved.
-
Page 15: Reload Project
The Close project command is used to close a project. Select ‘Project’ => ‘Close’ or push the short key Ctrl + Q. *Note: While using the W7100 debugger, the user must use the ‘stop’ command in order to close the debugger. -
Page 16: Board Reset Only
‘Debugger commands’ such as ‘Continue, Step, Next’. [Fig.5.6] Load image mismatch Debugging The W7100 Debugger serves ‘Debug’ and ‘Tool’ menu and Toolbar button for debugging. [Fig.5.7] Deugging menu Go to Source Line The Go to Source Line command is used to move the cursor to the wanted source line. To use this function, select the ‘Tool’... -
Page 17: Run And Stop
Next. It can also be done by short key F10. If the user has only the HEX file to debug, the Step command executes one instruction, just like the Nexti command. Stepi The Stepi command executes only one instruction. If the instruction is a Function call, the © Copyright 2009 WIZnet Co., Inc. All rights reserved. -
Page 18: Nexti
[Fig.5.8] Run To Cursor Line command Sometimes the ‘Run To Cursor Line’ command continues when the cursor is not properly set. If that is the case, execute the Stop command to stop it. © Copyright 2009 WIZnet Co., Inc. All rights reserved. -
Page 19: Break Point
Set the breakpoint and execute the Continue command. Then the debugger will run until it meets the breakpoint and will stop at the checked breakpoint. After that, the user can use © Copyright 2009 WIZnet Co., Inc. All rights reserved. -
Page 20: Clear Break
The Goto Previous Break Point command will move the cursor to the previous break point. To use this function, Click the button on the Toolbar Select the ‘Tool’ menu => ‘Goto Pre Break Point’ Break Point Window The Break Point Window command shows all checked breakpoints. © Copyright 2009 WIZnet Co., Inc. All rights reserved. -
Page 21: Source And Assembly Window
Source Window [Fig.5.11] Source Window menu The Source window is shown in the figure5.11. : indicates the PC (Program Counter) in the source code : means Breakpoint is set on this line © Copyright 2009 WIZnet Co., Inc. All rights reserved. -
Page 22: Assembly Window
: Indicates the PC’s location of the instruction : Indicates the break point : Shows the assemble code with related C code : Shows the break point double click: Sets or unsets the break point © Copyright 2009 WIZnet Co., Inc. All rights reserved. -
Page 23: Search & Variable Window
6 Search & Variable Window The W7100 debugger provides various windows to see the local variable, global variable, and the register value. Global variable window: Shows the value of global variable in the project Local variable window: Shows the value of local variable at the PC(program counter) - Page 24 External memory => E:0x000300:4 [Fig.6.1] Display format User can select the display format by clicking the mouse right button on the search, local and global window such as binary, octal, decimal and hexadecimal. © Copyright 2009 WIZnet Co., Inc. All rights reserved.
-
Page 25: Local Variable Window
[Fig.6.3] Global variable window Symbol window The symbol window shows the information of all symbols in the project. It shows the class type and the address of the related symbol. © Copyright 2009 WIZnet Co., Inc. All rights reserved. -
Page 26: Register Window
PSW, and special function register (SFR). To modify the value of the register, click the field of register value and write the new value. But if the register is read only, then the value is not changed. [Fig.6.5] Register window © Copyright 2009 WIZnet Co., Inc. All rights reserved. -
Page 27: Memory Window
Activate Code memory window: Click the button or select the ‘Window’ menu => ‘Code Memory Window’ Activate Flash memory window: Click the button or select the ‘Window’ menu => ‘Flash Memory Window’ © Copyright 2009 WIZnet Co., Inc. All rights reserved. -
Page 28: Idata Memory Window
If the internal data memory value updates and the debugger command is in stop state, it updates the internal data memory value to the iMCU7100API board. External Data Memory Window The external data memory window shows the value of external data memory (X:0x000000 ~ X:0xFFFFFF). © Copyright 2009 WIZnet Co., Inc. All rights reserved. -
Page 29: Code Memory Window
[Fig.7.5] Code Memory window As in the section7.2 External Data Memory Window, the code memory window has a button for updating the value of code memory. © Copyright 2009 WIZnet Co., Inc. All rights reserved. -
Page 30: Flash Memory Window
7.4.2 Data Memory Domain Checked!! [Fig.7.6] Flash memory window for data memory If the ‘Data memory’ option is checked, it will shows the value of flash data memory (0x00 © Copyright 2009 WIZnet Co., Inc. All rights reserved. - Page 31 But it has the flash write button which writes the whole value of flash memory window to the flash memory of iMCU7100API. Also it has a button for updating the value of flash memory. © Copyright 2009 WIZnet Co., Inc. All rights reserved.
- Page 32 Document History Information Version Date Descriptions ver. 0.9 HWD 2009. 8. 13 Release with W7100 launching ver. 0.91 2009. 12 Modify section2 “Connect the debugger”. Add about debugger reset button. © Copyright 2009 WIZnet Co., Inc. All rights reserved.
Need help?
Do you have a question about the W7100 Debugger and is the answer not in the manual?
Questions and answers