Table of Contents
Advertisement
Quick Links
Advertisement
Table of Contents

Related Manuals for Viavi OSA-4100


Summary of Contents for Viavi OSA-4100
- Page 1 OSA-4100 / OCV-4100 User manual BN 2332/91.11 2021.04 English...
- Page 2 ITU-T and/or ETSI. Copyright ©Copyright 2021 Viavi Solutions Inc. All rights reserved. Viavi and the Viavi logo are trademarks of Viavi Solutions Inc. All other trademarks and registered trademarks are the property of their respective owners. Viavi Solutions Deutschland GmbH Arbachtalstraße 5, D-72800 Eningen u.
-
Page 3: Table Of Contents
Contents 1 Introduction Nano-OSA module ......Symbols used in this user manual ....2 Safety Information Intended and proper use . - Page 4 12 Specifications 13 Ordering Information 14 Product Regulatory Compliance Viavi Environmental Management Program ....55 EU WEEE and Battery Directives ....56 EU REACH .
-
Page 5: Introduction
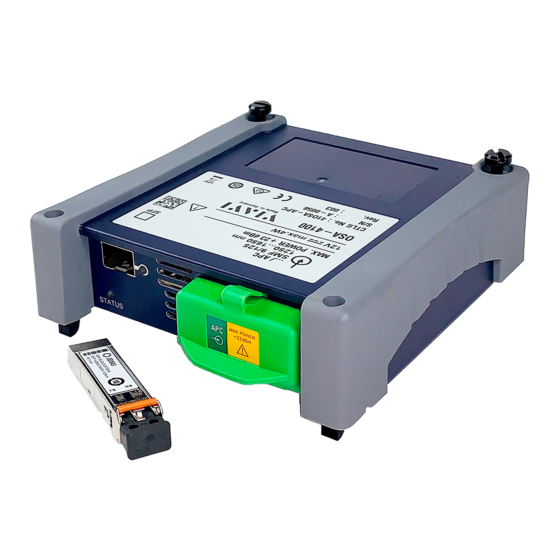
Base Unit user manual. Nano-OSA module Figure 1.1: Nano-OSA module The Nano-OSA is Viavi’s new generation of DWDM analyzer modules. It scans the full C-band wavelength range between 1260 and 1650 nm for commissioning, upgrade, and trouble shooting of DWDM networks. The Nano-OSA offers the functionality and speed of an optical... - Page 6 Introduction SFP Slots The Nano-OSA offers 1 integrated SFP slot for mounting one SFP transceiver module or tunable laser (to be ordered separately). These SFP+ modules can be used as a DWDM stimulus to check DWDM networks together with the DWDM analyzer. An activated transceiver module connected to the SFP+ slot emits optical radiation at the output “TX”.
-
Page 7: Symbols Used In This User Manual
Introduction Symbols used in this user manual The following character formats are used in this user manual: Requirement This requirement must be met first; e.g. The device is switched on. Instruction ◮ Follow the instructions given (the numbers indicate the order in which the instructions should be fol- lowed);... -
Page 8: Safety Information
◮ Observe the specified measurement range. ◮ Always make sure that the instrument is in proper working order before switching it on. ◮ The module shall only be operated in VIAVI ap- proved mainframes. User requirements OSA devices must be operated by skilled and trained people only. -
Page 9: General Laser Safety
Laser safety General laser safety Laser radiation can cause irreparable damage to the eyes and skin. The Nano-OSA SFP-Bay laser sources are Class 1 laser products according to DIN EN IEC 60825-1:2014 or 60825- 1:2007. Class 1 lasers are safe under reasonably foreseeable operating conditions, including the use of optical aids. -
Page 10: Specific Laser Safety
Laser safety Specific laser safety Laser classification of the SFP module SFP laser classification Laser radiation can cause irreparable damage to eyes and skin. Always be aware of the laser classification of the device to be connected! To find out the appropriate laser classification, associated wavelengths and optical power levels, see: –... -
Page 11: General Warning Symbol
Laser safety Safety instructions for class 1M laser products Visible & Invisible laser radiation Viewing the laser output of a class 1M laser prod- uct with cer- tain optical instruments (for ex ample eye loupes, magnifiers, microscopes) within a dis- tance of 100 mm may pose an eye hazard. -
Page 12: Ventilation
◮ Do not open the instrument for maintenance or service. Service shall be performed by Viavi trained personnel only. Water and cleaning fluids The instrument may be damaged or destroyed if water or cleaning fluids penetrate it. -
Page 13: Getting Started
start GETTING STARTED Starting the OSA application The fiber to be tested is connected to the optical connec- tor. 1. Select the Home button. 2. To start the OSA application, click on the OSA Icon. Figure 3.1: Home screen with Nano-OSA Application Nano-OSA user manual 13/59... -
Page 14: Configuration
Configuration CONFIGURATION After connecting the fiber to be tested to the optical connector, you must select the Nano-OSA module (see the Base Unit user manual). To configure the Base Unit in preparation for an OSA test on a fiber, press the SETUP button. Two configuration procedures are available: •... -
Page 15: Manual Configuration
Configuration Figure 4.1: Auto-set softkey (1) Manual configuration Instead of selecting the Auto-set mode, the configuration parameters can be set manually. The parameter to be modified must be selected by means of the direction keys , , and ➤ . The possible options then appear on the screen: make your choice and confirm by using the Enter key . -
Page 16: Measurement Parameters
Configuration Measurement parameters Sweep Single There will be one single measurement and the display of its results. Continue There will be a measurement with refreshment of the trace and real time display of results. Statistics In this mode, the number of samples concerned by statistics must be entered (next parameter). - Page 17 Configuration Drift mode Monitoring Time The Monitoring Time parameter sets the time frame for completing all measurements Intervall The Interval sets the timedelay between measurements Nano-OSA user manual 17/59...
- Page 18 Configuration OO-OSNR method ∗ The OO-OSNR mode is used to measure the channel OSNR in a two step process. When selecting the OO- OSNR in the Setup Measurement menu, a new button on the second result-screen is presented. Table 4.1: OO-OSNR measurement softkey the first measurement is used as reference scan with the channel signal being switched on.
- Page 19 Configuration Signal Threshold Threshold for detection of channels. Auto • The threshold is determined automatically. Manual • Editable from -54.9 to +10 dBm • To modify values: use direction keys or Edit Number Note: Modification of the parameters Channel settings and Signal threshold will only modify the results if the Nano-OSA module in use is the one that was used for the acquisition...
-
Page 20: Splitter Compensation
Configuration Channel Width Parameter for preset the spectral width of channels. Used to determine whether channels are seperated from each other or should be interpreted as a combined channel Auto Channels spectral width is smaller than 50 Ghz = 0.4 nm Manual editable from 12.5 to 2500 GHz Splitter Compensation... -
Page 21: Grid
Configuration Grid Four possible types of grid are proposed with different corre- sponding values, some of which are fixed or non- applicable, others editable. The type Conventional and the option None do not give access to the parameters of the Grid sub-menu; the others give access to certain options, as shown in the table of the figure : Grid name... -
Page 22: Osnr
Configuration OSNR For measurement the OSNR , one has the possibility to vary boundary conditions in order to optimize the measurement precision and/or display OSNR in different bandwidths OSNR method • Left & Right both slopes of channel are investigated to find the noise floor •... -
Page 23: Display
Configuration Display Configuration of various properties concerning the pre- sented information on the screen Auto Zoom • On Display is zooming automatically depending on measurement range • Off auto-zooming is disabled • nm (wavelenght in nanometer) Unit of x-axis • THz (frequency in terahertz) •... -
Page 24: Alarms
Configuration Alarms When Channel Ssettings is positioned on Grid, it is possible to activate an alarm system. This system is based on a system of thresholds. Any measurement results that exceed these thresholds are displayed in red in the table, and the icon appears at the top right of the screen. - Page 25 Configuration Global alarms Number of channels Yes/No Delta channel power ‘no’ or threshold modifiable from 0.1 to 60dB Delta OSNR ‘no’ or threshold modifiable from 0.1 to 60dB Composite power ‘no’ or threshold modifiable from -59.9 to 20dBm 1) Max. acceptable variation between max & min power on all channels 2) Maximum composite power Channel alarms Max channel offset...
-
Page 26: Link Discription
Configuration Link Discription Define the parameters in the Link Description menu and add a comment. Figure 4.3: Link Discription parameters Figure 4.4: Change Fiber Number choices 26/59 Nano-OSA user manual... -
Page 27: File Configuration
Configuration File Configuration In the File Configuration menu, the memory management is set. Figure 4.5: File parameters Figure 4.6: Change File Auto store choices Nano-OSA user manual 27/59... -
Page 28: Sfp Settings
Configuration SFP Settings The SFP Settings menu allows to set certain properties and parameters of the SFP (Small Form-factor Pluggable) laser module. Figure 4.7: SFP parameters and information State to turn the SFP on, set state to ‘ON‘ laser indicator LED of SFP is lit. Channel Frequency if a tunable SFP is used, the frequency can be set ITU_T Ch. -
Page 29: Measurement
Measurement To start a measurement: ◮ Press the START key. The Nano-OSA will scan over the entire wavelength range and the mea- surement result will be displayed in graphical and tabular format. ◮ During a measurement the Nano-OSA has a status LED at the connector side of the module indicating activity with RED color. - Page 30 Measurement Trace display By pressing the RESULTS button the results window is displayed. The Trace/Table layout on the screen can be customized by grabbing/touching the pink thin line between the graph and table section. This separation line can be moved to get the desired size of the graph and/or table Figure 5.2: pink separtion line between table and graph Figure 5.3: custom layout for table and graph...
-
Page 31: Result Display
RESULT DISPLAY Overview Figure 6.1: Example of results display Mini-trace Number of acquisition Filename (only if file was stored) Trace results associated with cursors A and B: • A, B: Wavelengths and power at cursors A and B position • A-B: Wavelength and power difference between cursors A and B link direction Alarm result (see... - Page 32 Result display The trace represents power (in dBm) as a function of frequency (in THz) or wavelength (in nm). If several acquisitions are performed, the trace displayed, Note is the one corresponding to the last acquisition. The softkeys enable access to following functions and menus: Fast report display and table results can be stored as PDF report or...
-
Page 33: Using The Cursor
Result display Using the cursor By means of the two cursors A and B following functions are available: • displaying the power level at the cursor position • measuring delta power and total power between two points • zooming and shifting the trace according to the cursor positions Figure 6.2: using the cursor on the display lock cursor distance... -
Page 34: The Zoom Function
Result display Selecting a cursor The cursors can be selected by using the touch-screen. Moving the cursor The cursor can be moved on the trace from one measurement point to the next or by jumping from one channel to the next (both forward and backward). To move the cursor on the trace: 1. -
Page 35: The Shift Function
Result display Zooming 1. Select a cursor or both cursors and move them to the desired position. 2. Press the zoom softkeys on the left side of the graph ( In , Out, Auto) The shift function The shift functions moves the trace and keeps the cursor on this positions. - Page 36 Result display To measure the Difference Power: ◮ Set the cursors to the desired positions. The difference power is displayed in the trace result field above the diagram (A-B). To measure the Total Power: 1. Set the cursors to the desired positions. 2.
-
Page 37: Multiple Traces (Overlay)
Result display Channel detection threshold On the trace, some peaks corresponding to noise could be mistaken for channels. It is therefore necessary to introduce a power threshold level: only peaks that exceed this threshold will be considered as channels and included in the table of results. To display or modify this threshold, press the SETUP key, then select Signal threshold in menu measurement. -
Page 38: Adjusting The Y Axis
Result display Figure 6.4: Overlay of two measurments / traces actual selected trace highlighted selected trace in graph To remove a trace: 1. Select the trace by touchscreen in the left upper region of the display 2. Press the Remove Current Trace softkey. Adjusting the y axis To compare curves, the y axis of the curves can be adjusted by the Y Reset/Y Shift/Y Exact softkey. -
Page 39: Displaying The Difference Of Two Curves
Result display Displaying the difference of two curves A difference can be build from two curves. 1. Measure/Load or Select the two curves. 2. Press the Overlay softkey and then 2 Curves Diff. The difference curve is displayed as a new trace in the diagramm. -
Page 40: Overview
TABLE DISPLAY The table may be displayed in a single line, on half of the screen or the whole screen as a function of the Trace/Table key. Overview Figure 7.1: Example of results display trace number Resolution of aquisition Number of aquisition OSNR method threshold for channel detection Channel information / Table contents:... - Page 41 Table display Table contents According to the choice made in the SETUP menu, the table of results may include: • either a line for each channel detected (if Channel Selection = All ) • or a line for each graduation, (if Channel Selection = Grid and a grid is selected) In the absence of statistics (see “Measurement parame-...
-
Page 42: Result Colors
Table display Table statistics When selecting the Statistics measurement mode and multiple acquisitions are performed, statistics are calcu- lated on the results. To display these results in the table: ◮ Select the Table Content key in Display menu, to either see statics for OSNR or Power/Wavelength measurements Result colors When Channel Selection is positioned on Grid and... - Page 43 Table display Red color indicates violated alarm thresholds Alarm Icon indicator ( Additionally the icon indicates that at least one result exceeds the threshold and if all results are within the thresholds ( no result is in red ), the icon becomes .
-
Page 44: Drift Measurement
DRIFT MEASUREMENT The Nano-OSA modules provide a Drift measurement application to perform multiple measurements and dis- play the recorded results in a graphical format (trace) over the time. This can be used to monitor the drift of power and wavelength of optical systems or components. This is important to measure the drift of non temperature sta- bilized transmitter in CWDM networks. - Page 45 Drift measurement Activating the Drift measurement will enable the following screen: Figure 8.1: Example of drift measurment, figure shows osnr drift over time In the Drift display, the measurement result is shown in a graphical format (trace over time / scans) and a tabular format.
- Page 46 Drift measurement All Zoom and Shift functions are available in Drift mode. By using the cursor A it is possible to get access to each measured data point. The Start value as well as the actual cursor position including the time information is shown in the gray area above the table.
-
Page 47: Reports
Reports Fast report Fast Report generates a report which is stored in file system Figure 9.1: Example of Fast Report Change the Fast Report parameters to your needs, and then press the save button/icon in the title bar... -
Page 48: Pdf File System Report
Reports PDF File system report To view the reports on the file system, select the File button Select the corresponding PDF File to which your report was stored. Figure 9.2: PDF Report loaded from file system 48/59 Nano-OSA user manual... -
Page 49: File Management
FILE MANAGEMENT Storing OSA measurements If Auto store has been selected, then results will be saved automatically. If not, or if you want to save the results under another name, directory etc.: 1. Click on FILE Icon. 2. navigate to the destination directory or create your own folder 3. -
Page 50: Maintenance
MAINTENANCE WARNING Invisible laser radiation Maintenance or cleaning of the instrument while it is connected or operating may damage the in- strument or injure yourself. ◮ Make sure that the instrument is switched off and disconnected from all optical radiation sources be- fore maintenance or cleaning. -
Page 51: Optical Surfaces
Maintenance Optical surfaces Dust and fingerprints can damage optical surfaces, particularly when such surfaces are pressed together. To protect the instrument and cables, every cable should be cleaned before it is connected to the instrument. The optical connectors on the instrument should also be cleaned regularly. -
Page 52: Specifications
SPECIFICATIONS typical at 23°C ±5°C Measurement Modes Operating Modes WDM, OO-OSNR, drift Graph (trace + overview) Display Modes WDM table and graph + table Ch-# , Ch-power, Ch-wavelength, Measurement parameters Ch-OSNR, Ch-offset, drift Spectral Measurement Ranges 1260 nm to 1650 nm Wavelength range 237.93 to 181.69 THz Wavelength accuracy... - Page 53 Specifications SFP/SFP+ Bay Can host one SFP/SFP+ transceiver or one tunable laser (not included) General Weight 0.45 kg (0.99 lbs) 128 x 134 x 40 mm Dimensions (W x H x D) (5.04 x 5.28 x 1.57 in) Environment Operation +5 to +40 °C (41 to 104 °F) Relative Humidity up to +31 °C 15 to 85 %...
-
Page 54: Ordering Information
ORDERING INFORMATION Modules Part Number OCV-4100 Optical Channel Verifier APC 41OCV-APC OCV-4100 Optical Channel Verifier PC 41OCV-PC OSA-4100 Optical Spectrum Analyzer APC 41OSA-APC OSA-4100 Optical Spectrum Analyzer PC 41OSA-PC SW-Options Part Number When ordered with mainframe OCV Drift SW Option (for OCV-4100) -
Page 55: Product Regulatory Compliance
Hazardous materials Viavi avoids or uses with care any hazardous or dangerous material in the manufacturing process or the end product. If the use of a dangerous material cannot be avoided, it is identified in product documentation and clearly labeled on the product itself. -
Page 56: Eu Weee And Battery Directives
◮ Any rechargeable accumultors that you purchased from Viavi can be returned to one of our Service Centers for disposal. Further instructions for returning waste equipment and batteries to VIAVI can be found in the WEEE section of Viavi’s Standards and Policies web page (https://www.viavisolutions.com/en-us/corporate/legal/policies- standards#sustain). -
Page 57: Eu Reach
For the Viavi position statement on the use of Proposi- tion 65 chemicals in Viavi products, see the Hazardous Substance Control section of Viavi’s Standards and Policies web page. -
Page 58: Rohs
Compliance RoHS 58/59 Nano-OSA user manual... - Page 59 Compliance North America +1 844-468 4284 Viavi product specifications and descriptions in Latin America +1 954 688 5660 this document are subject to change without China +86 21 6859 5260 notice. Germany +49 7121 86 0 © 2021 Nano-OSA user manual...
Need help?
Do you have a question about the OSA-4100 and is the answer not in the manual?
Questions and answers