Table of Contents
Advertisement
Quick Links
Advertisement
Table of Contents

Related Manuals for Hantek DSO5000BM Series

Summary of Contents for Hantek DSO5000BM Series
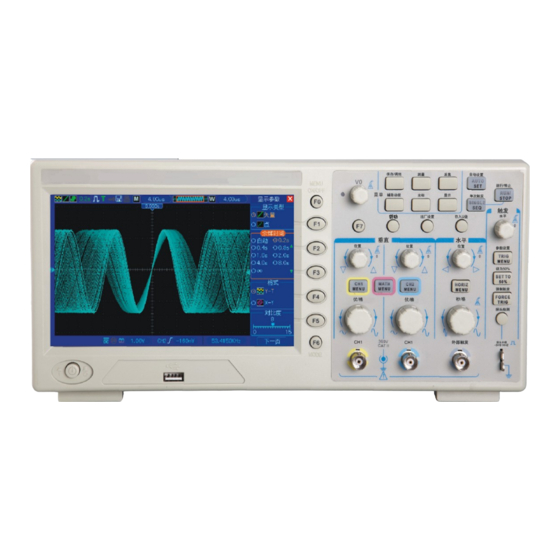
- Page 1 DSO5000BM Series Digital Storage Oscilloscope User Manual...
-
Page 2: Table Of Contents
Contents Contents CONTENTS ................................I COPYRIGHT DECLARATION ........................IV CHAPTER 1 SAFETY TIPS ..........................1 1.1 G ..........................1 ENERAL AFETY UMMARY 1.2 S ........................... 2 AFETY ERMS AND YMBOLS 1.3 T ............................2 ERMS ON RODUCT 1.4 S ............................. 2 YMBOLS ON RODUCT 1.5 P... - Page 3 Contents 5.2 H ..........................19 ORIZONTAL ONTROLS 5.2.1 Scan Mode Display (Roll Mode) ......................21 5.3 V ............................22 ERTICAL ONTROLS 5.3.1 Math FFT ............................... 24 5.3.1.1 Setting Time-domain Waveform ........................24 5.3.1.2 Displaying FFT Spectrum ..........................25 5.3.1.3 Selecting FFT Window ........................... 26 5.3.1.4 FFT Aliasing ..............................
- Page 4 Contents 8.2 A ..............................73 CCESSORIES CHAPTER 9 SERVICES AND SUPPORT ......................75 CHAPTER 10 GENERAL CARE AND CLEANING ..................76 10.1 G ............................. 76 ENERAL 10.2 C ..............................76 LEANING APPENDIX A HARMFUL AND POISONOUS SUBSTANCES OR ELEMENTS ........77 APPENDIX B INDEX ............................
-
Page 5: Copyright Declaration
Hantek reserves all rights to modify this document without prior notice. Please contact Hantek for the latest version of this document before placing an order. Hantek has made every effort to ensure the accuracy of this document but does not guarantee the absence of errors. Moreover, Hantek assumes no responsibility in obtaining permission and authorization of any third party patent, copyright or product involved in relation to the use of this document. -
Page 6: Chapter 1 Safety Tips
Safety Tips Chapter 1 Safety Tips 1.1 General Safety Summary Read the following safety precautions to avoid injury and prevent damage to this product or any products connected to it. To evade potential hazards, use this product only as specified. Only qualified personnel should perform maintenance. -
Page 7: Safety Terms And Symbols
Safety Tips 1.2 Safety Terms and Symbols The following terms may appear in this manual: WARNING. Warning statements point out conditions or practices that could result in injury or loss of life. CAUTION. Caution statements identify conditions or practices that could result in damage to this product or other property. - Page 8 Safety Tips device in a proper way, some substances it contains may become harmful or poisonous to environments or human bodies. To avoid them being released outside and to minimize the waste of natural resources, we suggest you reasonably call back this device to ensure proper recovery and recycling of most materials within it.
-
Page 9: Chapter 2 Overview
7 inch color Table 2-1 Model List of DSO5000BM Series DSO5000BM Series oscilloscopes cover the bandwidths from 60MHz to 200MHz, and provide the real-time and equivalent sample rates respectively up to 1GSa/s and 25GSa/s. In addition, they have maximum 1M memory depth for better observation of the waveform details, and 7 inch color TFT LCD as well as WINDOWS-style interfaces and menus for easy operation. - Page 10 Overview Context-Sensitive Push the HELP front-panel button and the oscilloscope displays information about the last menu displayed on the screen. The HELP SCROLL LED lights beside the HORIZONTAL POSITION knob indicate the alternative function of the knob. If a topic uses more than one page, turn the HELP SCROLL knob to move from page to page within the topic.
-
Page 11: Chapter 3 Getting Started Guide
Getting Started Guide Chapter 3 Getting Started Guide 3.1 Installation To keep proper ventilation of the oscilloscope in operation, leave a space of more than 5cm away from the top and the two sides of the product. 3.1.1Power Supply Use a power supply that delivers 90 to 240 V , 45 to 440 Hz. -
Page 12: Connect The Oscilloscope
Getting Started Guide 3.2.2Connect the oscilloscope Set the switch on the probe to 10X and connect the probe to Channel 1 on the oscilloscope. First, align the slot in the probe connector with the protuberance on the CH1 BNC and push to connect; then, turn to right to lock the probe in place;... -
Page 13: Probe Examination
Getting Started Guide 3.3 Probe Examination 3.3.1Safety When using the probe, keep your fingers behind the guard on the probe body to avoid electric shock. Do not touch metallic portions of the probe head while it is connected to a voltage source. Connect the probe to the oscilloscope and connect the ground terminal to ground before you start any measurements. -
Page 14: Probe Attenuation Setting
Getting Started Guide 2. Check the shape of the displayed waveform. Compensated correctly Overcompensated Undercompensated 3. If necessary, use a nonmetallic screwdriver to adjust the variable capacity of your probe until the shape of the waveform turns to be the same as the above figure. Repeat this step as necessary. -
Page 15: Self Calibration
Getting Started Guide 3.6 Self Calibration The self calibration routine helps optimize the oscilloscope signal path for maximum measurement accuracy. You can run the routine at any time but should always run it if the ℃ ambient temperature changes by 5 or more. -
Page 16: Chapter 4 Main Feature Description
Main Feature Description Chapter 4 Main Feature Description This chapter provides some general information that you need to learn before using an oscilloscope. It contains: 1. Oscilloscope setup 2. Trigger 3. Data acquisition 4. Waveform scaling and positioning 5. Waveform measurement 4.1 Oscilloscope Setup While operating the oscilloscope, you may often use three features: Autoset, saving a setup and recalling a setup. - Page 17 Main Feature Description to meaningful waveforms. Here introduce some basic concepts about trigger. Trigger Source: The trigger can be generated with multiple sources. The most common one is the input channel (alternative between CH1 and CH2). Whether the input signal is displayed or not, it can trigger normal operations.
-
Page 18: Data Acquisition
Main Feature Description Trigger level can be adjusted vertically Rising Edge Falling Edge Trigger slope can be rising or falling 4.3 Data Acquisition When you acquire an analog signal, the oscilloscope will convert it into a digital one. There are two kinds of acquisition: Real-time acquisition and Equivalent acquisition. -
Page 19: Waveform Measurement
Main Feature Description position changes, the waveform will move up, down, right, or left. The channel reference indicator (located on the left of the graticule) identifies each waveform on the screen. It points to the ground level of the waveform record. Vertical Scale and Position: The vertical position of a waveform can be changed by moving it up and down on the screen. - Page 20 Main Feature Description measure on the screen. To use cursors, push the CURSOR button. Cursor Cursor Automatic Measurement: The oscilloscope performs all the calculations automatically in this mode. As this measurement uses the waveform record points, it is more precise than the graticule and cursor measurements.
-
Page 21: Chapter 5 Basic Operation
The figure below illustrates the front panel of the DSO5000BM series digital oscilloscope. DSO5000BM... -
Page 22: Display Area
Basic Operation 5.1 Display Area 2 3 4 17 16 15 14 12 11 1. Display Format: : YT : XY : Vectors : Dots : Gray indicates auto persistence; Green means persistence display is enabled. When the icon is set to green, the time for persistence display will be shown behind it. 2. -
Page 23: Xy Format
Basic Operation 4. Tool Icon: If this icon lights up, it means the keyboard of the oscilloscope is locked by the host computer via USB control. : If this icon lights up, it means the USB disk has been connected. : This icon lights up only when the USB slave interface is connected with the computer. -
Page 24: Horizontal Controls
Basic Operation acquisition mode and displays data as dots. The sampling rate is fixed at 1 MS/s. The oscilloscope can acquire waveforms in YT format at any sampling rate. You may view the same waveform in XY format. To perform this operation, stop the acquisition and change the display format to XY. - Page 25 Basic Operation Options Settings Comments Window Control Major Window Selects the major or minor window in dual-window Minor Window mode. The window is highlighted once selected. Press this option button in single-window mode to enter the daul-window mode. Mark Right arrow This function is usable only in dual-window mode.
-
Page 26: Scan Mode Display (Roll Mode)
Basic Operation Location of expanded window data in memory Major Window Minor Window (Expanded Window) Multi-functional Knob 3.SEC/DIV Knob: Used to change the horizontal time scale so as to magnify or compress the waveform horizontally. If the waveform acquisition is stopped (by using the RUN/STOP or SINGLE SEQ button), the SEC/DIV control will expand or compress the waveform. -
Page 27: Vertical Controls
Basic Operation from left to right without any trigger or horizontal position control. 5.3 Vertical Controls Vertical controls can be used to display and remove waveforms, adjust vertical scale and position, set input parameters and perform math calculations. Each channel has a separate vertical menu to set. - Page 28 Basic Operation Probe Attenuation Selects a value according to the probe attenuation factor so as to ensure correct vertical readouts. Reduce 100X bandwidth to 6MHz when using a 1X probe. 1000X Invert Inverts the waveform relative to the reference level. Ground Coupling Used to display a zero-volt waveform.
-
Page 29: Math Fft
Basic Operation 5.3.1Math FFT This chapter elaborates how to use the Math FFT (Fast Fourier Transform). You can use the Math FFT mode to convert a time-domain (YT) signal into its frequency components (spectrum), and to observe the following types of signals: ... -
Page 30: Displaying Fft Spectrum
Basic Operation To set the FFT display, follow the steps below. 1. Push the MATH MENU button; 2. Set the Operation option to FFT; 3. Select the Math FFT Source channel. In many situations, the oscilloscope can also generate a useful FFT spectrum despite the YT waveform not being triggered. -
Page 31: Selecting Fft Window
Basic Operation Fundamental frequency component Frequency component 1. Frequency at the center graticule line 2. Vertical scale in dB per division (0dB=1V 3. Horizontal scale in frequency per division 4. Sample rate in number of samples per second 5. FFT window type 5.3.1.3 Selecting FFT Window Using windows can eliminate the spectral leakage in the FFT spectrum. - Page 32 Basic Operation Applying a window to the YT waveform changes the waveform so that the start and stop values are close to each other, which reduces the discontinuities. The Math FFT function has three FFT Window options. There is a trade-off between frequency resolution and amplitude accuracy for each type of window.
-
Page 33: Fft Aliasing
Basic Operation Waveform waveforms. This is actually the same as no windows. 5.3.1.4 FFT Aliasing Problems occur when the time-domain waveform acquired by the oscilloscope contains frequency components higher than the Nyquist frequency. The frequency components above the Nyquist frequency will be undersampled and displayed as lower frequency components that ‘fold back’... -
Page 34: Using Cursors To Measure Fft Spectrum
Basic Operation Vertical Zoom and Position When the FFT spectrum is being displayed, the channel vertical knobs become the zoom and position controls corresponding to their respective channels. The VOLTS/DIV knob provides the following zoom factors: X1(default), X2, X5 and X10. The FFT spectrum is magnified vertically to the marker M (math waveform reference point on the left edge of the screen). - Page 35 Basic Operation 1. Level It sets the amplitude level the signal must cross to cause an acquisition when using the Edge or Pulse Width trigger. 2. Set to 50% The trigger level is set to the vertical midpoint between the peaks of the trigger signal. 3.
- Page 36 Basic Operation Options Settings Comments Trigger Type Edge Video By default the oscilloscope uses the edge trigger which Pulse Slope triggers the oscilloscope on the rising or falling edge of Swap Overtime input signal when it crosses the trigger level (threshold). Source Select the input source as the trigger signal.
- Page 37 Basic Operation standard video signal will be triggered. The trigger coupling is preset to AC. Source Select the input source as the trigger signal. Ext and Ext/5 use the signal applied to the EXT TRIG connector as the source. EXT/5 Polarity Normal Normal: Triggers on the negative edge of the sync...
- Page 38 Basic Operation trigger circuit. HF Reject LF Reject More Switch between submenu pages. Trigger When: The pulse width of the source must be ≥5ns so that the oscilloscope can detect the pulse. Triggers when pulse is Triggers when pulse is less than width setting greater than width setting Threshold level...
- Page 39 Basic Operation Noise Reject HF Reject LF Reject Next Page Vertical Adjust the vertical window by setting two trigger levels. Select this option and press F3 to choose V1 or V2. When Select the trigger condition. ≠ < > Time 20ns to 10.0sec With this option highlighted by pressing F4, turn the multi-functional knob to set the time span.
- Page 40 Basic Operation Type Pulse Polarity Positive Negative When Select by F3. ≠ < > Set Pulse Pulse Width Push F4 to select. Adjust the multi-functional knob V0 to set Width the pulse width. Coupling Select by F5. Noise Reject HF Reject LF Reject Type Slope...
-
Page 41: Menu And Option Buttons
Basic Operation Mode Auto Normal Overtime Press F5 to select Overtime option and adjust V0 to set the time. Coupling Selects the components of the trigger signal applied to the trigger circuitry. HF Reject LF Reject Holdoff: To use Trigger Holdoff, push the HORIZONTAL Menu button and set the Holdoff Time option by pressing F4. -
Page 42: Save/Recall
Basic Operation UTIILITY: Displays the Utility menu. CURSOR: Displays the Cursor menu. DISPLAY: Displays the Display menu. 5.5.1SAVE/RECALL Press the SAVE/RECALL button to save or recall oscilloscope setups or waveforms. The first page shows the following menu. Options Settings Comments Waveforms Source Select a waveform display to store. -
Page 43: Measure
Basic Operation At most 9 groups of The white waveforms on the menu is setups can be stored the recalled RefA waveform Note: The oscilloscope will save the current settings if you wait 5 seconds after the last modification, and it will recall these settings the next time you power on the oscilloscope. 5.5.2MEASURE Push the MEASURE button to perform auto measurements. -
Page 44: Acquire
Basic Operation Positive Width Measure the time between the first rising edge and the next falling edge at the waveform 50% level. Negative Width Measure the time between the first falling edge and the next rising edge at the waveform 50% level. Do not take any measurement. - Page 45 Basic Operation (Real Time) Memory Depth 4K, 40K, 512K, 1M Select the memory depth for different board models. (Real Time) Normal: For the oscilloscope model with the bandwidth of 100MHz, the maximum sample rate is 1GS/s. For time base with insufficient sample rate, you may use the Sine Interpolation Algorithm to interpolate points between sampled points to produce a complete waveform record (4K by default).
-
Page 46: Utility
Basic Operation Input repeated signals First Acquisition Second Acquisition Third Acquisition Fourth Acquisition As shown above, acquire input signals (cycle repeatable) for more than once at a slow sample rate, arrange the sample points by the time they appear, then recover waveforms. 5.5.4UTILITY Push the UTILITY button to display the Utility Menu as follows. -
Page 47: Cursor
Basic Operation corresponding menu. 5.5.5CURSOR Push the CURSOR button to display the Cursor Menu. Options Settings Comments Type Select a measurement cursor and display it. Voltage Voltage measures amplitude while Time measures time and Time frequency. Source Select a waveform to take the cursor measurement. Use the readouts to show the measurement. -
Page 48: Fast Action Buttons
Basic Operation once it is captured. The different styles to display a waveform on the screen give significant information about it. There are two modes to display waveforms Single-window and Dual-window. Refer to Horizontal Controls for more information. Push the DISPLAY button and the following menu appears. Options Settings Comments... -
Page 49: Autoset
Basic Operation SINGLE SEQ: Acquire a single waveform and then stop the acquisition. RUN/STOP: Continuously acquire waveforms or stop the acquisition. HELP: Display the Help menu. DEFAULT SETUP: Recall the factory setup. Refer to the following table for relative content. Save to USB Disk: Save all displays on the screen to a USB device, just like the screen capturing function of a computer. -
Page 50: Help
Basic Operation If no signals are found and no channels are displayed, the oscilloscope will display and use Channel 1 as the trigger source. Sine Wave: When you use the Autoset function and the oscilloscope determines that the signal is similar to a sine wave, the oscilloscope displays the following options. - Page 51 Basic Operation and remove all the others. When you are at the default setup, press F1 to Undo Preset. Then the oscilloscope returns to the status before default setup. The table below gives the options, buttons and controls that change settings at default setup. Menu or System Option, Button or Knob Default Setting...
- Page 52 Basic Operation Trigger (Slope) Slope Rising Mode Auto Coupling When Trigger (Swap) Type Edge Slope Rising Mode Auto Coupling Level 0.00v Type Edge Slope Rising Mode Auto Coupling Level 0.00v Trigger (OT) Source Polarity Positive Mode Auto Time 20ns Vertical System, Coupling All Channels Bandwidth Limit...
-
Page 53: Multi-Functional Knobs And Buttons
Basic Operation 5.7 Multi-functional Knobs and Buttons V0: Multi-functional knob. Under different menu options, it supports selecting menu options (MEASURE), moving cursors and levels (Slope Trigger). Press this knob to reset data (trigger holdoff, overtime of the overtime trigger and slope trigger), select menu options and so on. - Page 54 Basic Operation 3. Probe Compensation: Voltage probe compensation output and ground, used to electrically match the probe to the oscilloscope input circuit. The probe compensation ground and BNC shields connect to earth ground and are considered to be ground terminals. To avoid damages, do not connect a voltage source to any of these ground terminals.
-
Page 55: Chapter 6 Application Examples
Application Examples Chapter 6 Application Examples This chapter unfolds a further description on main features of the oscilloscope by giving eleven simplified application examples for reference to help solve your own test problems. Taking simple measurements Using AUTOSET Using the Measure menu to take auto measurements Taking cursor measurements Measuring ring frequency and ring amplitude Measuring pulse width... - Page 56 Application Examples Connect the CH1 probe to the test point of the circuit; Press the AUTOSET button. The oscilloscope will automatically set the waveform to a best display. If you want to further optimize the waveform display, you may manually adjust the vertical and horizontal controls until the waveform meets your particular requirement.
-
Page 57: Example 2: Taking Cursor Measurements
Application Examples 6.2 Example 2: Taking Cursor Measurements You can use the cursor to quickly measure the time and amplitude of a waveform. Measuring Ring Time (convertible to Frequency) and Amplitude on Rising Edge of Pulse To measure the ring time on the rising edge of the pulse, follow the steps below. Push the CURSOR button to view the Cursor menu. - Page 58 Application Examples Measuring Pulse Width To analyze a pulse signal and to know its width, follow the steps below. Push the CURSOR button to view the Cursor menu. Push F1 the Type option button and select Time. Push F2 or F3 the Source option button and select CH1. Push F4 to select a cursor.
- Page 59 Application Examples Measuring Rise Time of Pulse You may need to measure the rise time of the pulse in many application environments, usually, to measure the rise time between the 10% and 90% levels of the pulse waveform. To do so, follow the steps below.
-
Page 60: Oise
Application Examples 5 divisions 6.3 Example 3: Analyzing Input Signals to Eliminate Random Noise In certain circumstances, to display a noisy signal on the oscilloscope and to get its details, you may follow the steps below to analyze this signal. Observing Noisy Signal Press the ACQUIRE button to see the Acquire menu. - Page 61 Application Examples clearly. See the figure below for better understanding. Eliminating Random Noise Press the ACQUIRE button to see the Acquire menu. Push the Type option button and select Real Time. Push the Average option button. Push the Averages option button and adjust the number of running averages to watch the change in the waveform display.
-
Page 62: Example 4: Capturing Single-Shot Signal
Application Examples 6.4 Example 4: Capturing Single-shot Signal You may refer to the following example to easily capture some aperiodic signals like pulses and glitches. To set for a single-shot acquisition, follow the steps below. First, set up the oscilloscope probe and the attenuation factor of CH1. Turn the vertical VOLTS/DIV and horizontal SEC/DIV knobs to a proper position for a better examination of the signal. - Page 63 Application Examples First, prepare two oscilloscope probes and set the switches to 10X on both probes. Push the CH1 MENU button and set the Probe option attenuation to 10X; push the CH2 MENU button and set the Probe option attenuation to 10X. Connect the CH1 probe to the input of the network, and connect the CH2 probe to the output.
-
Page 64: Example 6: Triggering On Pulse Width
Application Examples 6.6 Example 6: Triggering on Pulse Width Triggering on a Specific Pulse Width While testing the pulse width of a signal in a circuit, you may need to verify the pulse width is consistent with the theoretic value. Or even if the edge triggering shows that your signal has the same pulse width with the specific signal, you still doubt about the result. -
Page 65: Example 7: Triggering On Video Signal
Application Examples As shown in the above figure, you can get a stable waveform display if inputting a square wave at the frequency of 1KHz, with pulse width set to 500μs. 6.7 Example 7: Triggering on Video Signal Assume that you are monitoring the video signals of a television to see if they are input normally, and the video signal is of an NTSC system. -
Page 66: Signal
Application Examples Push F1 to select Video for the Type option. Push the Source option button to select CH1; push the Polarity option button to select Normal; push the Standard option button to select NTSC; push the Sync option button to select Line Number. -
Page 67: Signal
Application Examples the figure below. 6.9 Example 9: Using Overtime Trigger to Measure Long Pulse Signal It is not easy to observe some part of a long pulse signal by using the edge or pulse width trigger. In such case, you can use the overtime trigger by following steps. Push the TRIG MENU button to see the Trigger menu. -
Page 68: Example 10: Using Math Functions To Analyze Waveforms
Application Examples Note: The difference between the overtime and the delay triggers is that the overtime trigger can identify the pulse you need according to your set time and trigger on any point of the pulse. In the other word, the overtime trigger occurs based on pulse identification. It is similar to the >... -
Page 69: Example 11: Measuring Data Propagation Delay
Application Examples otherwise, differences in probe compensation will appear as errors in the differential signal. As illustrated in the above figure, input a 1KHz sine wave from CH1 and a 1KHz square wave from CH2. Follow the above steps to set up the Math menu, and observe the subtracted waveform as shown in the figure below. - Page 70 Application Examples data. To set the propagation delay measurement, follow the steps below. Connect two oscilloscope probes respectively to the CS (chip-select) pin and the DATA pin on the chip. Set the Probe option attenuation to 10X for both probes. Open CH1 and CH2 at the same time, both with the attenuation of 10X.
- Page 71 Application Examples DATA DSO5000 Series Digital Storage Oscilloscope User Manual...
-
Page 72: Chapter 7 Troubleshooting
6) In addition, you may press the Auto Measure button to perform an automatic detection of signals at first. Contact HANTEK Technical Support department in time if there is still no display of waveforms. 3. If the waveform of the input signal is distorted seriously, follow these steps: 1)... -
Page 73: Chapter 8 Specifications
Chapter 8 Specifications 8.1 Technical Specifications All specifications herein mentioned apply to the DSO5000BM series oscilloscopes. Before checking an oscilloscope from HANTEK to see if it complies with these specifications, make sure it meets the following conditions: The oscilloscope must have been operating continuously for twenty minutes under the specified operating temperature. - Page 74 Specifications Vertical A/D Converter 8-bit resolution, each channel sampled simultaneously VOLTS/DIV Range 2mV/div to 5V/div at input BNC Position Range 2mV/div to 200mV/div, ±2V >200mV/div to 5V/div, ±50V Analog Bandwidth in 2mV/div to 20mV/div, ±400mV Normal and Average 50mV/div to 200mV/div, ±2V modes at BNC or with probe, DC 500mV/div to 2V/div, ±40V Coupled...
- Page 75 Specifications 1div from DC to 1.5div from 10MHz 10MHz; to 100MHz; 1.5div from 10MHz to 2div from 100MHz to Full Full 200mV from DC to 200mV from DC to 100MHz 100MHz; 350mV from 100MHz to 200MHz EXT/5 1V from DC to 1V from DC to 100MHz 100MHz;...
- Page 76 Specifications Mode Positive pulse or Negative pulse Pulse Width Trigger Equal: The oscilloscope triggers when the trailing edge of the pulse Point crosses the trigger level. Not Equal: If the pulse is narrower than the specified width, the trigger point is the trailing edge. Otherwise, the oscilloscope triggers when a pulse continues longer than the time specified as the Pulse Width.
- Page 77 Specifications Edge Trigger mode: The oscilloscope counts all edges of sufficient magnitude and correct polarity. Video Trigger mode: The Frequency Counter does not work. Acquisition Acquisition Modes Normal, Peak Detect, and Average Acquisition Rate, Up to 2000 waveforms per second per channel (Normal acquisition mode, typical no measurement) Single Sequence...
-
Page 78: Accessories
Packing Length 385mm Width 200mm Height 245mm Gross Weight inclusive of all accessories 约 2.5Kg 8.2 Accessories All the following accessories are available by contacting your local HANTEK distributor. Standard Accessories Sketch Description DSO5000 Series Digital Storage Oscilloscope User Manual... - Page 79 (rated 300Vrms CAT II) when the switch is in the X10 position. Each probe consists of all necessary fittings. A quick guide of the DSO5000BM series oscilloscopes. It gives a description mainly on functions and operating basis of these oscilloscopes.
-
Page 80: Chapter 9 Services And Support
Chapter 9 Services and Support Thank you for choosing HANTEK. Please contact us through the following ways should you have any inquiry regarding our products. We shall do our best to help you. Contact your local HANTEK distributor; 1. Contact your local HANTEK field office;... -
Page 81: Chapter 10 General Care And Cleaning
General Care and Cleaning Chapter 10 General Care and Cleaning 10.1 General Care Do not put or leave the device in a place where the LCD display will be exposed to direct sunlight for long periods of time. Note: To avoid damage to the oscilloscope or probes, do not expose them to sprays, liquids, or solvents. -
Page 82: Appendix A Harmful And Poisonous Substances Or Elements
Harmful and Poisonous Substances or Elements Appendix A Harmful and Poisonous Substances or Elements Harmful and poisonous substances or elements Component Cr(Vi) PBDE Shell and Chassis Display Module Circuit Board Power Supply Electric Wire and Cable Assembly Connector Fastener and Installed Hardware Other Accessories (including probes) Others... -
Page 83: Appendix B Index
Harmful and Poisonous Substances or Elements Appendix B Index Search by alphabetical order AC coupling Factory setup ACQUIRE button FFT aliasing Acquisition mode FFT Window Amplitude cursor FFT Zoom Application examples Field synchronization Automatic measurement Fine resolution AUTOSET Force trigger AUTOSET button Frequency counter Autoset function... - Page 84 Harmful and Poisonous Substances or Elements MATH MENU button SEC/DIV knob MEASURE button Self calibration Measure FFT spectrum SET TO 50% button Measurement cursor Simple measurement Mechanical Sine wave Mechanical shock SINGLE SEQ button Menu hiding Slope Multi-functional knob Slope trigger Software installation CD Square wave Negative pulse...
- Page 85 Harmful and Poisonous Substances or Elements XY format...
Need help?
Do you have a question about the DSO5000BM Series and is the answer not in the manual?
Questions and answers